Employee productivity is a key factor in organizational success. Tracking hours worked, task completion, errors, and efficiency can be challenging without a structured system. The Employee Productivity Dashboard in Power BI provides a ready-to-use solution for managers and supervisors to monitor workforce performance, identify bottlenecks, and make data-driven decisions.
In this article, we will explore the features, advantages, best practices, and FAQs of using this dashboard.
What Is an Employee Productivity Dashboard?
An Employee Productivity Dashboard is an interactive tool that visualizes key metrics related to employee performance. It consolidates data such as hours worked, tasks completed, errors made, and efficiency into one easy-to-read dashboard.
With Power BI, this dashboard enables organizations to:
-
Monitor individual, departmental, and overall workforce productivity
-
Identify underperforming areas or employees
-
Evaluate trends over time
-
Make informed decisions to improve efficiency and quality
Key Features of the Employee Productivity Dashboard
The dashboard consists of multiple pages to provide comprehensive insights into workforce performance:
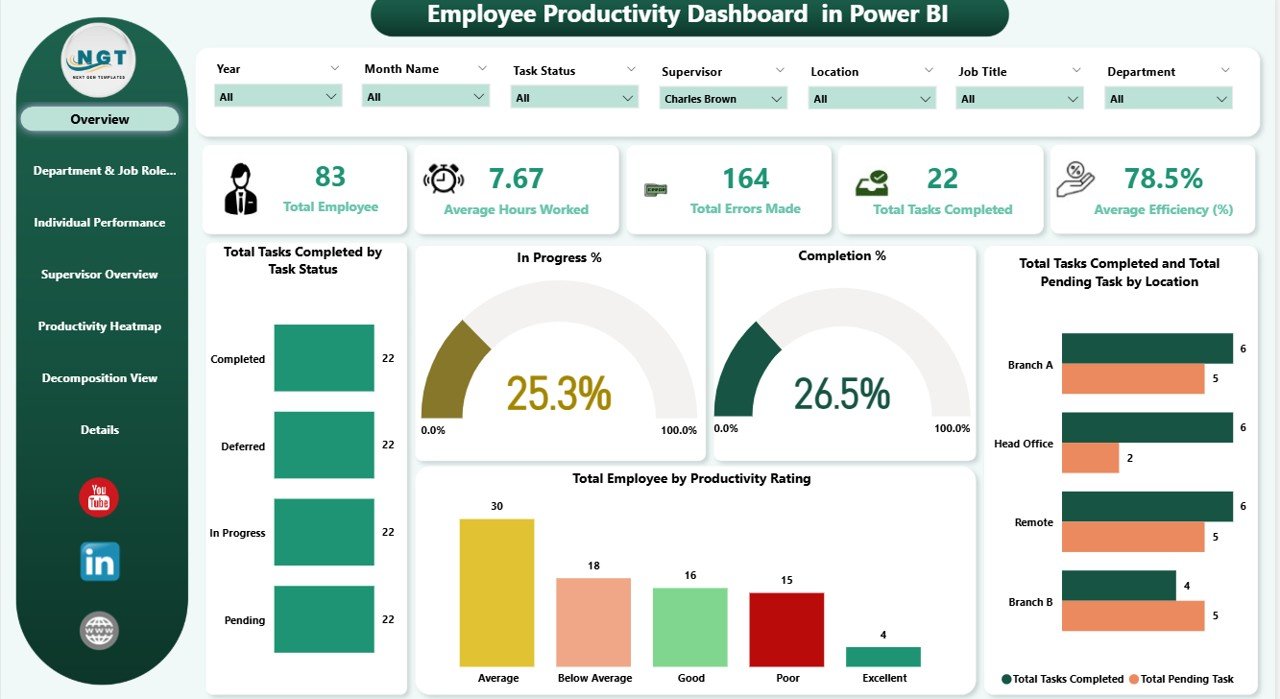
1. Overview Page
The Overview Page provides a high-level snapshot using cards and charts:
Cards:
-
Total Employee – Number of employees tracked
-
Average Hours Worked – Average hours logged per employee
-
Total Errors Made – Number of errors recorded
-
Total Tasks Completed – Tasks completed across all employees
-
Average Efficiency (%) – Average efficiency rate
Charts:
-
Total Tasks Completed by Task Status – Completed, In Progress, Pending
-
In Progress % – Percentage of tasks currently in progress
-
Completion % – Overall task completion rate
-
Total Employees by Productivity Rating – Categorize employees by performance level
-
Total Tasks Completed and Total Pending Task by Location – Visualize task distribution by office or location
Click to Buy Employee Productivity Dashboard in Power BI
2. Department & Job Role Analysis
This page allows managers to evaluate productivity at the team and role level:
Charts:
-
Average Hours Worked by Department – Track time allocation across teams
-
Total Errors Made by Department – Identify departments with frequent errors
-
Total Tasks Completed, Total Pending Task, and Completion % by Department – Performance overview for each team

3. Individual Performance
The Individual Performance Page provides detailed employee-level insights:
Charts:
-
Average Hours Worked and Average Efficiency (%) by Employee Name
-
Total Errors Made by Employee Name
-
Completion % by Employee Name
This enables managers to identify high performers and employees who may require additional support.

Click to Buy Employee Productivity Dashboard in Power BI
4. Supervisor Overview
The Supervisor Overview Page evaluates team leaders and their respective teams:
Charts:
-
Total Errors Made by Supervisor
-
Average Hours Worked by Supervisor
-
In Progress % by Supervisor
-
Total Tasks Completed, Total Pending Task, and Completion % by Supervisor
This page helps track managerial effectiveness and team performance.

Click to Buy Employee Productivity Dashboard in Power BI
5. Productivity Heatmap
The Productivity Heatmap Page visualizes performance based on productivity ratings:
Charts:
-
Total Errors Made by Productivity Rating
-
Average Hours Worked by Productivity Rating
-
Average Efficiency (%) by Productivity Rating
-
Total Tasks Completed, Total Pending Task, and Completion % by Productivity Rating
This page highlights trends and identifies areas for improvement.

6. Decomposition View
The Decomposition View Page uses a decomposition tree to analyze metrics hierarchically:
-
Break down productivity metrics by employee, department, or task type
-
Identify root causes of inefficiencies or errors

Click to Buy Employee Productivity Dashboard in Power BI
7. Details Page
The Details Page provides tabular data for detailed analysis:
-
View all individual records in a table format
-
Drill through data for deeper insights

Advantages of Using the Employee Productivity Dashboard
-
Centralized Performance Tracking: Monitor all employees and teams in one dashboard
-
Visual Insights: Charts and heatmaps provide quick understanding of productivity trends
-
Data-Driven Decisions: Identify high-performing employees and areas needing improvement
-
Efficiency Optimization: Track errors, hours worked, and task completion for better planning
-
Team & Supervisor Analysis: Evaluate both individual and managerial performance
-
Trend Monitoring: Compare MTD, YTD, or historical performance to identify improvements
Best Practices for Using the Dashboard
Click to Buy Employee Productivity Dashboard in Power BI
-
Update Data Regularly: Ensure employee hours, tasks, and errors are updated promptly
-
Segment Analysis: Evaluate by department, role, or supervisor for actionable insights
-
Focus on KPIs: Prioritize key metrics like efficiency, errors, and completion rates
-
Use Conditional Formatting: Highlight employees or teams that need support
-
Track Trends Over Time: Compare historical data for proactive performance management
-
Combine with Feedback: Use dashboard insights alongside employee feedback for holistic management
Frequently Asked Questions (FAQs)
Q1: Can I customize the KPIs tracked on this dashboard?
Yes, Power BI allows you to add or remove KPIs, change calculations, and modify visualizations.
Q2: Can I track multiple locations or departments?
Yes, the dashboard can filter and segment data by location, department, or team.
Q3: How often should data be updated?
Daily or weekly updates are recommended to maintain accurate performance tracking.
Q4: Can this dashboard help identify training needs?
Absolutely. By analyzing errors and efficiency, managers can pinpoint employees or teams that require training.
Q5: Does this dashboard support drill-down analysis?
Yes, Power BI enables drill-downs to analyze individual employees, supervisors, or departments.
Conclusion
Click to Buy Employee Productivity Dashboard in Power BI
The Employee Productivity Dashboard in Power BI is a comprehensive tool for tracking, analyzing, and improving workforce performance. With MTD and YTD metrics, supervisor and individual insights, heatmaps, and decomposition views, this dashboard provides actionable intelligence for managers and HR teams.
Visit our YouTube channel to learn step-by-step video tutorials
Youtube.com/@NeotechNavigators
Watch the step-by-step video Demo:
Click to Buy Employee Productivity Dashboard in Power BI