Managing office parking efficiently has become an important part of modern workplace operations. With limited parking spaces, different vehicle categories, and varied employee schedules, organizations need a smart way to monitor, analyze, and optimize parking usage. Instead of relying on guesswork, Excel offers a powerful solution through an Office Parking Utilization Report.
In this article, we will explain how the Office Parking Utilization Report in Excel works, its key features, advantages, best practices, and how organizations can use it to make data-driven decisions.
Click to Purchases Office Parking Utilization Report in Excel
What Is an Office Parking Utilization Report?
An Office Parking Utilization Report is a structured Excel-based tool that tracks and analyzes how parking spaces are being used in a workplace. It provides insights into:
-
The percentage of spaces occupied vs. vacant
-
Parking usage by department or vehicle type
-
Overstay and underutilization trends
-
Month-on-month usage changes
-
Categories of vehicles taking up high-priority slots
By organizing this information into tables, slicers, and charts, the report helps decision-makers understand usage patterns, identify problems, and implement effective parking policies.
Why Do Businesses Need a Parking Utilization Report?
Parking management is more than just assigning spots. If not managed properly, it can lead to:
-
Employee dissatisfaction due to lack of parking availability.
-
Inefficient space usage where certain areas remain empty while others are overfilled.
-
Security issues when unauthorized vehicles occupy spaces.
-
Cost implications for renting or expanding parking unnecessarily.
With an Excel-based utilization report, businesses can:
-
Track daily, weekly, and monthly parking data.
-
Forecast parking demand based on historical usage.
-
Make informed decisions on space allocation.
-
Improve overall workplace satisfaction.
Click to Purchases Office Parking Utilization Report in Excel
Key Features of the Office Parking Utilization Report in Excel
We have designed this report with multiple pages to make it interactive, easy to use, and insightful.
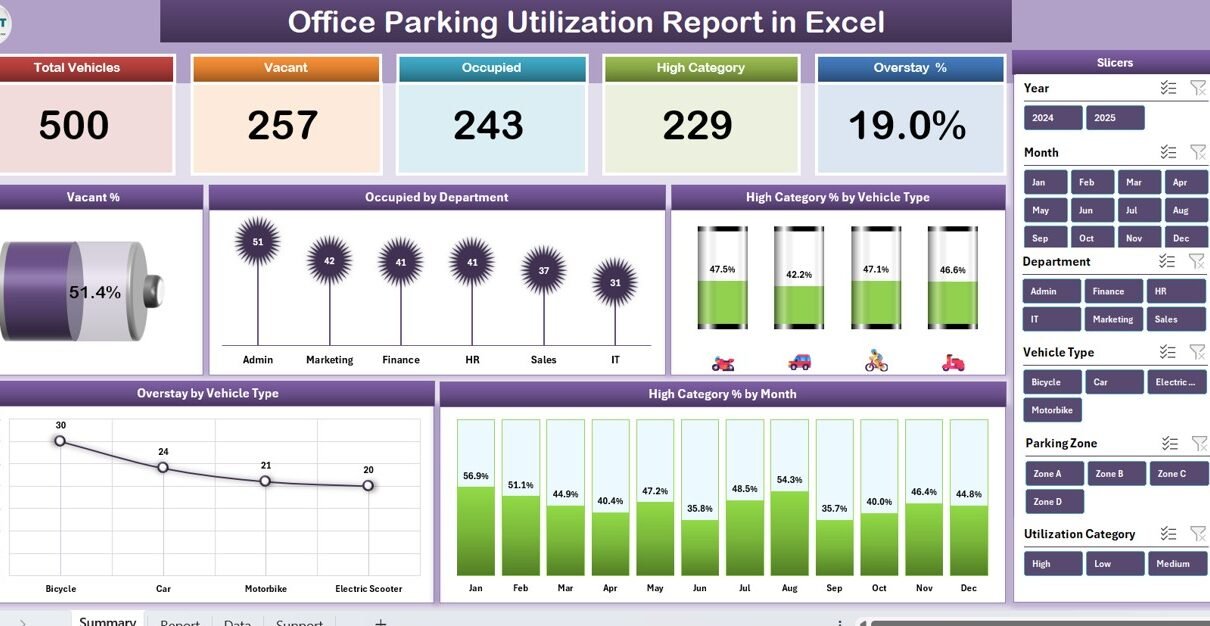
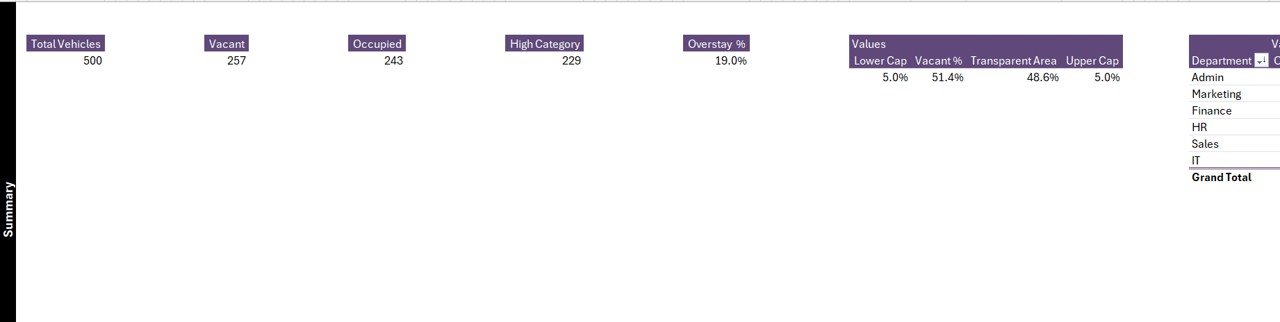
Summary Page
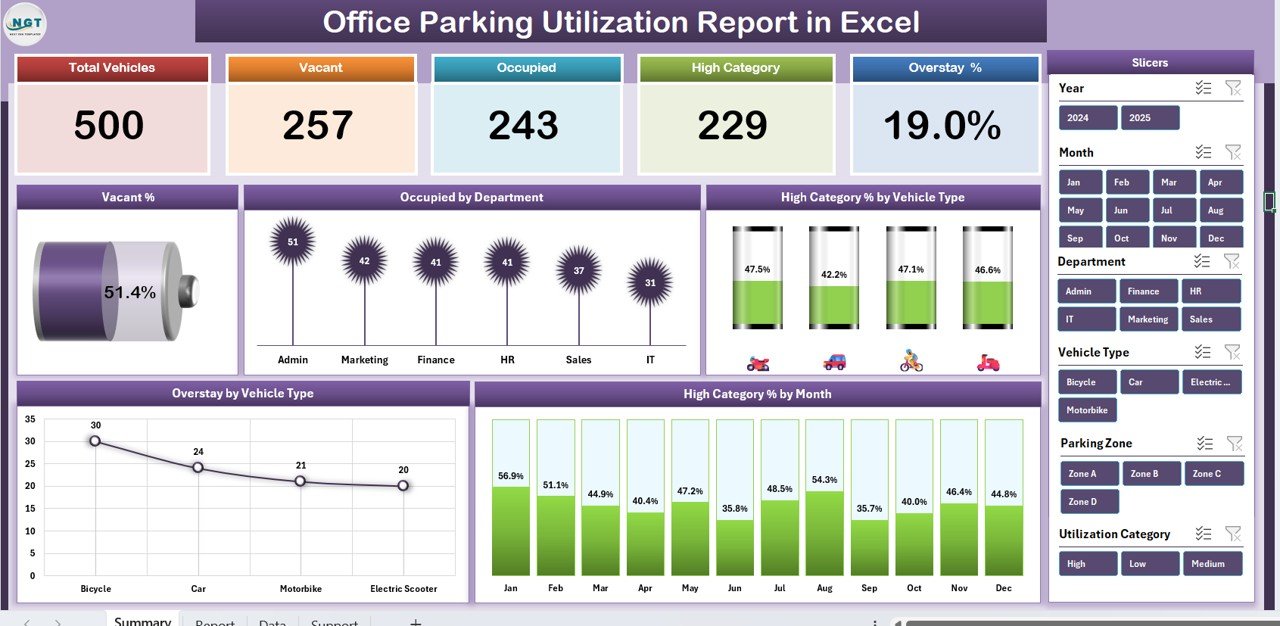
The Summary Page is the dashboard view of the report. It provides a quick snapshot of utilization with visual clarity.
Top 5 KPI Cards:
- Total Parking Spaces
- Occupied Spaces
- Vacant %
- High Category %
- Overstay Count
-
Right-Side Slicer: Allows filtering by department, vehicle type, or month.
Charts for Better Insights:
- Vacant % Chart – Displays percentage of unused spaces.
- Occupied by Department – Highlights department-wise allocation and usage.
- High Category % by Vehicle Type – Shows premium or priority space consumption by vehicle type.
- Overstay by Vehicle Type – Identifies vehicles that overstay beyond allotted time.
- High Category % by Month – Tracks month-on-month usage of high-priority slots.
This page helps management quickly identify trends and problem areas.
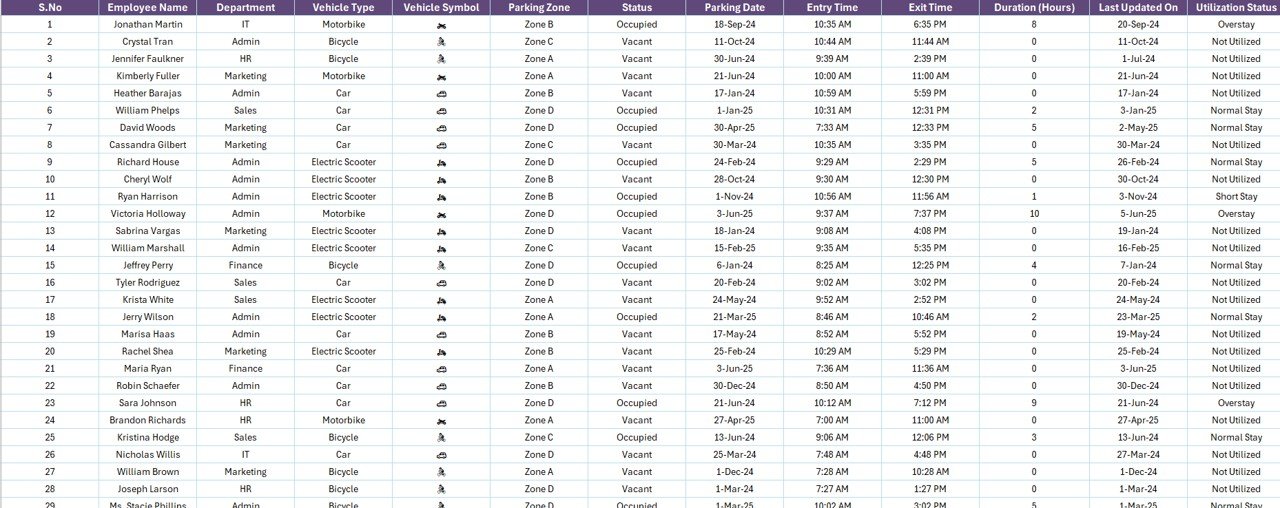
Report Page
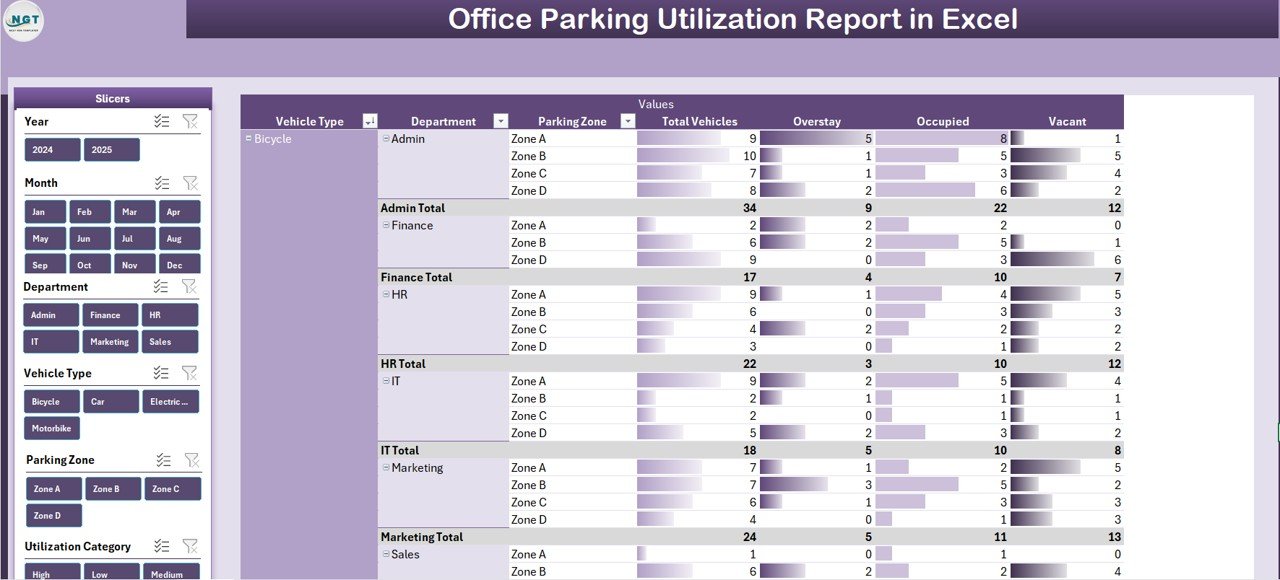
The Report Page provides detailed tabular insights for deeper analysis.
-
Left-Side Slicer: Enables filtering by vehicle, department, or time period.
Information Table: Contains comprehensive details such as:
- Vehicle ID / Number
- Department
- Parking Slot Type (Regular / Priority / Visitor)
- Entry and Exit Time
- Duration of Stay
- Overstay Indicator
This sheet is essential for supervisors or facility managers who need line-level data for audits or compliance.
Data Sheet
The Data Sheet is the backbone of the report. It stores all raw inputs including:
-
Vehicle details
-
Department allocations
-
Parking categories
-
Entry and exit timestamps
This sheet can be regularly updated by the facility team to keep reports accurate.
Support Sheet
The Support Sheet contains reference lists, validation ranges, and dropdown values for slicers. It ensures consistency in inputs and smooth functioning of the dashboard.
Advantages of Using an Office Parking Utilization Report in Excel
Implementing this report offers multiple benefits:
✅ Improved Space Efficiency – Helps maximize the use of available parking slots.
✅ Better Departmental Allocation – Ensures fairness across teams.
✅ Reduced Conflicts – Transparent reporting avoids disputes among employees.
✅ Cost Savings – Prevents unnecessary expansion of parking space.
✅ Data-Driven Planning – Enables long-term forecasting and policy setting.
✅ Easy to Use – Built in Excel, no need for specialized software.
✅ Customizable – Can be adapted for small offices or large organizations.
How to Use the Report Effectively
Using the Office Parking Utilization Report is straightforward:
-
Input Data: Update the Data Sheet with vehicle entries, exits, and department details.
-
Refresh Dashboard: Pivot tables and slicers automatically update the Summary Page.
-
Analyze Reports: Use charts and tables to understand usage trends.
-
Make Decisions: Adjust parking policies based on findings.
Best Practices for the Office Parking Utilization Report
To get maximum value from this Excel-based report, follow these best practices:
🔹 Update Data Regularly: Daily updates ensure accuracy.
🔹 Use Department Codes: Keep inputs standardized.
🔹 Track Overstay Trends: Identify repeat offenders and set penalties.
🔹 Segment Vehicle Types: Differentiate between two-wheelers, cars, and visitors.
🔹 Integrate Security Logs: Cross-check vehicle entry records for security.
🔹 Review Monthly: Conduct monthly reviews to adjust space allocation.
🔹 Automate Data Entry: Use simple macros or imports to reduce manual errors.
Click to Purchases Office Parking Utilization Report in Excel
Real-World Applications of Parking Utilization Reporting
-
Corporate Offices: Manage limited slots across large employee bases.
-
IT Parks: Handle thousands of employees with multiple entry/exit points.
-
Hospitals & Institutions: Ensure critical staff and visitors have priority parking.
-
Co-Working Spaces: Optimize shared parking among multiple companies.
-
Government Offices: Maintain transparency and security in parking allocation.
Common Challenges in Parking Utilization
Even with a report, organizations may face challenges like:
-
Incomplete or delayed data entry.
-
Employees not following slot assignments.
-
Seasonal variation in parking demand.
-
Visitors using staff spaces.
-
Difficulty in integrating external systems (e.g., RFID entry gates).
By acknowledging these challenges early, managers can design policies that minimize them.
Conclusion
An Office Parking Utilization Report in Excel is a practical, cost-effective, and user-friendly way to manage parking spaces. It combines raw data, interactive slicers, and visual dashboards to deliver actionable insights. Businesses that adopt this report can reduce parking chaos, optimize space usage, and improve employee satisfaction without spending on expensive third-party software.
Frequently Asked Questions (FAQs)
1. What is the purpose of an Office Parking Utilization Report?
It helps track and analyze how office parking spaces are being used, ensuring better planning and management.
2. Can this report work for small offices?
Yes. It can be customized for any office size, from small teams to large organizations.
3. How often should we update the report?
Daily updates are ideal, but weekly summaries can also work depending on office size.
4. Does it require advanced Excel knowledge?
No. The report is designed with slicers, charts, and tables that are easy to use. Basic Excel knowledge is enough.
5. Can it track overstay or unauthorized parking?
Yes. The report includes an overstay indicator and can flag vehicles that violate rules.
6. Is the template customizable?
Absolutely. You can modify KPIs, charts, or add extra sheets based on your requirements.
7. How does it help in cost savings?
By identifying underutilized spaces, businesses can avoid unnecessary expansion or rentals, saving costs.
Visit our YouTube channel to learn step-by-step video tutorials