• Excel and VBA
    • VBA Course
    • Shortcut Keys
    • Useful Formulas
    • Basic Charts
    • Advanced Chart
    • Sort and Filter
    • Pivot Table
    • Data Validation
    • Conditional Formatting
    • Auto Fill and Flash Fill
    • Find and Replace
  • DownloadsPopular
    • Excel VBA Tools
    • Dashboard
      • Excel Dashboard
      • KPI Dashboard
      • Power BI Dashboard
    • Charts
      • Progress Charts
      • Info-graphics
      • Animated Charts
      • Comparisons
      • Gantt Charts
      • Heatmaps
      • Speedometers
      • Timelines
    • Inventory Management
    • HR and Payrolls
    • VBA Automation
    • Utilities and Converters
    • Checklist
    • Calendars
    • Data Analysis
    • Excel Templates
    • Financial Tools
    • Project Management
    • Sales and Marketing
    • Productivity
  • Excel Dashboard
  • Templates
  • Tutorials
    • Charts and Visualization
    • VBA
    • Excel Tips and Tricks
  • Power BI
  • Template StoreNew
  • CoursesNew
  • About Us
  • Contact Us

PK: An Excel Expert

Transforming Data into Decisions

Home>Blogs>Dashboard>Account Management KPI Dashboard in Excel
Dashboard

Account Management KPI Dashboard in Excel

31 Jan 2025
607Comments Off on Account Management KPI Dashboard in Excel

In today’s data-driven business world, managing accounts efficiently is crucial. Companies need to track their key performance indicators (KPIs) to ensure they are meeting financial and customer relationship goals. An Account Management KPI Dashboard in Excel is an excellent tool for businesses to monitor and analyze their account performance in real-time.

This article will walk you through the Account Management KPI Dashboard, its key features, advantages, best practices, and frequently asked questions.

Table of Contents

Toggle
    • Click to Purchase Account Management KPI Dashboard
  • What is an Account Management KPI Dashboard?
  • Key Features of the Account Management KPI Dashboard in Excel
    • Home Sheet
    • Dashboard Sheet
    • KPI Trend Sheet
    • Displays:
    • Click to Purchase Account Management KPI Dashboard
    • Actual Numbers Input Sheet
    • Target Sheet
    • Previous Year Numbers Sheet
    • KPI Definition Sheet
  • Advantages of Using an Account Management KPI Dashboard in Excel
    • Click to Purchase Account Management KPI Dashboard
  • Best Practices for Using the KPI Dashboard in Excel
  • Conclusion
  • Frequently Asked Questions (FAQs)
    • Click to Purchase Account Management KPI Dashboard
    • Click to Purchase Account Management KPI Dashboard

Click to Purchase Account Management KPI Dashboard

What is an Account Management KPI Dashboard?

An Account Management KPI Dashboard is a pre-built Excel template that helps businesses track important KPIs related to account performance, financial goals, and customer management. It provides a centralized view of all important metrics, allowing for quick decision-making and performance analysis.

Key Features of the Account Management KPI Dashboard in Excel

This KPI dashboard consists of seven worksheets, each serving a unique purpose:

Home Sheet

Home Sheet
Home Sheet
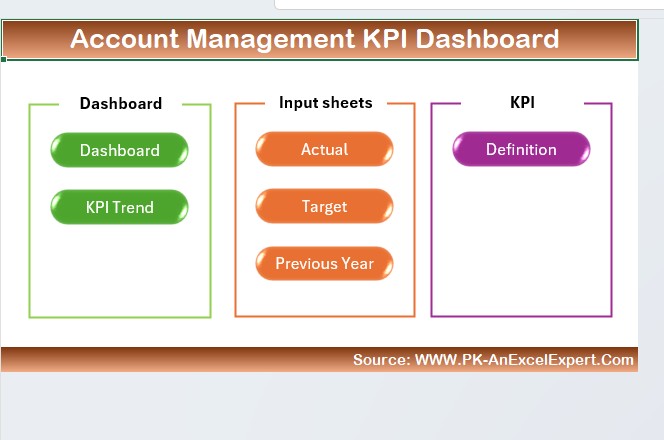
  • Acts as an index sheet where users can navigate to different sections of the dashboard.
  • Contains six buttons to jump to respective sheets for quick access.

Dashboard Sheet

Account Management KPI Dashboard

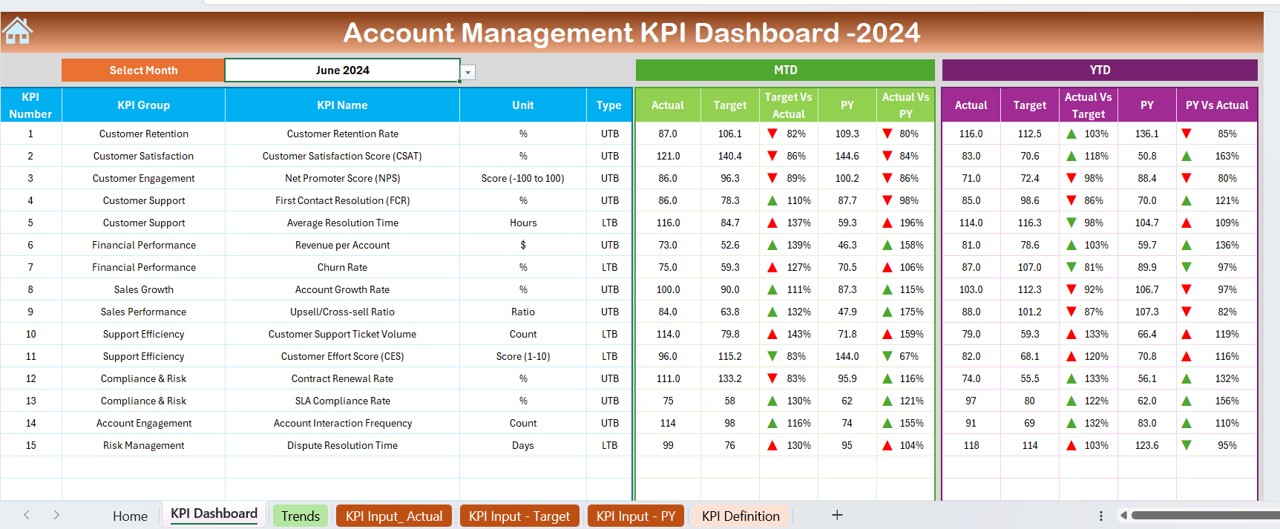
The main sheet displaying all KPIs at a glance.

  • Dropdown selection (D3) to choose a specific month.
  • MTD (Month-to-Date) & YTD (Year-to-Date) performance:
  • Displays Actual, Target, and Previous Year (PY) data.
  • Target Vs Actual and PY Vs Actual with conditional formatting (up/down arrows).

KPI Trend Sheet

KPI Trend Sheet
KPI Trend Sheet
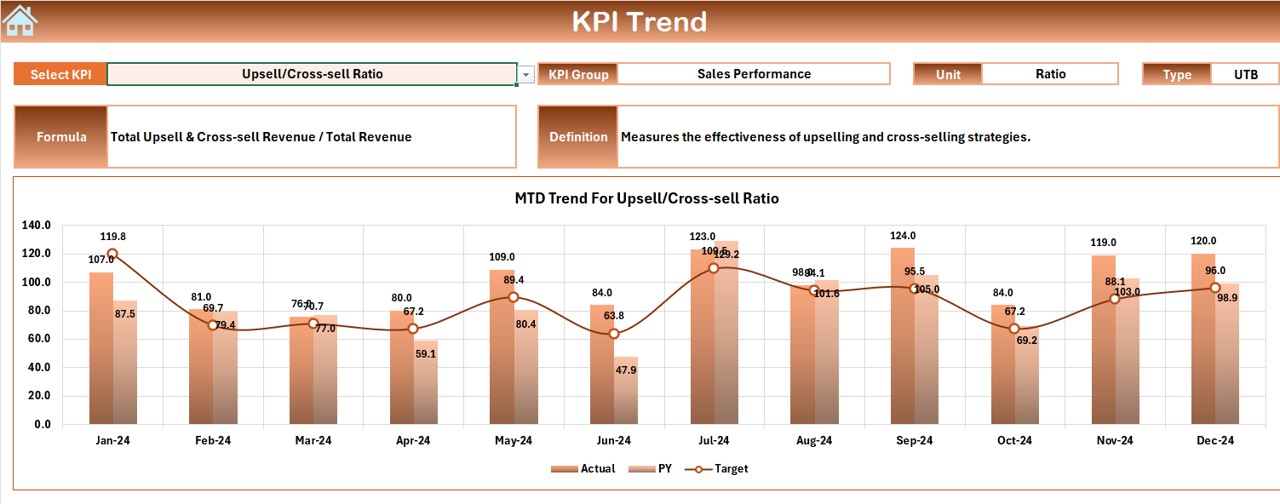
  • Select any KPI from a drop-down menu (C3) to analyze trends.

Displays:

  • KPI Group, Unit, KPI Type (Lower or Upper Better), Formula, and Definition.
  • MTD and YTD Trend Charts for Actual, Target, and PY values.

Click to Purchase Account Management KPI Dashboard

Actual Numbers Input Sheet

Actual Numbers Input Sheet
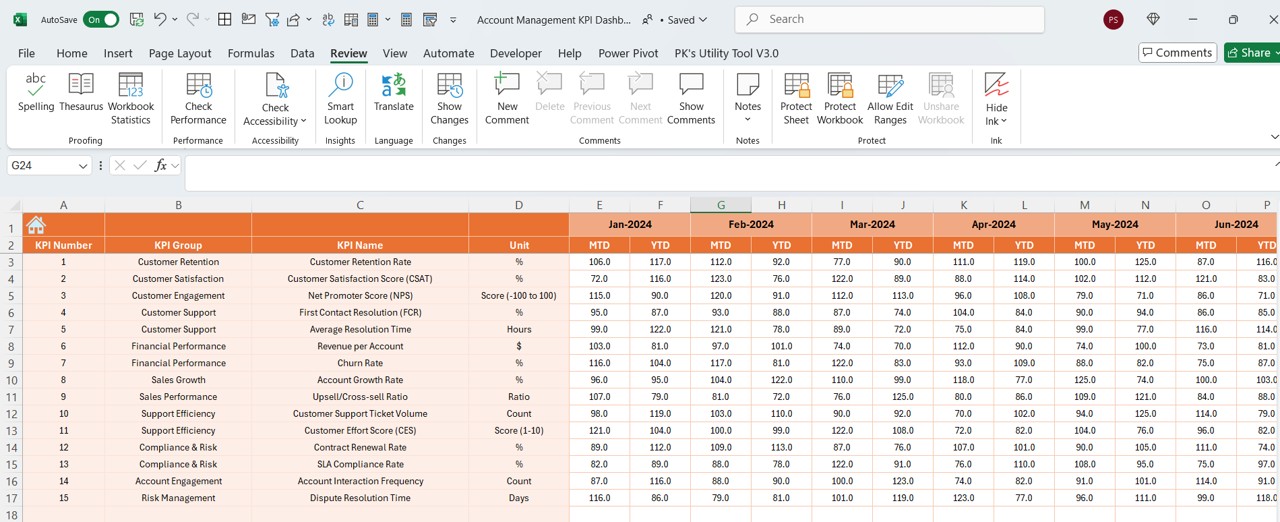
  • Enter actual MTD & YTD numbers for each KPI.
  • Change the starting month from cell E1 (input the first month of the year).

Target Sheet

Target Sheet
Target Sheet
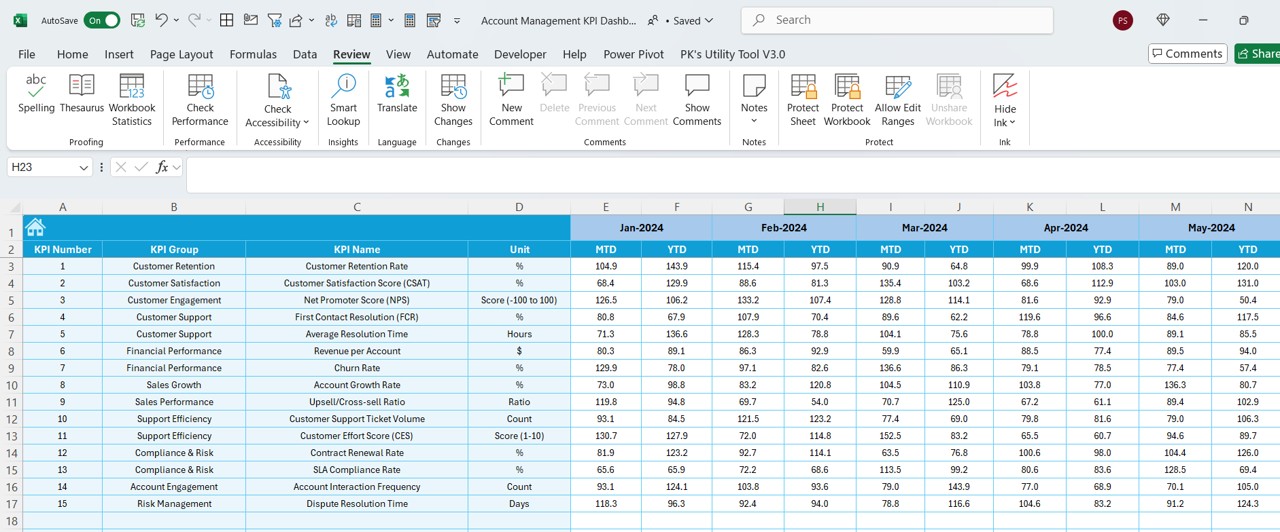
  • Input target numbers for each KPI.
  • Data must be entered for both MTD and YTD.

Previous Year Numbers Sheet

Previous Year Numbers Sheet
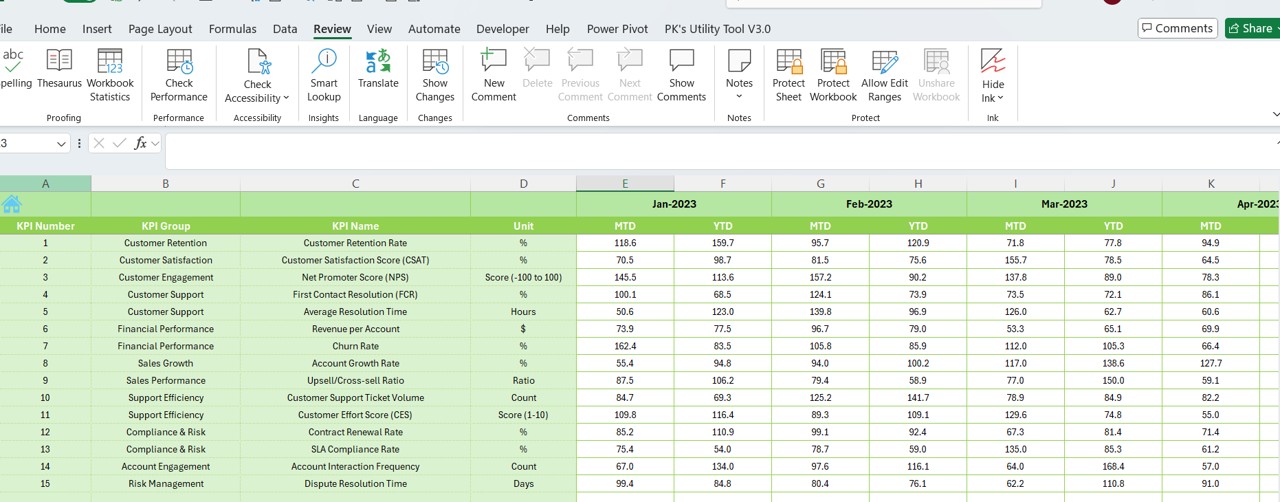
  • Enter last year’s data for each KPI.
  • Same structure as the Actual Numbers sheet.

KPI Definition Sheet

KPI Definition Sheet
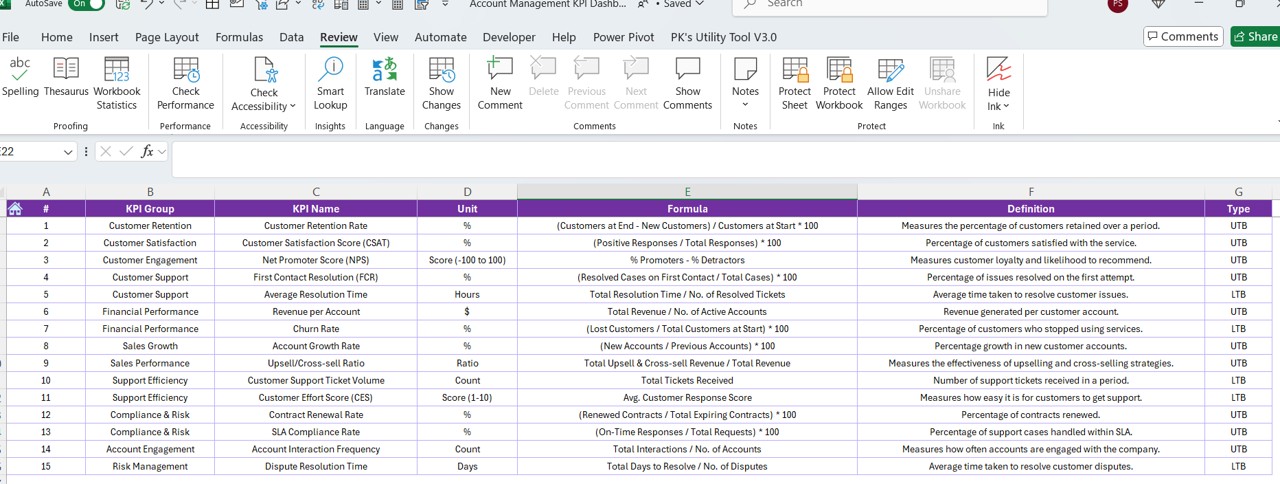
  • Define each KPI with:
  • Name, Group, Unit, Formula, and KPI Definition.

Advantages of Using an Account Management KPI Dashboard in Excel

Real-Time Monitoring

  • Easily track key financial and account performance metrics.
  • Quickly identify gaps between targets and actual performance.

Data-Driven Decision Making

  • Enables management to make informed business decisions.
  • Provides insights into trends, improvements, and problem areas.

Customizable & Flexible

  • Modify the dashboard based on business requirements.
  • Add or remove KPIs as needed.

Saves Time & Effort

  • Pre-built formulas & automated calculations eliminate manual effort.
  • Helps businesses focus on strategy rather than data entry.

 Easy-to-Use Interface

  • Well-structured sheets for quick navigation.
  • Simple drop-down menus for KPI selection.

Click to Purchase Account Management KPI Dashboard

Best Practices for Using the KPI Dashboard in Excel

 Define Clear KPI Goals

Ensure each KPI has a clear objective aligned with business goals.

  • Example: If tracking Customer Retention Rate, set a target percentage.

Regular Data Updates

  • Update the Actual, Target, and Previous Year numbers regularly.
  • Monthly updates improve accuracy and trend analysis.

 Use Conditional Formatting Wisely

  • Visual indicators (e.g., up/down arrows) help in quick decision-making.
  • Green for positive trends, red for negative trends.
  •  Monitor Trends, Not Just Numbers
  • The KPI Trend Sheet provides insights into performance patterns.
  • Helps businesses adjust strategies based on historical data.

 Customize KPIs for Your Needs

  • Modify KPI formulas and definitions based on industry requirements.
  • Add new KPIs or remove unnecessary ones.

Conclusion

An Account Management KPI Dashboard in Excel is a powerful tool for tracking and analyzing key account metrics. It helps businesses improve their financial performance, customer management, and operational efficiency. By leveraging this dashboard, organizations can monitor real-time data, identify trends, and make data-driven decisions effectively.

Frequently Asked Questions (FAQs)

What are the most important KPIs in Account Management?

  • Answer: Some key KPIs include:
  • Customer Retention Rate
  • Revenue Growth Rate
  • Account Profitability
  • Client Satisfaction Score

 Can I customize the KPI Dashboard for my industry?

  • Answer: Yes! The KPI formulas, units, and definitions can be modified based on industry requirements. You can add, remove, or edit KPIs as needed.

 How often should I update the KPI Dashboard?

  • Answer: It’s best to update the dashboard monthly to track trends accurately. However, businesses can choose a weekly or quarterly update depending on their needs.

Is this dashboard suitable for small businesses?

  • Answer: Yes! This Excel-based dashboard is perfect for small, medium, and large enterprises as it helps them track key account metrics efficiently.

 Can I integrate this dashboard with other tools?

  • Answer: While this is an Excel-based tool, you can export data and integrate it with Power BI, Google Sheets, or ERP systems for advanced reporting.

Click to Purchase Account Management KPI Dashboard

Visit our YouTube channel to learn step-by-step video tutorials

Youtube.com/@PKAnExcelExpert


View this post on Instagram


A post shared by Priyendra Kumar (@pkanexcelexpert)

Click to Purchase Account Management KPI Dashboard

Tagged Account Management KPI, Business Analytics, Customer Management, data-driven insights, Excel Dashboard, Financial KPIs, KPI Reporting, KPI trends, performance tracking, Real-Time Reporting.
PK
Meet PK, the founder of PK-AnExcelExpert.com! With over 15 years of experience in Data Visualization, Excel Automation, and dashboard creation. PK is a Microsoft Certified Professional who has a passion for all things in Excel. PK loves to explore new and innovative ways to use Excel and is always eager to share his knowledge with others. With an eye for detail and a commitment to excellence, PK has become a go-to expert in the world of Excel. Whether you're looking to create stunning visualizations or streamline your workflow with automation, PK has the skills and expertise to help you succeed. Join the many satisfied clients who have benefited from PK's services and see how he can take your Excel skills to the next level!
https://www.pk-anexcelexpert.com

Related Articles

Dashboard

Employee Retention KPI Dashboard in Excel

January 28, 2025April 7, 2025 PK
Employee retention is one of the most significant challenges facing businesses today. A high turnover rate can be costly and
Excel Dashboard With Multiple Source Files
Power Pivot Dashboard

Fully Automated Excel dashboard with multiple source files

April 12, 2020February 18, 2025 PK
In this article, we have create a full automatic excel dashboard with multiple excel source files. Each source file can
Dashboard

Maritime KPI Dashboard in Excel

November 4, 2024March 16, 2025 PK
In today’s competitive maritime industry, managing and tracking Key Performance Indicators (KPIs) effectively is critical for improving operational efficiency, minimizing

Post navigation

Christmas Decor Checklist in Excel
Helpdesk Efficiency KPI Dashboard in Excel

Number of items in cart: 0

  • Your cart is empty.
  • Total: $0.00
  • Checkout

Join Our Course

  • Excel Pivot Tables for Data Analysis

Top Categories

  • Charts and Visualization (155)
  • Dashboard (728)
  • Excel Tips and Tricks (185)
  • Power BI (219)
  • Power Pivot (64)
  • Power Point Visualization (4)
  • Power Query (1)
  • Predictive Analytics (5)
  • Productivity (2)
  • Templates (723)
  • VBA (156)

Download Categories

  • Calendars (54)
  • Charts (131)
    • Animated Charts (5)
    • Comparisons (53)
    • Gantt Charts (7)
    • Heatmaps (1)
    • Info-graphics (44)
    • Progress Charts (32)
    • Speedometers (4)
    • Timelines (2)
  • Checklist (229)
  • Dashboard (513)
    • Excel Dashboard (25)
    • KPI Dashboard (366)
    • Power BI Dashboard (122)
  • Data Analysis (12)
  • Excel Templates (73)
  • Excel VBA Tools (45)
  • Financial Tools (9)
  • HR and Payrolls (19)
  • Inventory Management (6)
  • Product (11)
  • Productivity (1)
  • Project Management (15)
  • Sales and Marketing (13)
  • Utilities and Converters (6)
  • VBA Automation (27)
instant= new adsenseLoader( '#quads-ad1-place', { onLoad: function( ad ){ if (ad.classList.contains("quads-ll")) { ad.classList.remove("quads-ll"); } } });

Latest Articles

Fitness Studio KPI Dashboard in Power BI

July 30, 2025July 30, 2025 PK

Construction and Real Estate Cost Efficiency KPI Dashboard in Excel

July 30, 2025July 30, 2025 PK

Ayurveda Centre Management System V1.0 in Excel

July 29, 2025July 29, 2025 PK

Telecommunications Dashboard in Power BI

July 29, 2025July 29, 2025 PK

IT Asset Management Dashboard in Excel

July 29, 2025July 29, 2025 PK

Popular Articles

Sparklines in Power BI

Sparklines in Power BI

May 17, 2022August 10, 2024 PK

Tax Compliance KPI Dashboard in Excel

March 3, 2025March 3, 2025 PK

Library Services KPI Dashboard in Excel

January 12, 2025March 28, 2025 PK

Food Service KPI Dashboard in Excel

October 25, 2024March 16, 2025 PK

Luxury Retail KPI Dashboard in Power BI

March 18, 2025March 18, 2025 PK

Read More about..

  • Advanced Excel
  • VBA Course
  • Dashboard
  • Chart and Visualization
  • VBA Tips
  • Excel Tips and Trics
  • Our Excel Products
  • About US
  • Contact Us


Subscribe to our Newsletter


Download Dashboards

  • Project Management Dashboard
  • Zonal Dashboard
  • Sales Dashboard
  • Outbound Dashboard
  • A Quick Dashboard
  • C-SAT Dashboard
  • Performance Dashboard
  • Process Dashboard
  • Incentive Dashboard
instant= new adsenseLoader( '#quads-ad2-place', { onLoad: function( ad ){ if (ad.classList.contains("quads-ll")) { ad.classList.remove("quads-ll"); } } });

Popular Tags

Business Analytics business intelligence Business Tools Chart and Visualization Checklist checklist template Conditional Formatting Customer Satisfaction data analysis Data visualization Event Management event tracker event tracking Excel Excel calendar excel checklist Excel Dashboard Excel Formula Excel formulas Excel functions Excel Guide Excel Template Excel Templates Excel Tips Excel tools Excel tracker Excel Tutorial HR tools Info-graphics Inventory Management KPI analysis KPI Chart KPI Dashboard KPI tracking Performance Metrics performance tracking Power BI Power BI dashboard Productivity Project Management real-time insights Task Management Task Tracker Task Tracking VBA
  • Excel and VBA
    • VBA Course
    • Shortcut Keys
    • Useful Formulas
    • Basic Charts
    • Advanced Chart
    • Sort and Filter
    • Pivot Table
    • Data Validation
    • Conditional Formatting
    • Auto Fill and Flash Fill
    • Find and Replace
  • DownloadsPopular
    • Excel VBA Tools
    • Dashboard
      • Excel Dashboard
      • KPI Dashboard
      • Power BI Dashboard
    • Charts
      • Progress Charts
      • Info-graphics
      • Animated Charts
      • Comparisons
      • Gantt Charts
      • Heatmaps
      • Speedometers
      • Timelines
    • Inventory Management
    • HR and Payrolls
    • VBA Automation
    • Utilities and Converters
    • Checklist
    • Calendars
    • Data Analysis
    • Excel Templates
    • Financial Tools
    • Project Management
    • Sales and Marketing
    • Productivity
  • Excel Dashboard
  • Templates
  • Tutorials
    • Charts and Visualization
    • VBA
    • Excel Tips and Tricks
  • Power BI
  • Template StoreNew
  • CoursesNew
  • About Us
  • Contact Us
Copyright © 2023 PK-AnExcelExpert.com - Privacy Policy
This website uses cookies to improve your user experience, analyze site traffic and serve targeted ads in accordance with our Privacy Policy ACCEPT
Privacy & Cookies Policy

Privacy Overview

This website uses cookies to improve your experience while you navigate through the website. Out of these cookies, the cookies that are categorized as necessary are stored on your browser as they are essential for the working of basic functionalities of the website. We also use third-party cookies that help us analyze and understand how you use this website. These cookies will be stored in your browser only with your consent. You also have the option to opt-out of these cookies. But opting out of some of these cookies may have an effect on your browsing experience.
Necessary
Always Enabled
Necessary cookies are absolutely essential for the website to function properly. This category only includes cookies that ensures basic functionalities and security features of the website. These cookies do not store any personal information.
Non-necessary
Any cookies that may not be particularly necessary for the website to function and is used specifically to collect user personal data via analytics, ads, other embedded contents are termed as non-necessary cookies. It is mandatory to procure user consent prior to running these cookies on your website.
SAVE & ACCEPT