In today’s fast-moving animation and visual effects industry, studios face constant pressure to deliver high-quality output on time and within budget. At the same time, creative leaders, production managers, and finance teams must track performance accurately. However, when data sits across multiple spreadsheets, emails, and tools, teams struggle to see the full picture. Therefore, organizations need a centralized, visual, and data-driven solution.
That is exactly where an Animation & VFX KPI Dashboard in Power BI becomes essential.
This detailed guide explains everything you need to know about an Animation & VFX KPI Dashboard in Power BI. Moreover, it covers what the dashboard is, why it matters, how it works, its key features, advantages, opportunities for improvement, best practices, and frequently asked questions. Most importantly, the language remains simple, clear, and practical so that anyone can understand and implement it easily.
Click to buy Animation & VFX KPI Dashboard in Power BI
What Is an Animation & VFX KPI Dashboard in Power BI?
An Animation & VFX KPI Dashboard in Power BI is a ready-to-use business intelligence solution designed to track, analyze, and visualize key performance indicators related to animation and visual effects production.
Instead of reviewing raw production data manually, this dashboard converts structured Excel data into interactive visuals. As a result, studios gain instant visibility into productivity, quality, delivery timelines, and performance trends.
Since Power BI handles complex calculations and visuals automatically, teams save time while improving accuracy. Moreover, because the data source uses Excel, studios do not need complex databases or advanced IT infrastructure.
Why Do Animation & VFX Studios Need KPI Dashboards?
Animation and VFX projects involve multiple departments, long production cycles, and strict deadlines. Therefore, studios must monitor performance continuously. Without a KPI dashboard, decision-making often becomes reactive instead of proactive.
An Animation & VFX KPI Dashboard in Power BI helps because it:
- Centralizes all KPI data in one place
- Highlights performance gaps early
- Improves accountability across teams
- Supports data-driven production planning
- Enables leadership to act quickly and confidently
Furthermore, this dashboard bridges the gap between creative output and business performance.
How Does an Animation & VFX KPI Dashboard in Power BI Work?
The dashboard works by connecting Power BI to a structured Excel data source. Once users update the Excel file, Power BI refreshes the visuals automatically. Consequently, teams always see the latest performance numbers.
The solution follows a simple three-step process:
- Enter KPI data in Excel
- Refresh the Power BI dashboard
- Analyze KPIs using slicers, tables, and charts
Because of this structure, even non-technical users can operate the dashboard comfortably.
What Are the Key Features of the Animation & VFX KPI Dashboard in Power BI?
This ready-to-use dashboard includes three powerful pages that cover summary reporting, trend analysis, and KPI definitions.
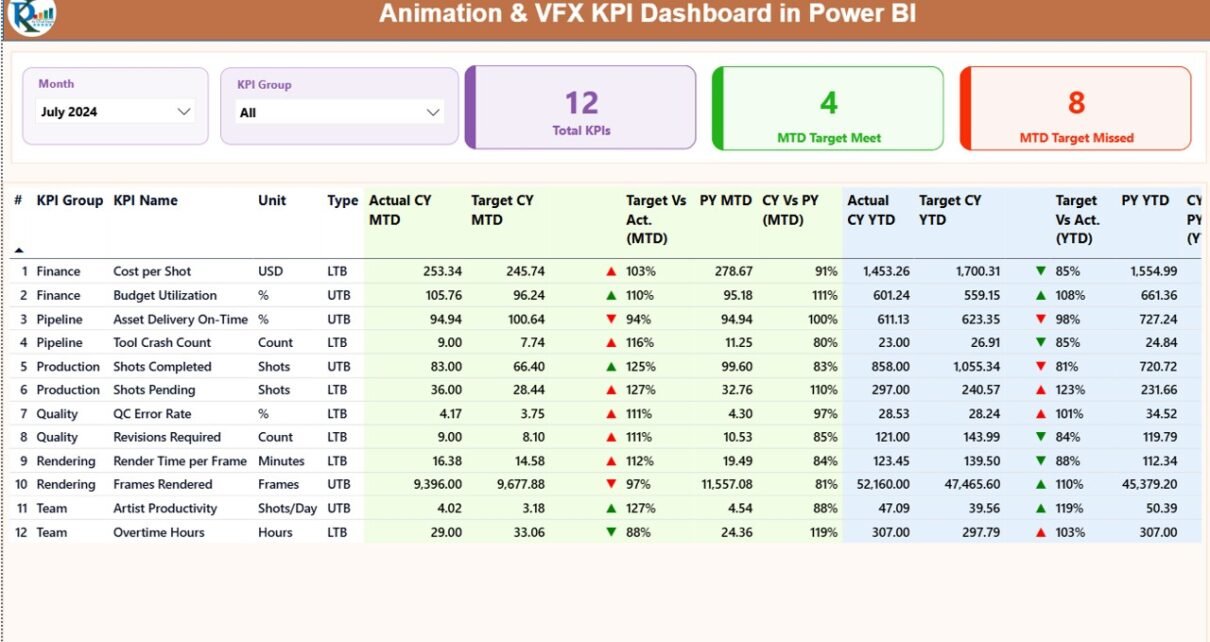
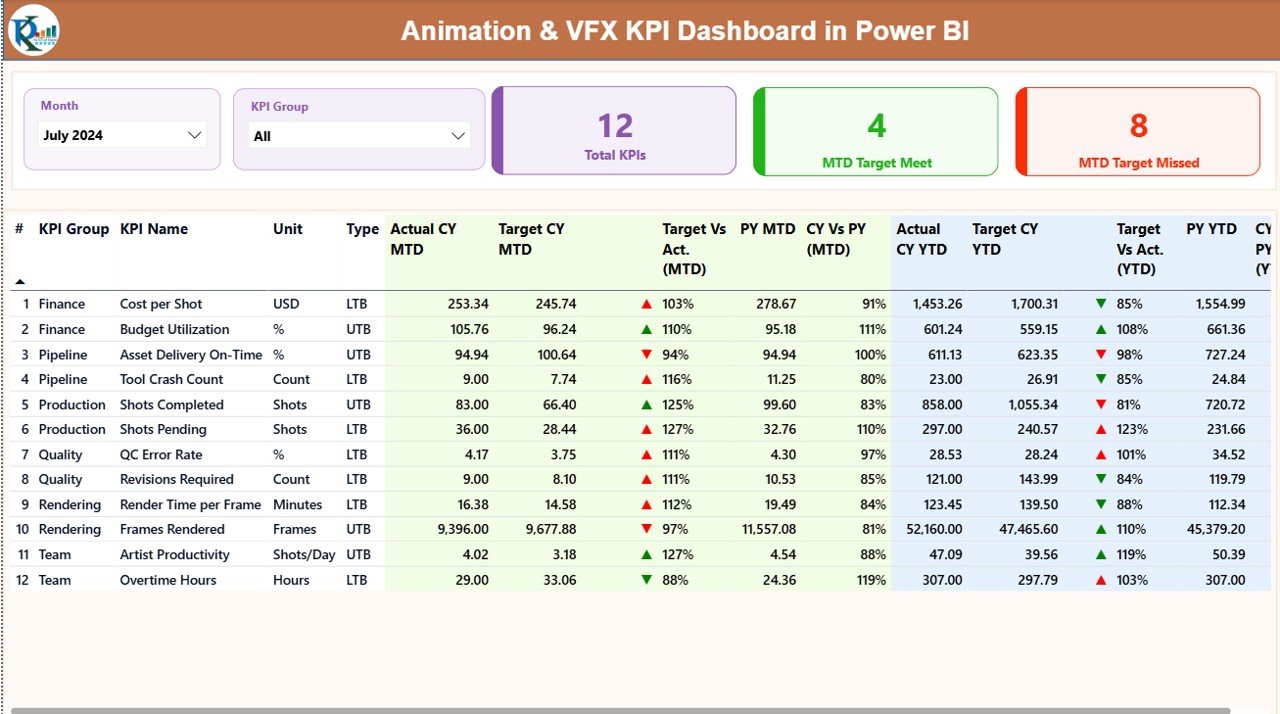
Summary Page
The Summary Page acts as the main landing page of the dashboard. It provides a high-level overview of all KPIs at a glance.
Key Elements of the Summary Page
- Month Slicer – Select the reporting month dynamically
- KPI Group Slicer – Filter KPIs by category
- KPI Cards:
Total KPIs Count
MTD Target Met Count
MTD Target Missed Count
Detailed KPI Table Fields
The summary page also displays a detailed KPI table with the following information:
- KPI Number – Sequential number of the KPI
- KPI Group – Category or functional group
- KPI Name – Name of the KPI
- Unit – Unit of measurement
- Type – LTB (Lower the Better) or UTB (Upper the Better)
- Actual CY MTD – Current year month-to-date actual value
- Target CY MTD – Current year MTD target value
- MTD Icon – Red ▼ or Green ▲ to show status
- Target vs Actual (MTD) – Actual ÷ Target (MTD)
- PY MTD – Previous year MTD value
- CY vs PY (MTD) – CY MTD ÷ PY MTD
- Actual CY YTD – Current year year-to-date actual
- Target CY YTD – Current year YTD target
- YTD Icon – Performance indicator for YTD
- Target vs Actual (YTD) – Actual ÷ Target (YTD)
- PY YTD – Previous year YTD value
- CY vs PY (YTD) – CY YTD ÷ PY YTD
Because of this structure, users can instantly identify strong and weak KPIs.
Click to buy Animation & VFX KPI Dashboard in Power BI
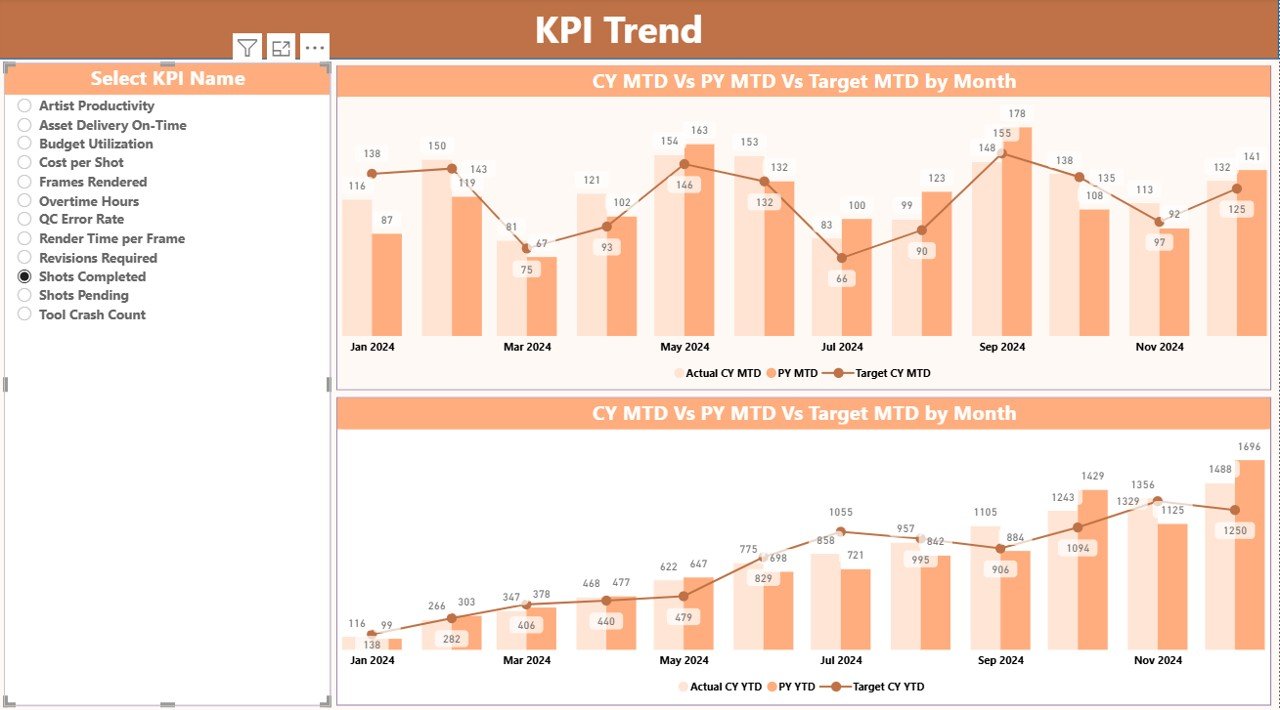
KPI Trend
The KPI Trend Page focuses on performance trends over time. Instead of static numbers, users see how KPIs evolve month by month.
Features of the KPI Trend Page
- Two combo charts:
MTD Actual vs Target vs Previous Year
YTD Actual vs Target vs Previous Year
KPI Name Slicer on the left
- Clear comparison of performance patterns
As a result, teams can identify improvement areas, recurring issues, and long-term growth trends.
Click to buy Animation & VFX KPI Dashboard in Power BI
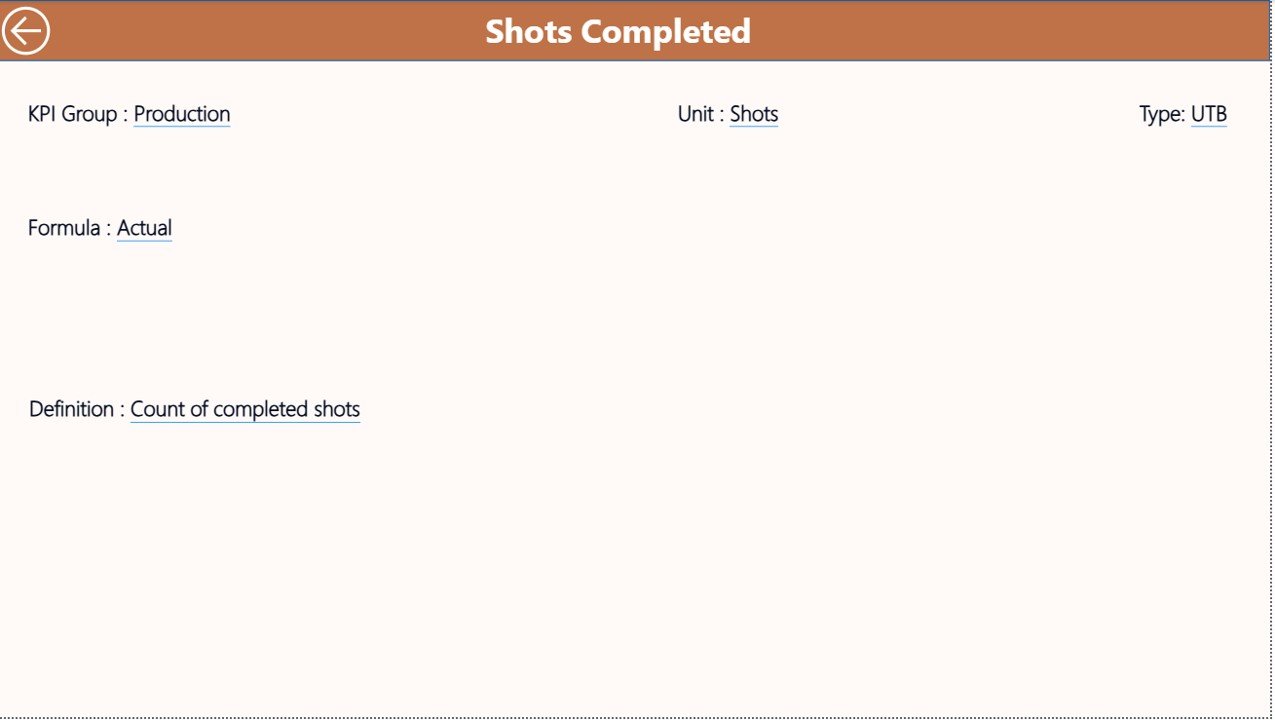
KPI Definition
The KPI Definition Page acts as a drill-through reference page. Although the page remains hidden, users can access it from the summary page.
What This Page Includes
- KPI Formula
- KPI Definition
- KPI Type (LTB or UTB)
This page ensures transparency and consistency. Moreover, it helps new team members understand KPIs quickly.
Click to buy Animation & VFX KPI Dashboard in Power BI
What Excel Data Is Required for This Dashboard?
The dashboard uses an Excel file as its data source. Users must update three worksheets only.
Input_Actual
In the Input_Actual sheet, users enter actual performance values.
Required Columns
- KPI Name
- Month (use first date of the month)
- MTD Value
- YTD Value
What Is the Input_Target Sheet?
The Input_Target sheet captures target values for the same KPIs.
Required Columns
- KPI Name
- Month (use first date of the month)
- MTD Target
- YTD Target
KPI Definition
The KPI Definition sheet defines each KPI clearly.
Required Columns
- KPI Number
- KPI Group
- KPI Name
- Unit
- Formula
- Definition
- Type (LTB or UTB)
Once users update these sheets, Power BI automatically reflects the changes.
Advantages of Animation & VFX KPI Dashboard in Power BI
An Animation & VFX KPI Dashboard in Power BI delivers significant operational and strategic benefits.
Key Advantages
- Centralized KPI monitoring
- Faster decision-making
- Clear target vs actual comparison
- Trend-based performance insights
- Transparent KPI definitions
- Excel-based data entry
- Scalable for growing studios
Because of these advantages, studios gain control, clarity, and confidence.
Opportunities for Improvement with This Dashboard
Although the dashboard is powerful, studios can enhance it further.
Possible Enhancements
- Add artist-level productivity KPIs
- Include cost and revenue metrics
- Integrate project-wise performance
- Automate data refresh schedules
- Connect to production management tools
These improvements can take performance monitoring to the next level.
Best Practices for the Animation & VFX KPI Dashboard in Power BI
To get the best results, studios should follow proven best practices.
Best Practices
- Define KPIs clearly before data entry
- Use consistent KPI names across sheets
- Update data monthly without delay
- Validate targets regularly
- Review trends instead of single values
- Train team members on KPI meaning
- Keep KPI groups simple and logical
By following these practices, organizations maximize dashboard value.
Who Can Benefit from This Dashboard?
This dashboard supports multiple roles within animation and VFX studios.
Ideal Users
- Studio Owners
- Production Managers
- Project Leads
- Finance Teams
- Operations Managers
- Quality Assurance Teams
Since the dashboard remains flexible, both small studios and large production houses can use it effectively.
How Does This Dashboard Improve Decision-Making?
The dashboard improves decision-making by providing:
- Real-time visibility
- Clear performance indicators
- Historical comparisons
- Data-driven insights
As a result, leadership shifts from guesswork to strategic planning.
Conclusion
An Animation & VFX KPI Dashboard in Power BI is not just a reporting tool. Instead, it acts as a strategic performance management solution for creative studios. By combining structured Excel data with powerful Power BI visuals, the dashboard delivers clarity, transparency, and actionable insights.
Moreover, with its summary view, trend analysis, and KPI definitions, teams gain full control over production performance. When studios adopt this dashboard and follow best practices, they improve efficiency, meet targets consistently, and drive sustainable growth.
Frequently Asked Questions (FAQs)
What is an Animation & VFX KPI Dashboard in Power BI?
It is a Power BI dashboard that tracks animation and VFX performance using KPIs sourced from Excel data.
Do I need technical skills to use this dashboard?
No. Users only need basic Excel and Power BI knowledge.
Can I customize KPIs?
Yes. You can add, remove, or modify KPIs in the Excel file.
How often should I update the data?
You should update the data monthly for accurate MTD and YTD analysis.
Does the dashboard support multiple KPI groups?
Yes. KPI Group slicers allow flexible categorization.
Can small studios use this dashboard?
Yes. The dashboard scales well for both small and large studios.
Is the KPI Definition page necessary?
Yes. It ensures clarity, consistency, and transparency.
Can I use this dashboard for other industries?
Yes. With KPI changes, you can adapt it to other domains easily.
Visit our YouTube channel to learn step-by-step video tutorials
Watch the step-by-step video tutorial:
Click to buy Animation & VFX KPI Dashboard in Power BI