In today’s fast-moving startup ecosystem, data decides success. Startups, investors, accelerators, and analysts constantly track funding, valuation, revenue, IPO readiness, and industry performance. However, raw startup data often remains scattered across multiple reports, tools, and spreadsheets. As a result, stakeholders struggle to get a single, clear view of the startup landscape.
That is exactly where the Aristech Startups Dashboard in Power BI becomes highly valuable.
This in-depth article explains what the Aristech Startups Dashboard in Power BI is, why it matters, how it works, what pages it includes, and how organizations can take full advantage of it. Moreover, you will learn about its advantages, best practices, improvement opportunities, and frequently asked questions.
Click to Purchases Aristech Startups Dashboard in Power BI
What Is an Aristech Startups Dashboard in Power BI?
An Aristech Startups Dashboard in Power BI is a ready-to-use analytical solution designed to monitor and analyze startup ecosystem performance using interactive visuals, KPIs, dashboards, and filters.
Instead of reviewing static reports, users can:
-
Track startup funding trends
-
Analyze valuation and revenue growth
-
Monitor IPO-ready startups
-
Compare performance by industry, region, stage, and funding source
-
Identify patterns, risks, and opportunities in minutes
Because Power BI offers real-time interactivity, this dashboard provides fast, accurate, and visually rich insights for strategic decision-making.
Why Do Organizations Need an Aristech Startups Dashboard in Power BI?
Startup ecosystems change quickly. New funding rounds appear every month. Industries rise and fall. Valuations shift with market sentiment. Therefore, relying on manual analysis slows decision-making and increases risk.
Organizations need an Aristech Startups Dashboard because it:
-
Centralizes all startup KPIs in one place
-
Reduces dependency on multiple reports
-
Improves data clarity and transparency
-
Supports faster, evidence-based decisions
-
Helps investors and founders spot trends early
As a result, teams remain informed, aligned, and proactive.
Who Can Use the Aristech Startups Dashboard in Power BI?
This dashboard suits a wide range of users, including:
-
Venture capital firms
-
Angel investors
-
Startup accelerators and incubators
-
Corporate innovation teams
-
Economic research organizations
-
Startup founders and CXOs
-
Business analysts and consultants
Because the dashboard uses simple slicers and visuals, both technical and non-technical users can use it comfortably.
How Does the Aristech Startups Dashboard in Power BI Work?
The dashboard works through a structured flow:
-
Data collection from startup databases or Excel files
-
Data modeling in Power BI
-
KPI calculations using DAX measures
-
Interactive dashboards with slicers and charts
-
User-driven analysis via filters and drill-downs
As users change slicers like region, industry, or stage, all visuals update instantly. Consequently, insights remain dynamic and contextual.
What Pages Are Included in the Aristech Startups Dashboard in Power BI?
The dashboard includes five well-designed analytical pages, each focusing on a specific business question.
1. What Insights Does the Overview Page Provide?
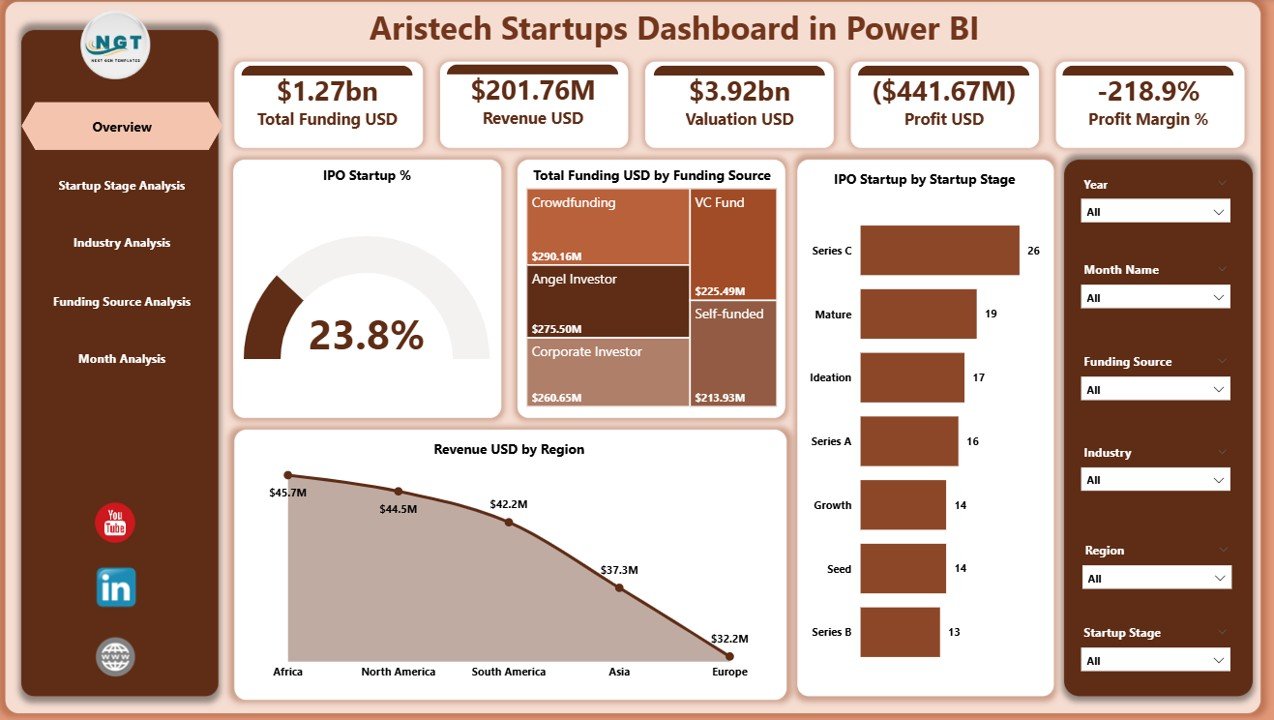
The Overview Page acts as the control center of the entire dashboard.
Key Elements of the Overview Page
-
Slicers: Allow users to filter data by time, region, or category
-
KPI Cards (4): Provide high-level snapshot metrics
-
Charts (4): Visualize overall startup performance trends
Key Cards Displayed
-
Total IPO Startup %
-
Total Funding USD
-
Valuation Trends (high-level)
-
Revenue Overview
Charts on the Overview Page
-
IPO Start-up % – Shows IPO readiness trends
-
Total Funding USD by Funding Source – Highlights capital inflow sources
-
IPO Startup by Startup Stage – Identifies which stages move toward IPO
-
Revenue USD by Region – Compares regional performance
Because this page summarizes everything, decision-makers gain instant clarity.
Click to Purchases Aristech Startups Dashboard in Power BI
2. How Does the Startup Stage Analysis Page Help?
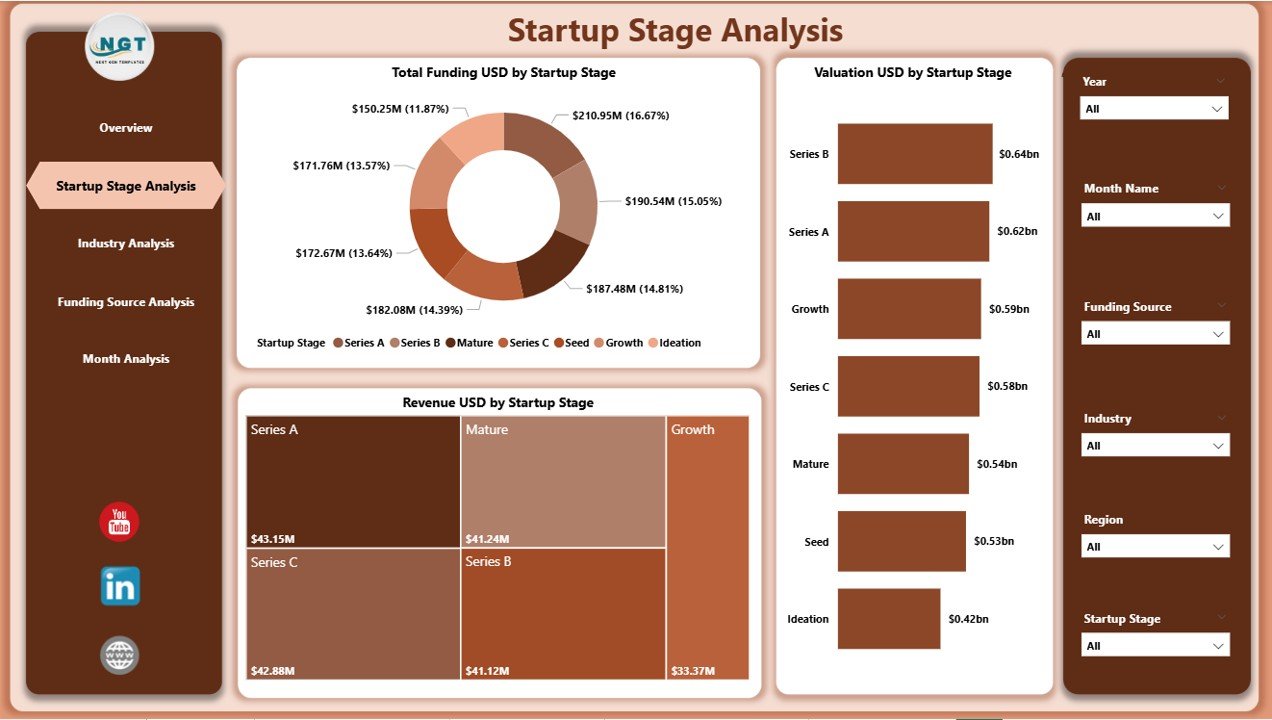
The Startup Stage Analysis Page focuses on understanding performance across various startup maturity stages.
Why Is Startup Stage Analysis Important?
Startups behave differently at each stage. Early-stage startups focus on funding and growth, while later-stage startups focus on revenue and IPO readiness. This page explains those differences clearly.
Charts Included
-
Total Funding USD by Startup Stage
-
Valuation USD by Startup Stage
-
Revenue USD by Startup Stage
Key Insights from This Page
-
Which stage attracts the highest funding
-
How valuations grow with maturity
-
Which stages generate the most revenue
As a result, investors allocate resources smarter.
3. What Can You Learn from the Industry Analysis Page?
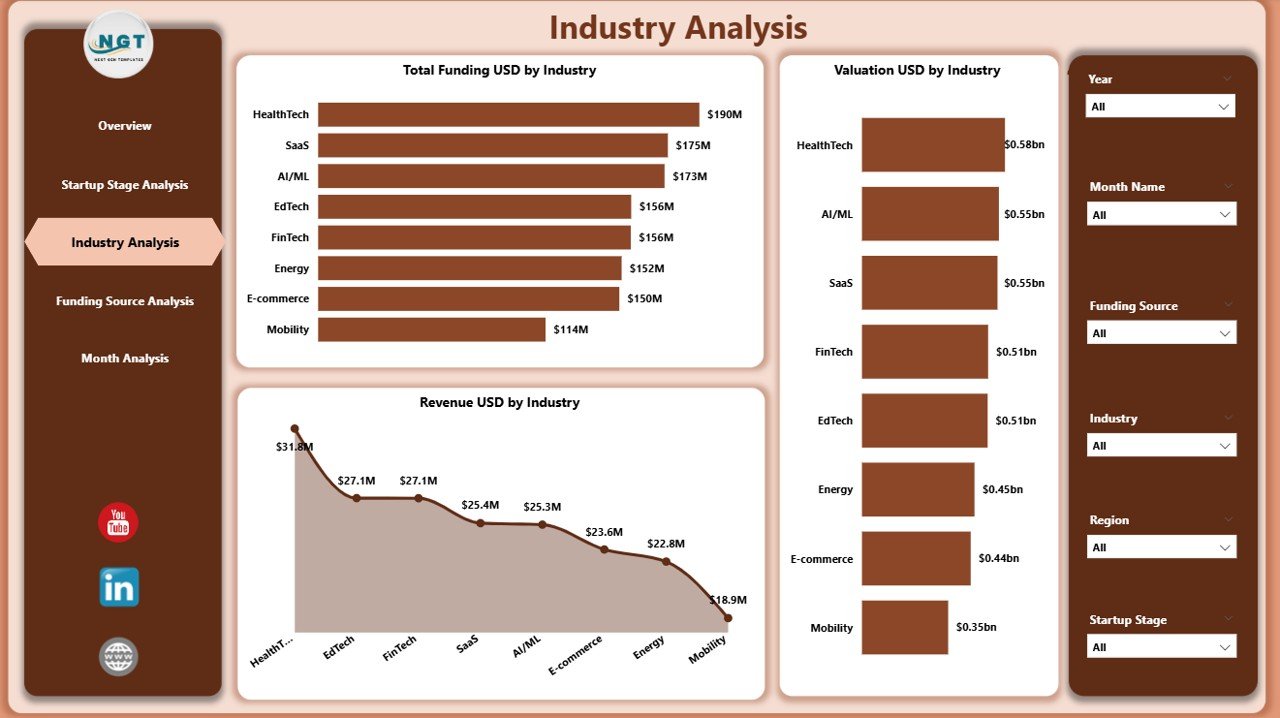
The Industry Analysis Page compares startup performance across different industries.
Why Does Industry Analysis Matter?
Market conditions vary widely across industries. Some industries grow faster, while others offer stable returns. This page highlights those differences clearly.
Charts Included
-
Total Funding USD by Industry
-
Valuation USD by Industry
-
Revenue USD by Industry
Benefits of Industry Analysis
-
Identify high-growth industries
-
Compare risk vs reward sectors
-
Spot emerging technology trends
-
Align investment strategy with market demand
Therefore, strategic planning becomes more accurate.
4. How Does the Funding Source Analysis Page Support Better Decisions?
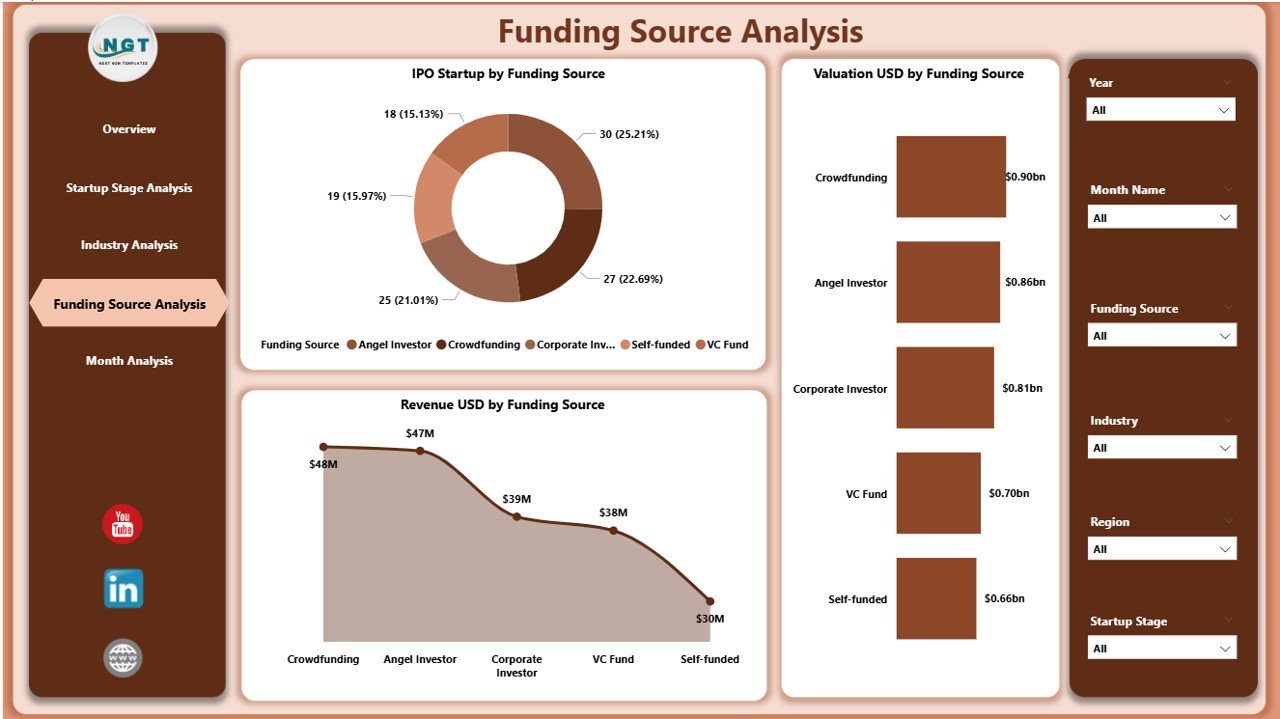
The Funding Source Analysis Page evaluates how different funding channels impact startup success.
Why Focus on Funding Sources?
Different funding sources influence startup trajectories differently. Venture capital, angel investors, and public funding produce varying outcomes.
Charts Included
-
IPO Startup by Funding Source
-
Valuation USD by Funding Source
-
Revenue USD by Funding Source
Insights from This Page
-
Which funding sources lead to higher IPO rates
-
How valuation changes by funding type
-
Which sources support revenue growth best
Hence, founders choose funding wisely.
5. Why Is the Monthly Trends Page Critical?
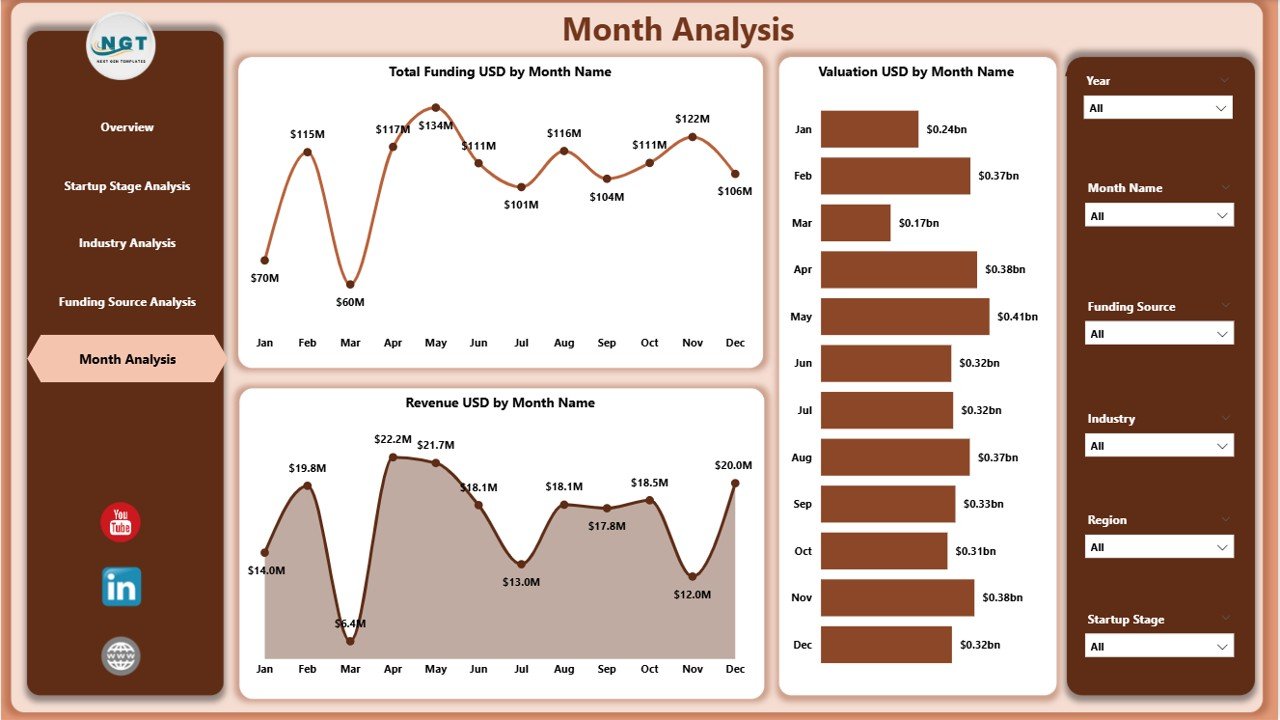
The Monthly Trends Page analyzes performance over time.
Importance of Monthly Trend Analysis
Time-based analysis reveals patterns, seasonality, and anomalies. Without trend analysis, organizations miss early signals.
Charts Included
-
Total Funding USD by Month
-
Valuation USD by Month
-
Revenue USD by Month
Key Outcomes
-
Track growth momentum
-
Identify funding cycles
-
Forecast future performance trends
Therefore, organizations stay ahead of the curve.
Click to Purchases Aristech Startups Dashboard in Power BI
Advantages of Aristech Startups Dashboard in Power BI
Using this dashboard delivers several powerful advantages.
✅ Centralized Startup Intelligence
All startup KPIs and visuals remain in one platform.
✅ Faster Decision-Making
Interactive visuals reduce analysis time.
✅ Clear Performance Visibility
Charts simplify complex datasets.
✅ Investor-Ready Reporting
Stakeholders get presentation-ready insights.
✅ Scalable and Flexible
Teams can expand KPIs and data sources easily.
Opportunities for Improvement in the Aristech Startups Dashboard
Even the best dashboards evolve. Some improvement areas include:
-
Adding predictive analytics for funding forecasts
-
Integrating live APIs from startup databases
-
Adding geographic map visuals
-
Including cohort-based analysis
-
Enabling drill-through pages for startup-level details
By enhancing these areas, organizations can unlock deeper value.
Best Practices for the Aristech Startups Dashboard in Power BI
Following best practices ensures maximum dashboard impact.
✅ Keep KPIs Simple and Relevant
Avoid clutter. Focus on business-critical metrics.
✅ Maintain Clean Data Models
Use consistent naming and data types.
✅ Optimize Performance
Limit unnecessary visuals and calculations.
✅ Use Clear Visual Hierarchy
Highlight important KPIs prominently.
✅ Update Data Regularly
Fresh data ensures accurate insights.
How Does This Dashboard Help Investors?
Investors benefit significantly from this dashboard because they can:
-
Monitor portfolio startup performance
-
Compare industries before investing
-
Identify IPO-ready startups early
-
Track funding efficiency
-
Reduce investment risk
As a result, portfolio decisions improve.
How Can Startup Founders Use This Dashboard?
Founders use this dashboard to:
-
Benchmark performance against peers
-
Understand valuation expectations
-
Track funding efficiency
-
Identify revenue growth gaps
-
Prepare for investor presentations
Thus, founders gain strategic clarity.
Challenges Solved by the Aristech Startups Dashboard
This dashboard effectively handles common challenges such as:
-
Fragmented startup data
-
Manual reporting delays
-
Lack of trend visibility
-
Difficulty comparing industries or stages
-
Poor stakeholder communication
Because of automation and visuals, these challenges disappear.
Future Scope of Aristech Startups Dashboards
In the future, this dashboard can support:
-
AI-driven funding predictions
-
Real-time investor alerts
-
Startup risk scoring models
-
ESG and sustainability metrics
-
Cross-country startup benchmarking
Consequently, it can evolve into a full-scale startup intelligence platform.
Conclusion: Why the Aristech Startups Dashboard in Power BI Matters
The Aristech Startups Dashboard in Power BI transforms raw startup data into actionable insights. It empowers investors, founders, and analysts to understand funding patterns, valuation trends, industry performance, and revenue growth clearly.
Because it offers interactivity, scalability, and clarity, this dashboard becomes an essential tool for modern startup analytics. Organizations that adopt it gain faster decisions, deeper insights, and stronger strategic alignment.
In a world driven by data, this dashboard delivers the competitive edge.
Frequently Asked Questions (FAQs)
What is the main purpose of the Aristech Startups Dashboard in Power BI?
The dashboard helps analyze startup funding, valuation, revenue, IPO readiness, and performance trends in one interactive view.
Can non-technical users use this dashboard?
Yes. Slicers, charts, and visuals remain user-friendly and intuitive.
Does the dashboard support multiple industries?
Yes. The Industry Analysis page compares performance across industries easily.
Can this dashboard handle large datasets?
Power BI handles large datasets efficiently with proper modeling.
Is historical trend analysis available?
Yes. The Monthly Trends page tracks funding, valuation, and revenue over time.
Can organizations customize the dashboard?
Absolutely. Users can add KPIs, visuals, or filters as needed.
Is this dashboard suitable for investors?
Yes. It supports investor decision-making, portfolio tracking, and risk analysis.
Does the dashboard support real-time data?
With live connections, Power BI can show near real-time insights.
Visit our YouTube channel to learn step-by-step video tutorials