In today’s competitive manufacturing world, automotive parts companies handle huge amounts of data every day. They track production quantity, revenue, material usage, costs, defects, delayed orders, safety incidents, and monthly trends. However, when teams manage this information across scattered spreadsheets, manual reports, and disconnected files, they often lose clarity. As a result, decision-making becomes slow, reporting turns confusing, and important issues stay hidden.
So, how can automotive parts manufacturers organize performance data in one place and make faster decisions?
Click to buy Automotive Parts Manufacturing Dashboard in Excel
The answer is the Automotive Parts Manufacturing Dashboard in Excel.
This ready-to-use dashboard helps manufacturers monitor production, quality, operations, and financial performance through a single Excel-based reporting system. Moreover, it turns raw manufacturing data into meaningful charts, key metrics, and trend analysis. Therefore, business owners, plant managers, production heads, and analysts can quickly understand what is happening across the manufacturing process.
In this detailed article, you will learn what this dashboard is, why it matters, what pages it includes, how it helps your business, and how to use it effectively.
What Is an Automotive Parts Manufacturing Dashboard in Excel?
An Automotive Parts Manufacturing Dashboard in Excel is a smart and interactive reporting tool that helps manufacturers track key production and business metrics in one place.
Instead of checking multiple reports for production quantity, cost, defects, and revenue, you can review everything in a single dashboard. Because of this, you save time and improve decision-making.
This dashboard gives you a clear view of:
- Production quantity
- Revenue
- Total cost
- Defect count
- Delayed orders
- Safety incidents
- Lead time
- Monthly business trends
- Performance by region
- Performance by plant location
- Performance by part category
- Performance by material type
As a result, your team can spot issues faster, compare performance easily, and take action without delay.
Why Do Automotive Parts Manufacturers Need a Dashboard in Excel?
Automotive parts manufacturing includes many moving parts. Production teams focus on output. Quality teams monitor defects. Finance teams review cost and revenue. Supply chain teams watch delayed orders and lead time. Meanwhile, management wants one clear picture of overall performance.
Without a structured dashboard, this process becomes difficult.
Here is why manufacturers need a dashboard in Excel:
- It Brings All Important Data Together
Many companies store information in different sheets and files. Consequently, teams struggle to combine data for reporting. A dashboard solves this problem by collecting key metrics into one visual system.
- It Improves Decision-Making
When decision-makers can see trends, problems, and performance indicators quickly, they act faster. Therefore, the company avoids delays and improves operational control.
- It Makes Performance Tracking Easier
The dashboard allows you to monitor production, quality, and financial performance side by side. Because of that, you can identify which areas need improvement.
- It Supports Better Planning
When you can see monthly patterns, plant-wise performance, and cost distribution, planning becomes easier. In addition, forecasting and budgeting improve.
- It Uses Excel, Which Most Teams Already Know
Excel remains one of the most practical tools for reporting and analysis. So, teams can start using the dashboard without learning complex software.
What Does the Automotive Parts Manufacturing Dashboard in Excel Include?
This dashboard includes multiple sheet tabs, and each tab focuses on a specific area of manufacturing performance. That structure makes the dashboard practical, organized, and easy to use.
The main sections include:
- Overview Sheet Tab
- Production Analysis
- Quality Control
- Financial Performance
- Monthly Trends
Let us understand each section in detail.
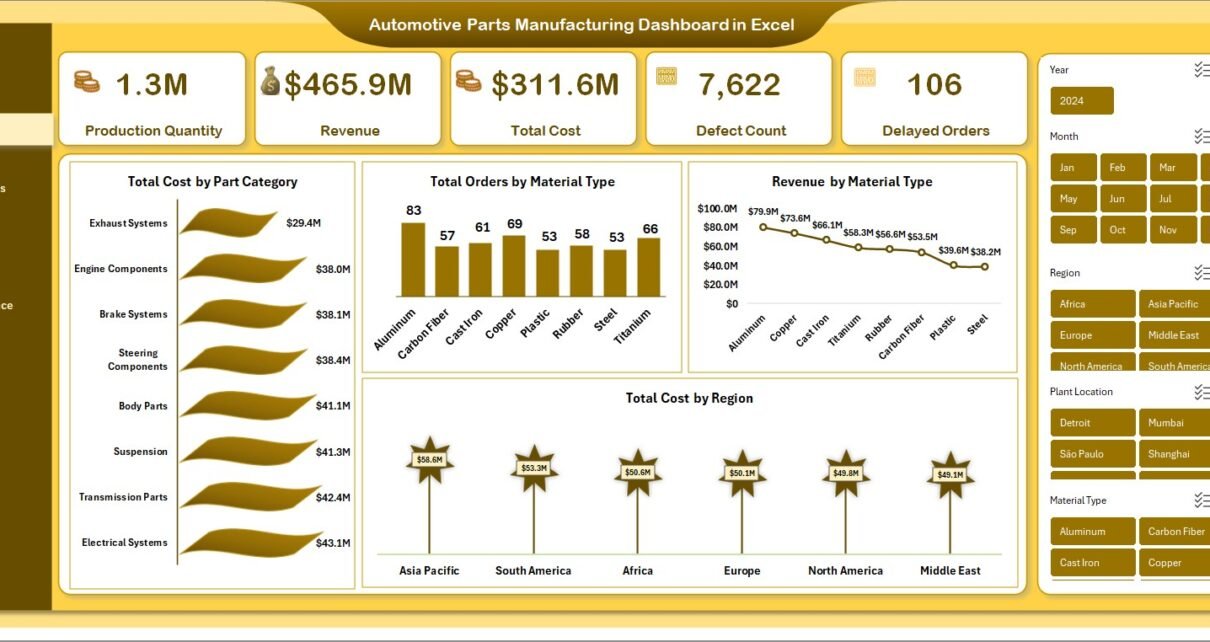
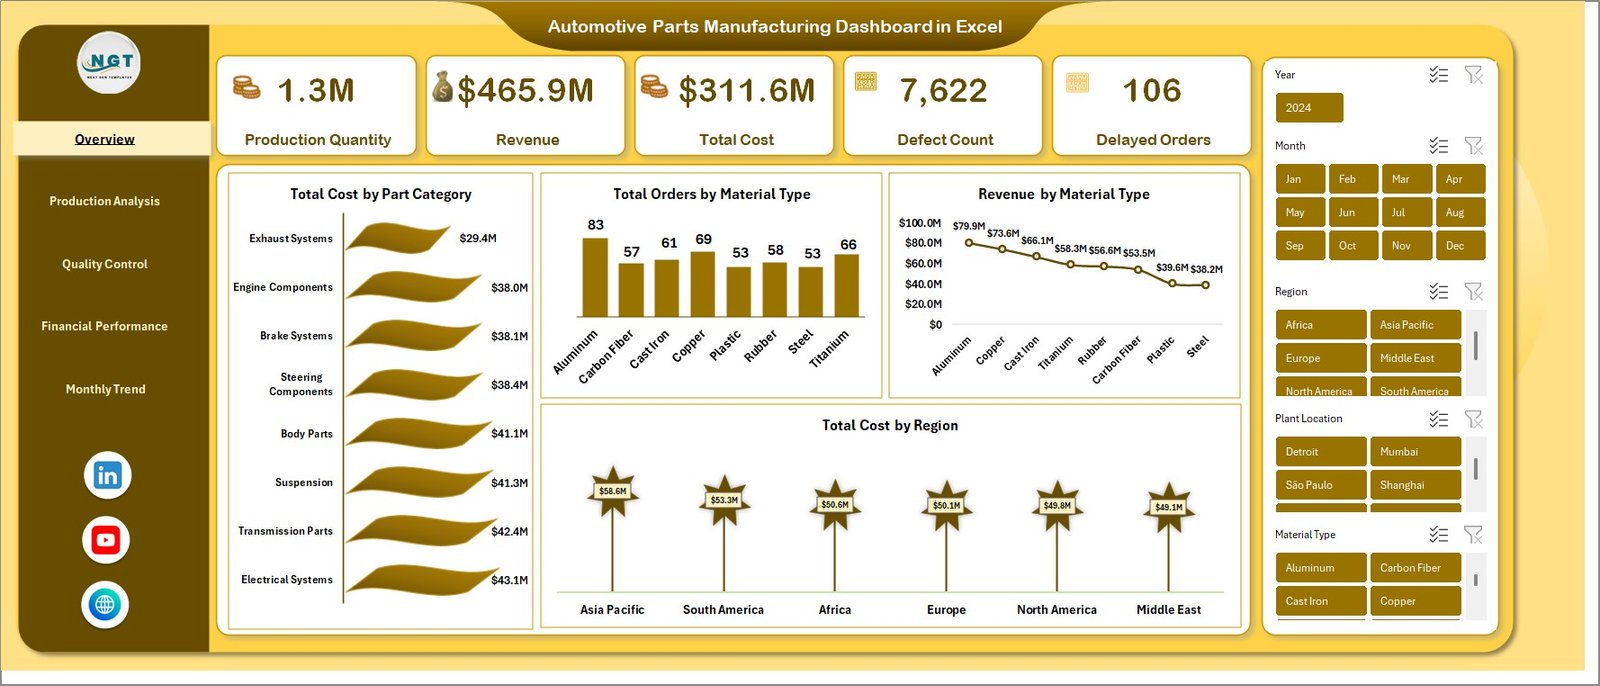
What Can You See in the Overview Sheet Tab?
The Overview Sheet Tab acts as the main summary page of the dashboard. It gives decision-makers a quick snapshot of the most important performance indicators.
This page includes:
- Production Quantity
- Revenue
- Total Cost
- Defect Count
- Delayed Orders
- Total Cost by Part Category
- Total Orders by Material Type
- Revenue by Material Type
- Total Cost by Region
This page matters because it provides a high-level understanding of operations without forcing the user to move across different sheets.
Key Benefits of the Overview Page
Quick business snapshot
You can instantly review output, cost, revenue, and operational issues.
Better executive reporting
Managers and business owners can understand overall performance in a few seconds.
Faster issue identification
If defect count rises or delayed orders increase, the problem becomes visible immediately.
Easier comparison
You can compare regions, material types, and categories without manual filtering.
Click to buy Automotive Parts Manufacturing Dashboard in Excel
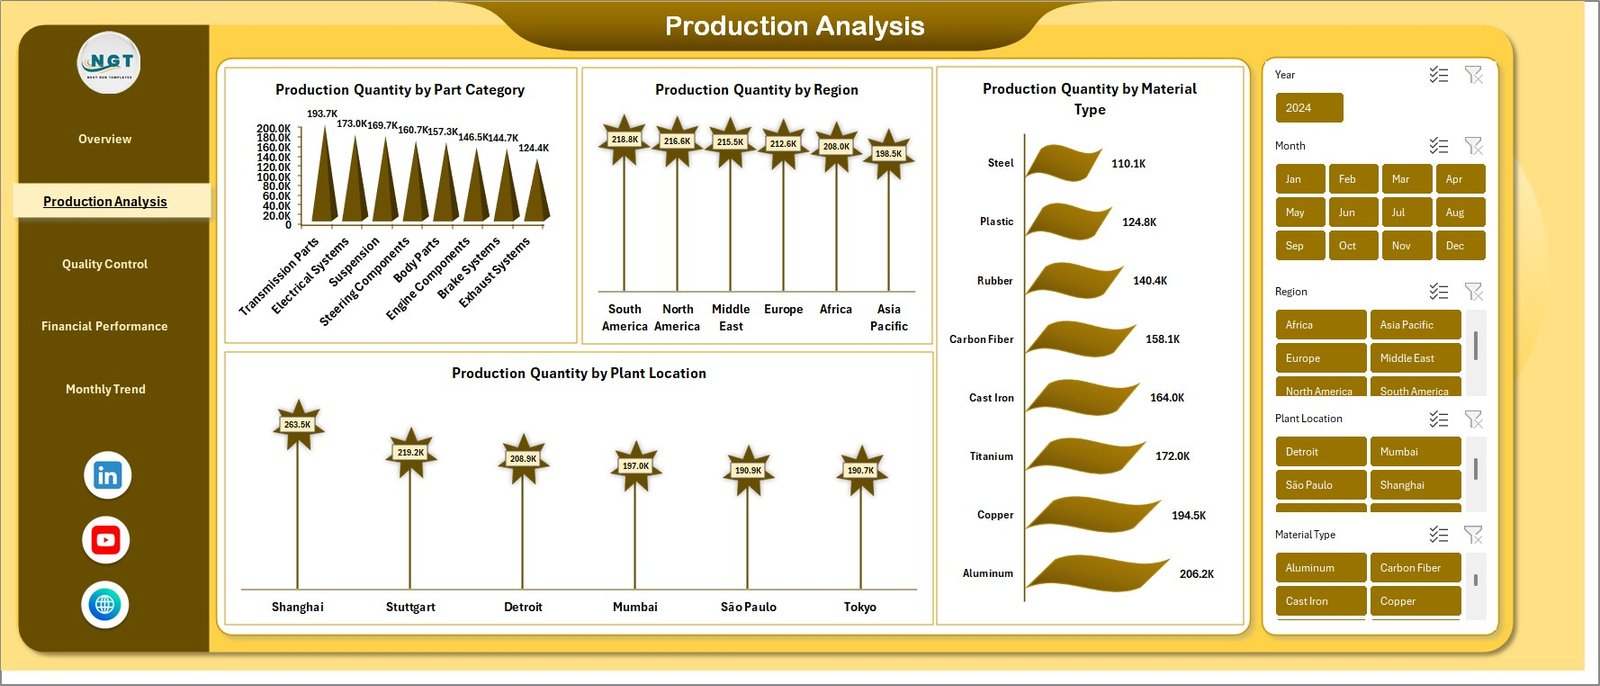
How Does the Production Analysis Sheet Help?
The Production Analysis sheet focuses on output performance. Since production stands at the center of automotive parts manufacturing, this tab helps teams understand where production performs well and where improvement is needed.
This page includes:
- Production Quantity by Part Category
- Production Quantity by Region
- Production Quantity by Material Type
- Production Quantity by Plant Location
With this analysis, managers can compare production levels across different dimensions and identify performance gaps.
Click to buy Automotive Parts Manufacturing Dashboard in Excel
Why Is Production Analysis Important?
Production data does more than show output numbers. It also reveals operational strength, plant efficiency, and material utilization trends.
For example:
- If one plant location produces much less than others, you can investigate staffing, machine issues, or material shortages.
- If one material type shows stronger output, you can study why it performs better.
- If one part category dominates production, you can review demand planning and product mix.
Therefore, production analysis helps improve both efficiency and planning.
Click to buy Automotive Parts Manufacturing Dashboard in Excel
What Insights Does the Quality Control Sheet Provide?
The Quality Control sheet helps companies monitor product and process quality. In automotive parts manufacturing, quality plays a major role because even small defects can create serious supply chain and customer issues.
This page includes:
- Defect Count by Part Category
- Delayed Orders by Material Type
- Safety Incidents by Material Type
- Total Orders by Region
This sheet is highly valuable because it connects manufacturing performance with quality and operational reliability.
Why Does Quality Control Matter So Much?
Automotive manufacturing depends on precision. If parts fail quality checks, customer trust drops, production costs rise, and delays increase. Therefore, quality tracking should stay at the center of reporting.
What Can You Learn from This Sheet?
Defect patterns by part category
You can identify which categories produce the highest defect count.
Delay issues by material type
You can see whether certain materials create order delays more often.
Safety risk areas
You can review which material types relate to more safety incidents.
Regional order distribution
You can compare total orders by region and connect demand with quality and delivery performance.
Because of this, quality teams and plant managers can take targeted action instead of relying on assumptions.

Click to buy Automotive Parts Manufacturing Dashboard in Excel
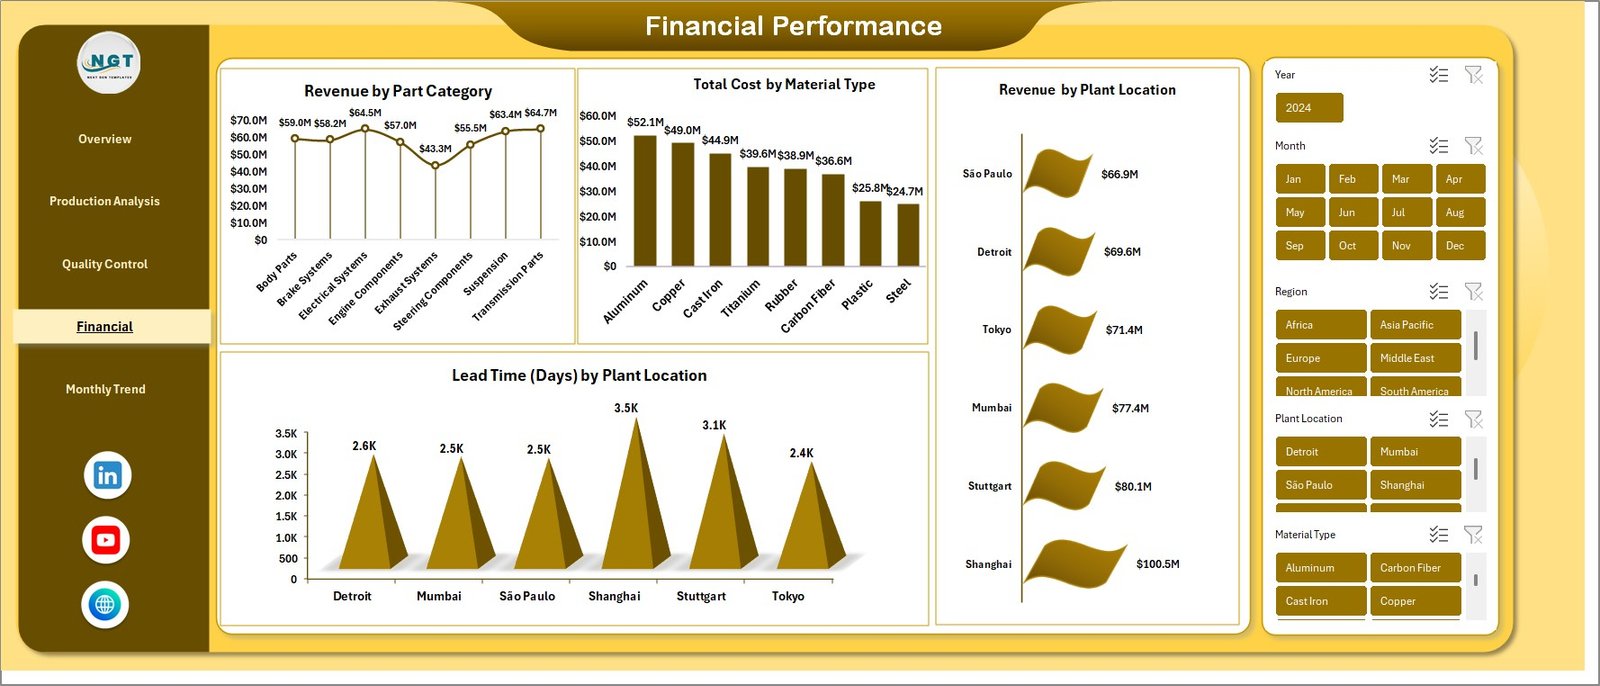
How Does the Financial Performance Sheet Improve Business Control?
The Financial Performance sheet helps manufacturers understand the money side of operations. While production quantity matters, profitability matters just as much. Therefore, this tab gives a strong financial view of manufacturing activity.
This page includes:
- Revenue by Part Category
- Total Cost by Material Type
- Revenue by Plant Location
- Lead Time (Days) by Plant Location
This page allows companies to study how revenue and cost behave across different business segments.
Click to buy Automotive Parts Manufacturing Dashboard in Excel
Why Is Financial Analysis Important in Manufacturing?
Manufacturing businesses cannot depend only on volume. They must also control cost, increase revenue, and reduce delays. Otherwise, high production may still lead to weak profitability.
This financial page helps answer questions like:
- Which part category brings the highest revenue?
- Which material type creates the highest cost?
- Which plant location performs best in revenue generation?
- Which plant shows longer lead time and may need process improvement?
As a result, finance teams and management can make smarter pricing, budgeting, and investment decisions.
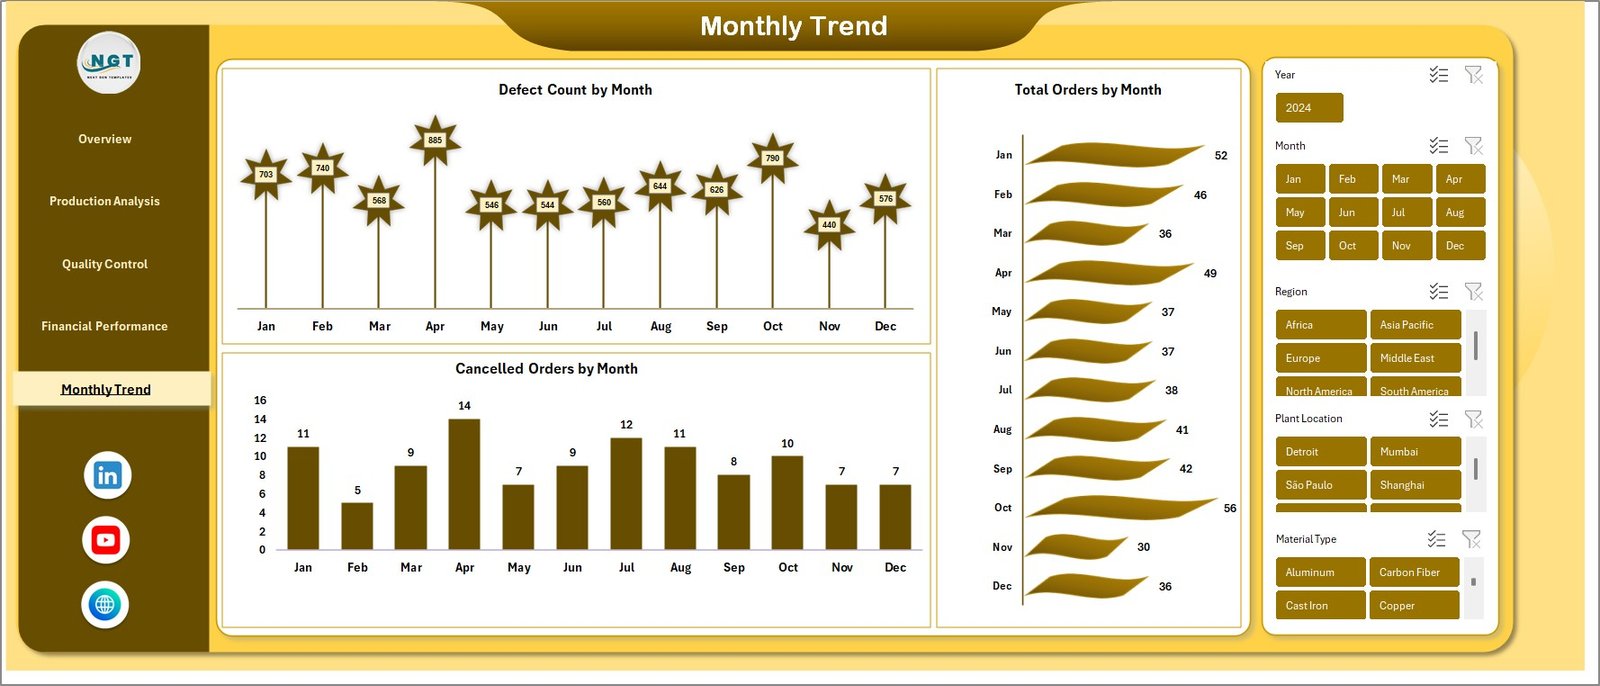
Why Are Monthly Trends Important in This Dashboard?
The Monthly Trends sheet helps users track performance over time. This is important because one-time numbers do not always show the full story. However, monthly patterns reveal whether performance is improving, declining, or staying unstable.
This page includes:
- Defect Count by Month
- Total Orders by Month
- Cancelled Orders by Month
Monthly analysis helps business leaders understand seasonality, risk, and operational patterns.
Click to buy Automotive Parts Manufacturing Dashboard in Excel
What Can Monthly Trend Analysis Show?
Defect movement over time
You can check whether product quality is improving or getting worse.
Order volume changes
You can understand demand trends across the year.
Cancellation patterns
You can review whether customer cancellations rise during specific months.
This trend-based view helps planning teams, production managers, and top leadership make better long-term decisions.
How Does This Dashboard Help Different Teams?
One of the biggest strengths of this dashboard is that it supports multiple departments at the same time. Instead of creating separate reports for every team, the dashboard gives a connected view of operations.
For Production Teams
They can monitor production quantity by category, material type, region, and location.
For Quality Teams
They can track defects, delayed orders, and safety incidents.
For Finance Teams
They can review revenue, cost, and lead time impact.
For Management
They can use the overview page to check complete business performance quickly.
For Operations Teams
They can identify bottlenecks across plant locations and material types.
Because of this, the dashboard improves collaboration and reduces reporting confusion.
What Are the Advantages of Automotive Parts Manufacturing Dashboard in Excel?
A well-designed dashboard offers many benefits. Below are the main advantages of using the Automotive Parts Manufacturing Dashboard in Excel.
- Centralized Reporting
You can manage all key manufacturing data from one place. Therefore, reporting becomes faster and more organized.
- Better Visibility
The dashboard shows important metrics clearly through charts and summaries. As a result, users understand performance without reading long reports.
- Faster Decision-Making
When data appears in a visual format, managers notice problems quickly. Consequently, they can take action before issues grow.
- Stronger Production Monitoring
You can track output by part category, plant location, material type, and region. So, production analysis becomes more detailed and useful.
- Improved Quality Control
The dashboard highlights defect count, safety incidents, and delayed orders. Therefore, quality teams can focus on the right areas.
- Better Financial Insight
Revenue, cost, and lead time analysis helps management control expenses and improve profitability.
- Easier Trend Analysis
Monthly trend charts show how performance changes over time. Because of that, forecasting and planning become easier.
- Practical Excel-Based Design
Most businesses already use Excel. So, implementation becomes simpler, more affordable, and more familiar for the team.
- Better Communication Across Teams
When everyone uses the same dashboard, discussions become clearer and more productive.
- Supports Continuous Improvement
The dashboard helps businesses spot weak areas and measure improvement over time.
How Can You Use This Dashboard Effectively?
A dashboard becomes powerful only when users apply it correctly. So, you should follow a smart process while using it.
Step 1: Update Data Regularly
Make sure you enter or refresh production, cost, quality, and order data on time. If data stays outdated, the dashboard loses value.
Step 2: Review the Overview First
Start with the overview page to understand the overall situation. Then move to detailed sheets for deeper analysis.
Step 3: Compare Different Segments
Do not look at only total numbers. Instead, compare part categories, material types, regions, and plant locations.
Step 4: Watch Monthly Trends
Check trend charts regularly. This helps you identify rising defects, falling orders, or increasing cancellations.
Step 5: Use Insights for Action
The dashboard should not remain a reporting tool only. You should use it to improve production planning, reduce defects, control cost, and strengthen quality standards.
Best Practices for the Automotive Parts Manufacturing Dashboard in Excel
To get the best results, you should follow proven dashboard practices.
Keep Data Clean and Consistent
Always use proper naming for part categories, material types, and plant locations. If the data contains spelling differences or inconsistent labels, the dashboard may show inaccurate analysis.
Update the Dashboard on a Fixed Schedule
Use daily, weekly, or monthly updates based on your reporting needs. Consistent updates keep the dashboard reliable.
Focus on Actionable Metrics
Track metrics that help decision-making, such as production quantity, defects, delayed orders, revenue, and cost. Avoid adding unnecessary indicators.
Review Outliers Immediately
If one region shows very high cost or one part category shows unusual defects, investigate at once. Quick review prevents larger problems.
Use Trend Analysis for Planning
Do not rely on one month alone. Instead, use trend analysis to understand long-term patterns.
Involve Multiple Teams
Production, finance, quality, and operations teams should all review dashboard insights. This creates better alignment and stronger results.
Simplify the Presentation
Keep charts readable and clear. A dashboard should support quick understanding, not create confusion.
Validate Source Data
Before sharing reports with management, confirm that the source data is accurate. Reliable input leads to reliable output.
Who Can Benefit from This Dashboard?
This dashboard supports many users across the automotive manufacturing business.
Plant Managers
They can monitor plant performance, lead time, and output levels.
Production Supervisors
They can track production quantity by category, material, and location.
Quality Managers
They can review defects, delays, and safety incidents.
Finance Analysts
They can evaluate revenue and cost trends.
Operations Heads
They can study regional and plant-level performance.
Business Owners and Directors
They can use the overview page for high-level decision-making.
So, this dashboard does not serve only one team. Instead, it supports the whole business.
Why Is Excel a Good Choice for an Automotive Manufacturing Dashboard?
Many businesses ask whether Excel still works well for manufacturing dashboards. The answer is yes.
Excel remains a strong choice because:
- It is widely used in businesses
- It is easy to understand
- It supports charts, formulas, pivots, and automation
- It allows flexible customization
- It works well for small and medium reporting needs
- It offers affordable reporting without costly software
In addition, Excel dashboards are practical for businesses that want a quick and effective solution without a heavy technical setup.
How Can This Dashboard Support Business Growth?
A dashboard does more than display numbers. It helps a company grow with confidence.
Here is how:
- It improves visibility into operations
- It helps reduce production problems
- It supports stronger quality control
- It highlights cost-heavy areas
- It shows which categories generate better revenue
- It supports better plant-level planning
- It helps reduce delays and cancellations
- It guides smarter financial decisions
As a result, the business can improve efficiency, profitability, and customer satisfaction.
Conclusion
The Automotive Parts Manufacturing Dashboard in Excel is a powerful and practical tool for modern manufacturers. It combines production tracking, quality monitoring, cost analysis, revenue insights, and monthly trends into one organized reporting system.
Instead of depending on scattered reports and manual summaries, manufacturers can use this dashboard to understand business performance quickly and clearly. Moreover, it helps different teams work with the same data, which improves communication and decision-making.
If your company wants to track production quantity, control defect count, monitor delayed orders, analyze revenue, and study financial performance in one place, this dashboard offers a smart solution. Because it runs in Excel, it stays easy to use, flexible, and highly practical for daily business reporting.
In short, this dashboard helps automotive parts manufacturers work smarter, act faster, and grow stronger.
Frequently Asked Questions About Automotive Parts Manufacturing Dashboard in Excel
- What is an Automotive Parts Manufacturing Dashboard in Excel?
It is an Excel-based reporting dashboard that helps track production, revenue, cost, defects, delayed orders, safety incidents, and monthly trends in one place.
- Why should manufacturers use this dashboard?
Manufacturers should use this dashboard because it simplifies reporting, improves visibility, supports faster decision-making, and helps monitor production and quality more effectively.
- What metrics does this dashboard track?
This dashboard tracks production quantity, revenue, total cost, defect count, delayed orders, safety incidents, lead time, cancelled orders, and total orders.
- What sheets are included in this dashboard?
The dashboard includes Overview, Production Analysis, Quality Control, Financial Performance, and Monthly Trends sheet tabs.
- How does the overview sheet help users?
The overview sheet provides a quick business summary with high-level KPIs and charts. Therefore, users can understand the overall situation without checking each sheet one by one.
- Can this dashboard help with quality improvement?
Yes, it can. It shows defect count, delayed orders, and safety incidents, which helps quality teams identify issues and improve performance.
- How does the financial performance sheet help?
It helps users analyze revenue by part category and plant location, total cost by material type, and lead time by plant location. As a result, financial control becomes stronger.
- Why is monthly trend analysis useful?
Monthly trends help businesses track changes over time. Therefore, they can identify recurring issues, seasonal patterns, and performance movement more easily.
- Is Excel a good tool for manufacturing dashboards?
Yes, Excel is a very good tool for manufacturing dashboards, especially for businesses that want a flexible, affordable, and easy-to-use reporting solution.
- Who should use this dashboard?
Plant managers, production teams, quality managers, finance analysts, operations heads, and business owners can all benefit from this dashboard.
Click to buy Automotive Parts Manufacturing Dashboard in Excel
Visit our YouTube channel to learn step-by-step video tutorials