Managing a backpacker hostel can be challenging, especially when you deal with bookings, guest preferences, revenue tracking, and operational performance. However, when you use scattered data sources, it becomes difficult to gain clear insights.
So, how can you simplify hostel management and make smarter decisions?
The answer is simple — Backpacker Hostels Dashboard in Power BI.
This powerful and interactive dashboard helps you track all key hostel metrics in one place. Moreover, it transforms complex data into easy-to-understand visuals, which allows you to take quick and effective actions.
In this complete guide, you will learn everything about this dashboard, including its features, pages, benefits, and best practices.
Backpacker Hostels Dashboard in Power BI
What is a Backpacker Hostels Dashboard in Power BI?
A Backpacker Hostels Dashboard in Power BI is a dynamic business intelligence tool that helps hostel owners and managers analyze bookings, revenue, occupancy, and guest satisfaction.
Instead of using manual reports, you can visualize your data through interactive charts and KPIs. As a result, you gain better control over your hostel operations.
Why Should You Use a Power BI Dashboard for Hostel Management?
If you still rely on spreadsheets alone, you may miss important insights. Therefore, using Power BI becomes a game-changer.
Here’s why this dashboard is essential:
- You can monitor real-time performance
- You can analyze booking trends and revenue patterns
- You can improve guest experience using data insights
- You can identify top-performing regions and channels
- You can make data-driven decisions faster
In addition, Power BI allows you to apply filters and slicers, which makes analysis more flexible and powerful.
📊 Overview Page – What Insights Do You Get Instantly?
The Overview Page provides a high-level snapshot of your hostel performance. At the top, you will find important KPI cards that summarize your data.
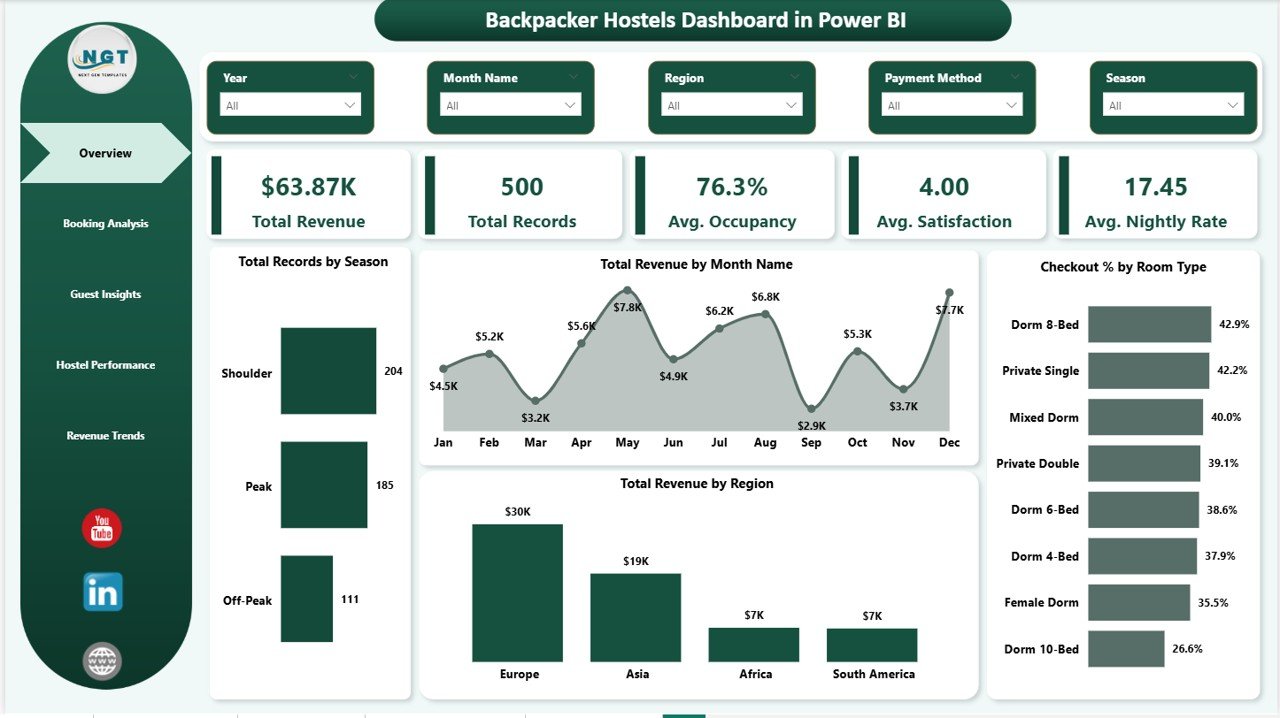
🔹 Key KPI Cards
- Total Revenue – Shows the total income generated
- Total Records – Displays total bookings or transactions
- Avg. Occupancy – Represents average occupancy rate
- Avg. Satisfaction – Indicates guest satisfaction level
- Avg. Nightly Rate – Shows average price per night
These KPIs help you quickly understand how your hostel performs.
📈 Charts on Overview Page
- Total Records by Season
This chart shows booking distribution across seasons. It helps you identify peak and low demand periods. - Total Revenue by Month
This chart tracks monthly revenue trends. Therefore, you can plan pricing and promotions effectively. - Total Revenue by Region
This chart highlights revenue contribution from different regions. As a result, you can target high-performing markets. - Checkout % by Room Type
This chart shows checkout rates for each room type. It helps you understand customer preferences.
📘 Booking Analysis – How Do Your Booking Channels Perform?
The Booking Analysis Page helps you understand how bookings are generated and managed.
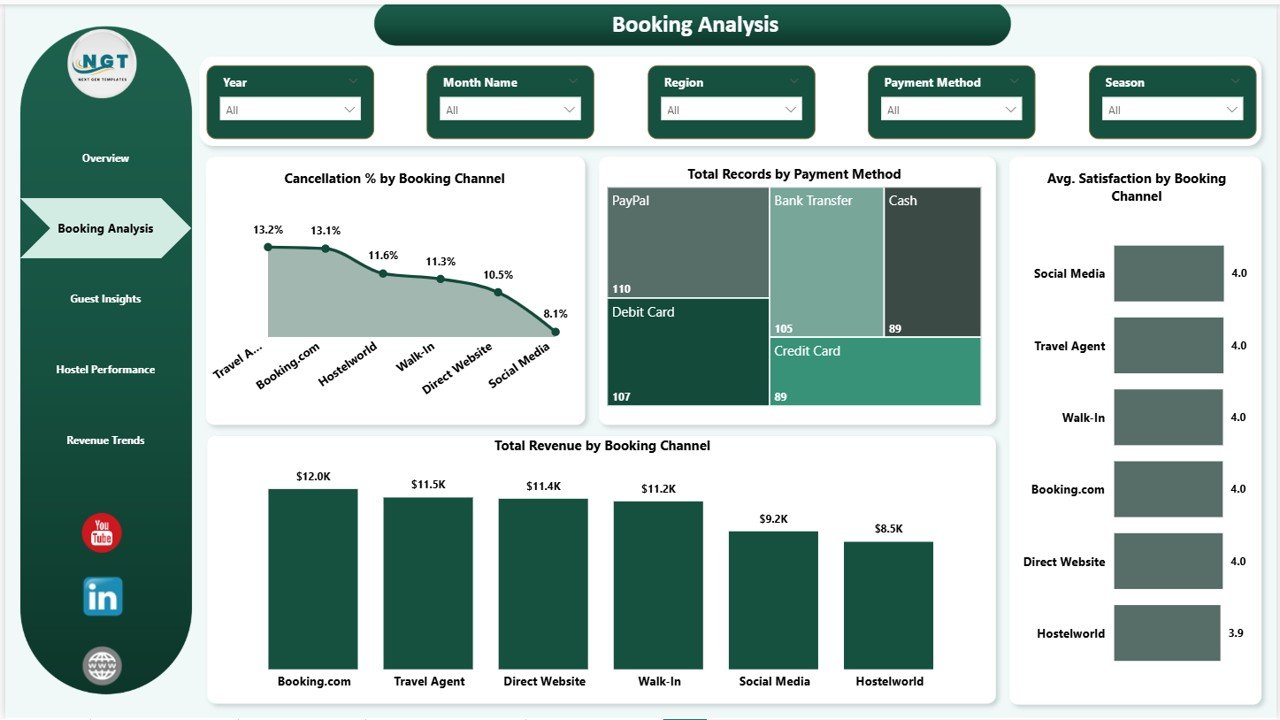
📊 Key Insights
- Total Revenue by Booking Channel
This chart shows which booking platforms generate the most revenue. Therefore, you can focus on profitable channels. - Cancellation % by Booking Channel
This chart highlights cancellation trends across channels. It helps you identify unreliable sources. - Total Records by Payment Method
This chart shows preferred payment options among guests. As a result, you can optimize payment methods. - Avg. Satisfaction by Booking Channel
This chart shows guest satisfaction by platform. It helps improve service quality.
🌍 Guest Insights – What Do Your Guests Really Want?
The Guest Insights Page provides valuable information about guest behavior and preferences.
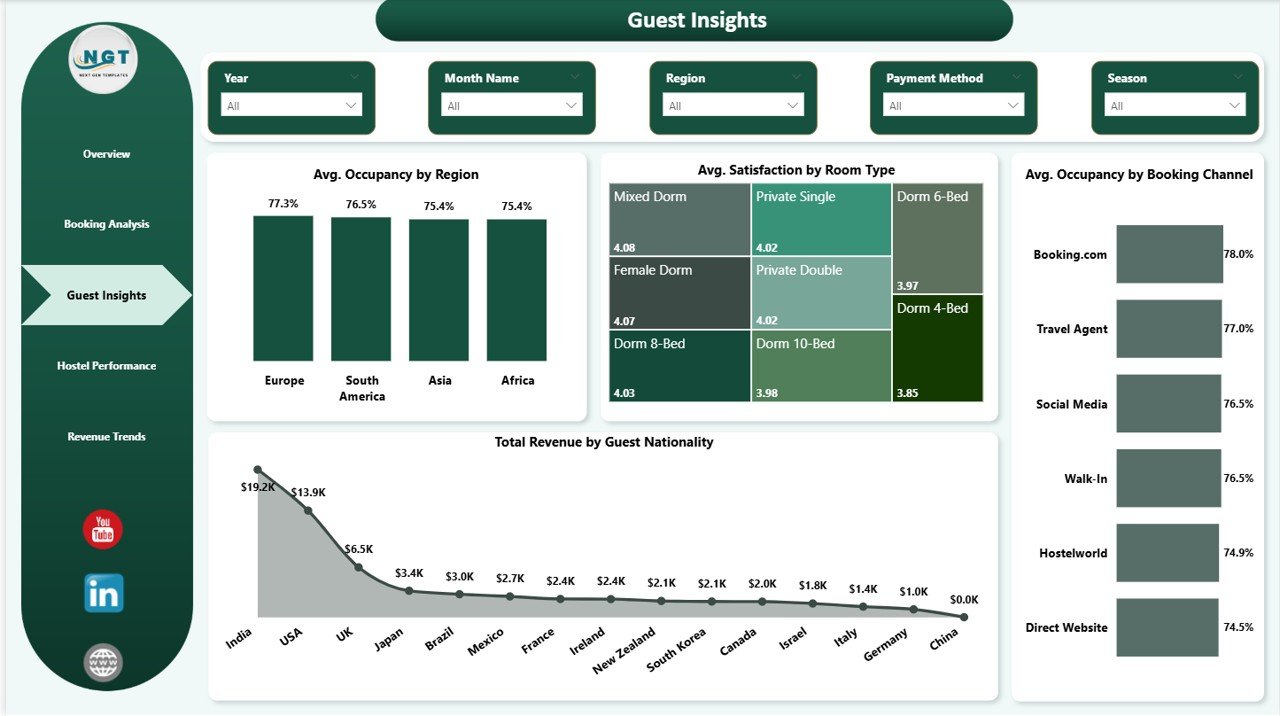
📊 Key Insights
- Total Revenue by Guest Nationality
This chart shows which countries generate the most revenue. It helps you target the right audience. - Avg. Satisfaction by Room
This chart highlights satisfaction levels for different room types. Therefore, you can improve low-performing rooms. - Avg. Occupancy by Booking Channel
This chart shows how occupancy varies by booking source. It helps optimize channel strategies. - Avg. Occupancy by Region
This chart shows regional demand trends. As a result, you can focus marketing efforts effectively.
🏨 Hostel Performance – Which Hostel Performs the Best?
The Hostel Performance Page allows you to compare multiple hostels and evaluate their performance.
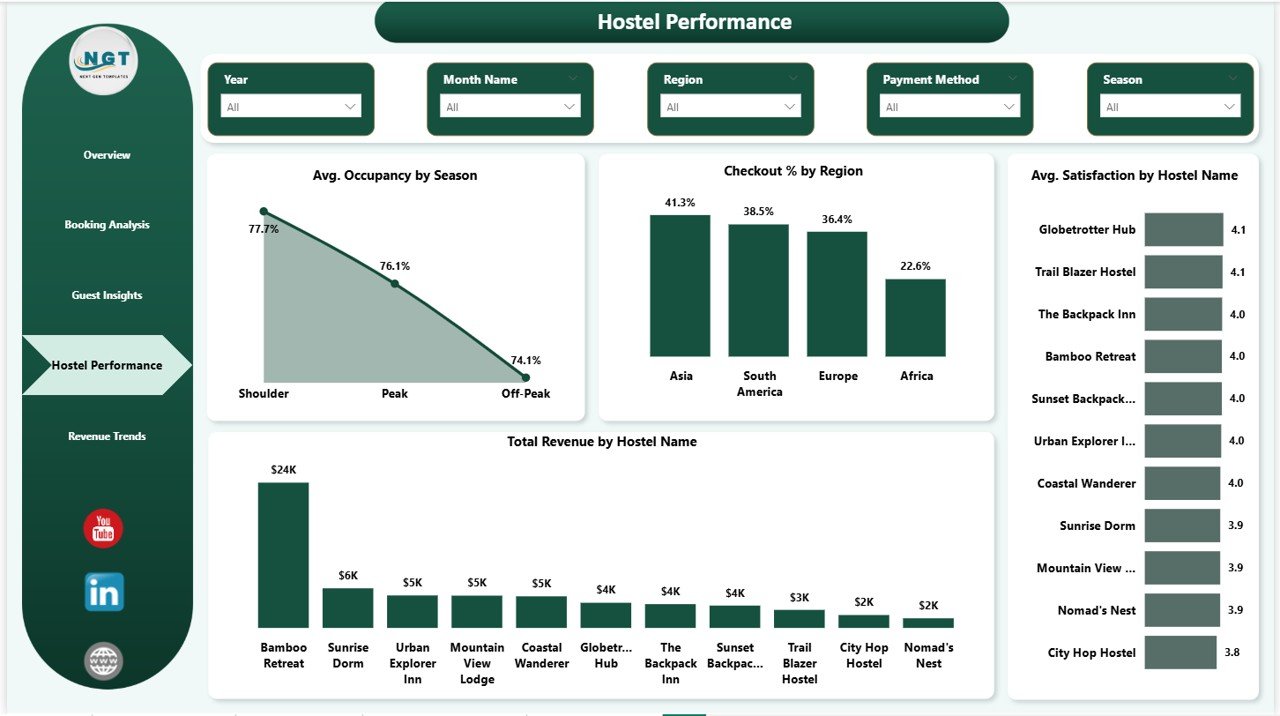
📊 Key Insights
- Total Revenue by Hostel
This chart shows revenue generated by each hostel. It helps identify top performers. - Avg. Satisfaction by Hostel Name
This chart highlights guest satisfaction levels per hostel. Therefore, you can improve services. - Checkout % by Region
This chart shows checkout behavior across regions. It helps in operational planning. - Avg. Occupancy by Season
This chart displays seasonal occupancy trends. As a result, you can plan better strategies.
💰 Revenue Trends – How Does Your Revenue Grow Over Time?
The Revenue Trends Page focuses on financial performance and pricing strategies.
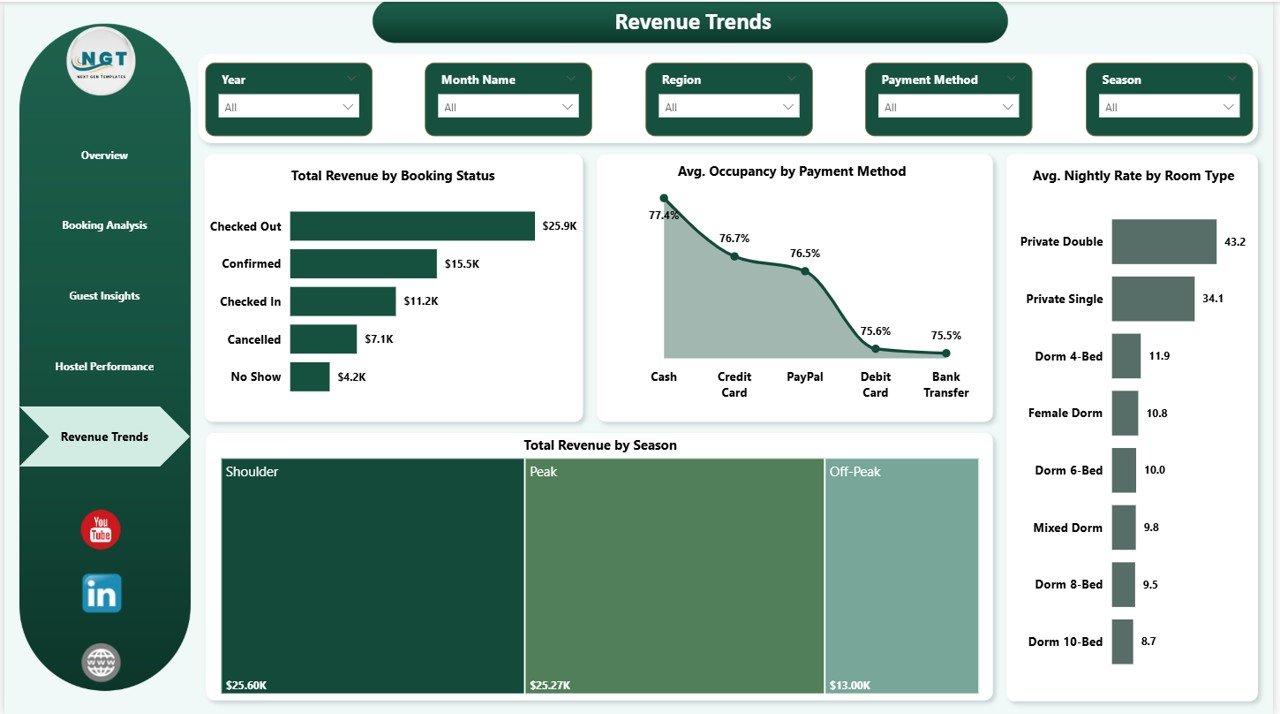
📊 Key Insights
- Total Revenue by Booking Status
This chart shows revenue based on booking status. It helps track confirmed vs canceled bookings. - Total Revenue by Season
This chart highlights seasonal revenue trends. Therefore, you can adjust pricing strategies. - Avg. Nightly Rate by Room Type
This chart shows pricing differences across room types. It helps optimize rates. - Avg. Occupancy by Payment Method
This chart shows how payment methods affect occupancy. As a result, you can refine strategies.
✅ Advantages of Backpacker Hostels Dashboard in Power BI
- ✔️ Real-Time Insights – Monitor performance instantly
- ✔️ Interactive Reports – Use slicers and filters easily
- ✔️ Better Decision Making – Make data-driven choices
- ✔️ Improved Efficiency – Reduce manual reporting
- ✔️ Scalable Solution – Handle large datasets easily
- ✔️ Visual Analytics – Understand trends quickly
⭐ Best Practices for the Backpacker Hostels Dashboard in Power BI
- 📌 Keep your data updated regularly
- 📌 Use clean and structured datasets
- 📌 Design meaningful visuals
- 📌 Use filters and slicers effectively
- 📌 Monitor KPIs frequently
- 📌 Optimize dashboard performance
- 📌 Focus on actionable insights
🚀 How Can This Dashboard Improve Your Hostel Business?
This dashboard not only helps you track performance but also improves decision-making. As a result, you can:
- Increase occupancy rates
- Improve guest satisfaction
- Optimize pricing strategies
- Reduce cancellations
- Boost revenue
🔚 Conclusion
The Backpacker Hostels Dashboard in Power BI is a powerful tool for modern hostel management. It simplifies complex data and provides actionable insights.
Moreover, it helps you monitor performance, analyze trends, and make informed decisions. Therefore, if you want to grow your hostel business, this dashboard is a must-have solution.
Backpacker Hostels Dashboard in Power BI
❓ Frequently Asked Questions (FAQs)
1. What is the purpose of this dashboard?
It helps track bookings, revenue, and guest insights in one place.
2. Is Power BI required to use this dashboard?
Yes, you need Power BI Desktop to use and customize it.
3. Can I customize the dashboard?
Yes, you can modify visuals, filters, and KPIs as per your needs.
4. How often should I update the data?
You should update it regularly for accurate insights.
5. Is this dashboard suitable for multiple hostels?
Yes, it supports multi-hostel analysis.
6. Do I need technical skills to use it?
Basic Power BI knowledge is enough to use this dashboard.
Backpacker Hostels Dashboard in Power BI
Visit our YouTube channel to learn step-by-step video tutorials