Introduction
The Camping Resorts Dashboard is a ready-to-use Excel dashboard designed to provide a comprehensive view of your camping resort’s key metrics. You can easily update your data in the Data sheet, then refresh all through the Data tab on the Excel Ribbon to see your dashboard automatically update. This interactive dashboard helps resort managers, analysts, and stakeholders make informed decisions with real-time insights.
Click to Purchases Camping Resorts Dashboard in Excel
Key Features of Camping Resorts Dashboard
- Multiple pages focusing on different aspects of resort performance and guest insights.
- High-level summary cards showcasing crucial KPIs like Total Net Revenue, Total Profit, Total Guests, Average Guest Rating, and Total Records.
- Interactive charts with multiple slicers for quick filtering and analysis.
- Dynamic pivot tables powering all the visualizations ensuring ease of data refresh and accuracy.
- User-friendly design that allows easy data input and quick dashboard refresh.
Dashboard Pages Explanation
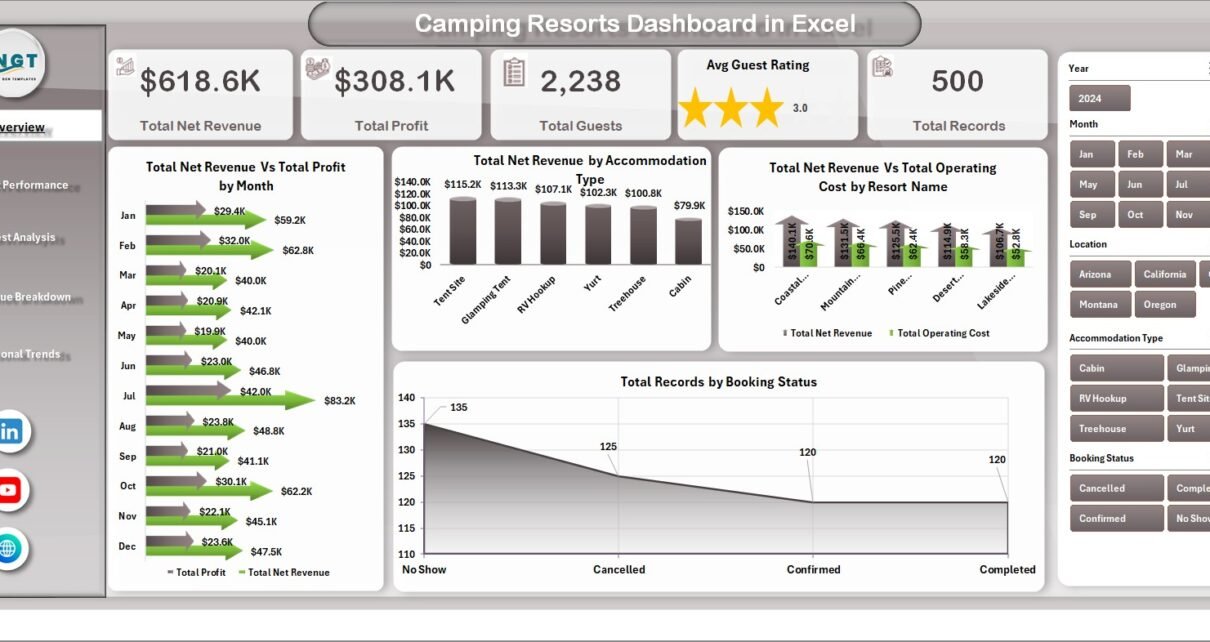
1. Overview Page
This page offers a snapshot of your resort’s key metrics and trends. At the top, cards display high-level information:
- Total Net Revenue: The sum of all revenue generated after deductions.
- Total Profit: Net earnings after all operating costs.
- Total Guests: The cumulative count of guests during the period.
- Avg Guest Rating: The average guest satisfaction score.
- Total Records: Number of booking or transaction records.
The page also features multiple charts:
- Net Revenue and Profit by Month: Shows monthly financial performance, highlighting peak revenue and profitability periods.
- Net Revenue by Accommodation Type: Compares revenue generated from different accommodation options.
- Net Revenue and Operating Cost by Resort Name: Analyzes financials across different resorts in your portfolio.
-
Click to Purchases Camping Resorts Dashboard in Excel
- Total Records by Booking Status: Displays the distribution of bookings by status like confirmed, canceled, or pending.

Camping Resorts Dashboard Overview
2. Resort Performance
This sheet provides detailed insights into how each resort is performing individually through:
- Net Revenue and Profit by Resort Name: Tracks key financial metrics for each resort.
- Avg Guest Rating by Resort Name: Identifies guest satisfaction levels per resort.
- Profit Margin % by Resort Name: Measures profitability efficiency.
- Total Records by Resort Name: Quantifies booking transactions per resort.

Resort Performance
3. Guest Analysis
This page dives deep into customer behavior and preferences with charts like:
- Number of Guests by Accommodation Type: Helps understand the popularity of different lodging options.
- Total Records by Booking Source: Shows where guests are booking from (direct, OTA, agents, etc.).
- Activity Revenue by Activity Booked: Analyzes income from resort activities.
- Avg Stay Duration by Accommodation Type: Highlights trends in guest lengths of stay.

Guest Analysis
4. Revenue Breakdown
This sheet offers a granular look at revenue streams and costs, including:
- Net Revenue and Operating Cost by Month: Comparing income and expenditures over time.
- Net Revenue and Activity Revenue by Accommodation Type: Evaluates the profitability of accommodations combined with activities.
- Net Revenue by Payment Method: Identifies preferred payment methods used by customers.
- Net Revenue by Booking Source: Details revenue contributions from different reservation channels.

Revenue Breakdown
5. Seasonal Trends
This tab reveals how seasonality impacts business through these analyses:
- Total Net Revenue Vs by Season: Compares revenue across seasons to spot busy and slow periods.
- Total Guests by Season: Tracks guest numbers per season.
- Avg Nightly Rate by Season: Shows pricing variations dependent on seasonality.
-
Click to Purchases Camping Resorts Dashboard in Excel

Seasonal Trends
6. Data Sheet Tab
This sheet is where all raw data is entered or imported in a structured format to feed the entire dashboard. Ensure data consistency here for accurate reporting.

Data Sheet tab
7. Support Sheet
The Support sheet contains multiple pivot tables that drive the dashboards’ calculations and visualizations. To refresh the dashboard after data updates, use the ‘Refresh All’ option in the Data tab of Excel Ribbon. This sheet is designed to be hidden for a cleaner user experience.

Support sheet tab
Advantages of Camping Resorts Dashboard
- Real-time insights: Instantly updated visuals reveal current business performance.
- Easy customization: Simple data input means anyone can keep the dashboard up-to-date.
- Comprehensive view: Multiple pages analyze everything from financials to guest behavior.
- Interactive filtering: Slicers enable quick data slicing without extra manual work.
- Data-driven decisions: Visuals empower management to react effectively to trends.
Opportunities for Improvement
- Integrate automated data import from reservation systems to reduce manual entry.
- Add predictive analytics for forecasting guest trends and revenue.
- Enhance mobile compatibility for on-the-go access.
- Include guest feedback sentiment analysis for a deeper understanding of ratings.
Best Practices
- Regularly update the Data sheet to ensure dashboard accuracy.
- Use clear and consistent naming conventions for resorts, accommodations, and activities.
- Leverage slicers to drill down into data for targeted insights.
- Secure the dashboard file to prevent inadvertent data corruption.
- Backup your data frequently before major updates.
FAQs
- How do I refresh the dashboard after updating data?
Go to the Data tab in Excel Ribbon and click ‘Refresh All’ – all pivot tables and charts update automatically. - Can I add new resorts or accommodation types?
Yes, add new entries to the Data sheet in the correct format; then refresh the dashboard. - Is this dashboard compatible with Excel versions?
It is compatible with Excel 2016 and above supporting pivot tables and slicers. - Can I customize charts and visuals?
Yes, you can modify existing charts or add new ones on respective sheets as needed. - Can this dashboard handle large datasets?
Yes, but performance depends on your system and Excel’s processing capability. -
Click to Purchases Camping Resorts Dashboard in Excel
Conclusion
The Camping Resorts Dashboard is a powerful tool that transforms complex resort data into clear, actionable insights. Its ease of use, dynamic visuals, and multi-faceted analysis make it ideal for resort managers looking to optimize operations and improve guest experiences. Regular data updates and refreshes ensure your resort stays ahead with data-driven decision making.
For more insights and to watch the dashboard in action, visit our YouTube channel.
For additional Microsoft Excel dashboard resources, check out Microsoft Excel Support.
Click to Purchases Camping Resorts Dashboard in Excel