Introduction
The Carbon Capture Firms Dashboard in Power BI is a powerful, ready-to-use analytical tool designed to help you monitor and analyze key metrics related to carbon capture projects. By simply updating the associated data file and refreshing your Power BI report, you gain instant insights into operational efficiency, project progress, financials, and compliance details across various firms and technologies.
Click to Purchases Carbon Capture Firms Dashboard in Power BI
Key Features of Carbon Capture Firms Dashboard in Power BI
- Fully customizable and refreshable by updating your data source.
- Multiple interactive pages and slicers for dynamic filtering.
- Insightful visualizations, including cards, charts, and maps.
- Comprehensive overview of project metrics like efficiency, funding, and revenue.
- Detailed financial, operational, and compliance reporting.
- User-friendly interface designed for quick decision-making.
Dashboard Pages Explanation
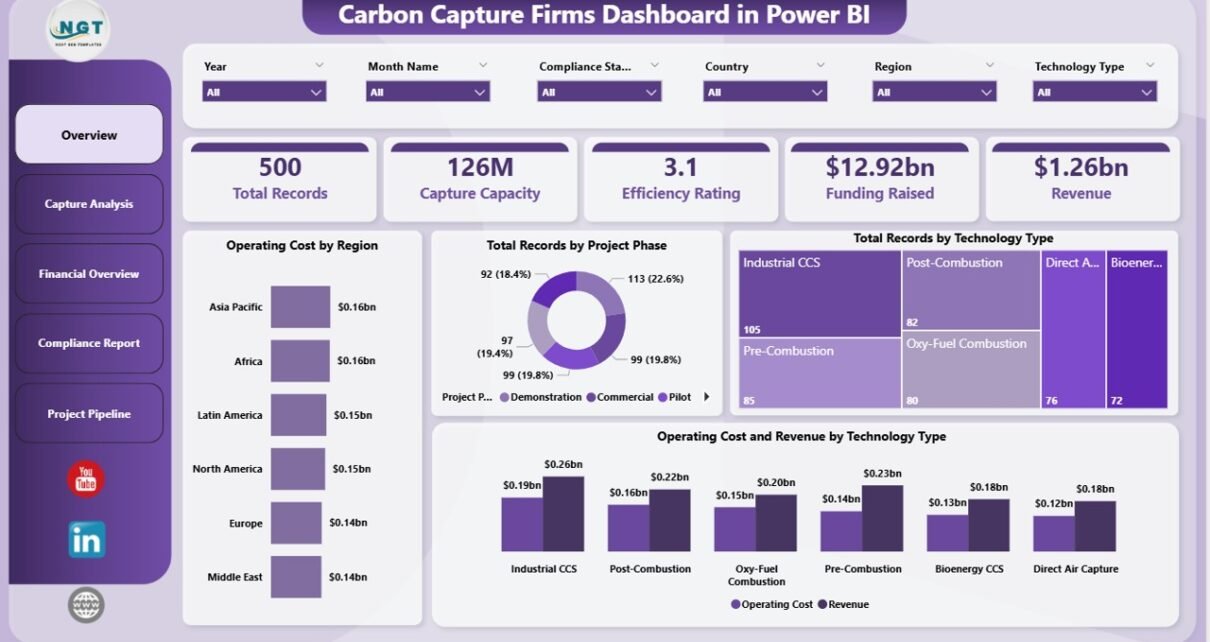
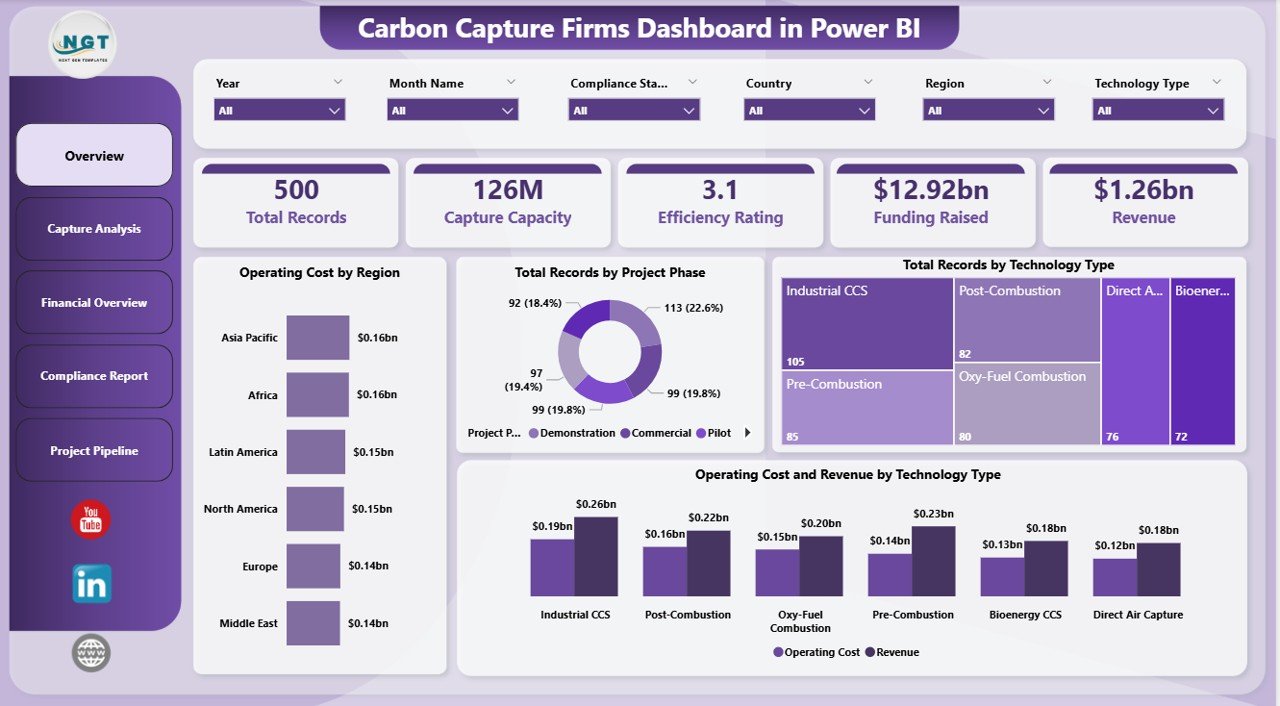
1 – Overview Page
This page provides a high-level summary using cards and diverse charts to give a snapshot of carbon capture projects.
- Cards:
- Total Records: Number of projects tracked in the dataset.
- Capture Capacity: Total CO2 capture capacity aggregated from all records.
- Efficiency Rating: Average operational efficiency rating across projects.
- Funding Raised: Total funding secured by firms involved.
- Revenue: Combined revenue from all projects and firms.
- Charts:
- Operating Cost by Region: Displays how operating costs vary across different geographic regions, highlighting cost-intensive areas.
- Total Records by Project Phase: Shows the distribution of projects in various phases such as planning, execution, or closure.
- Total Records by Technology Type: Illustrates the count of projects categorized by the carbon capture technologies used.
- Operating Cost and Revenue by Technology Type: Compares costs and revenue generated by each technology to identify profitability.
Carbon Capture Firms Dashboard in Power BI
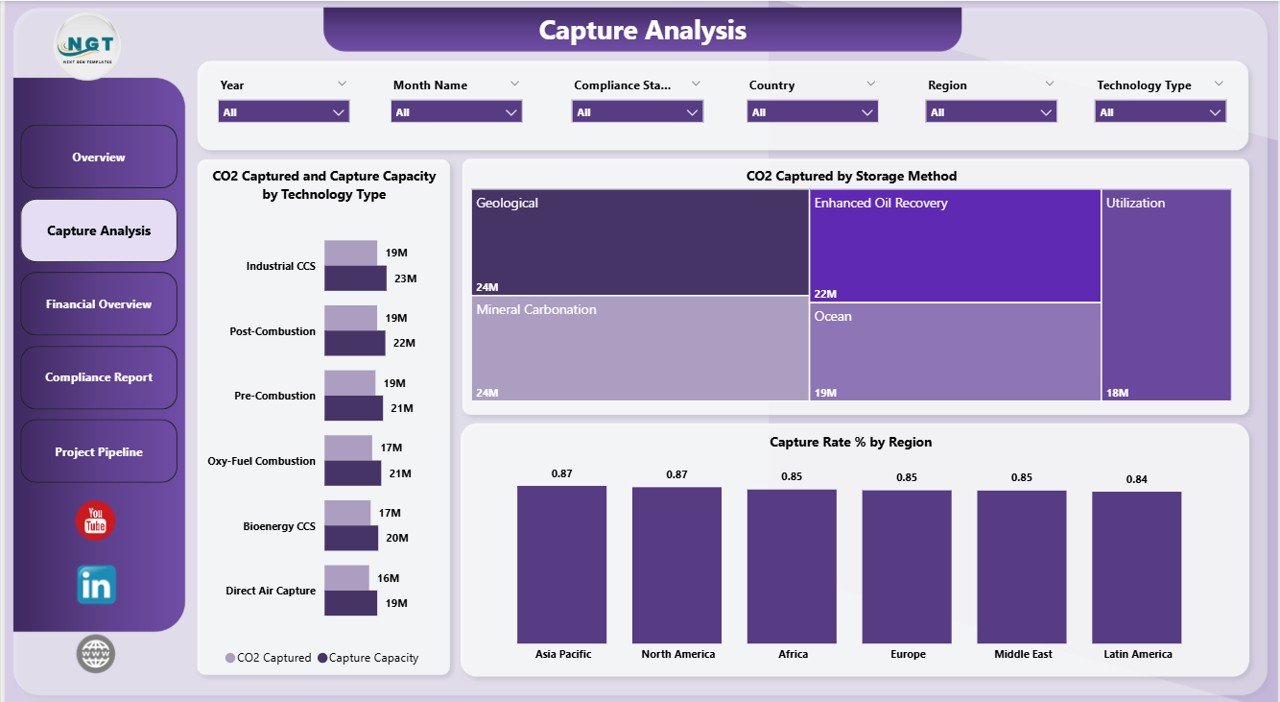
2 – Capture Analysis
This tab delivers deeper insights into carbon removal performance across various technologies and methods.
- CO2 Captured and Capture Capacity by Technology Type: Compares actual CO2 emissions captured against the potential capacity per technology.
- CO2 Captured by Storage Method: Breaks down captured CO2 volumes based on their designated storage techniques.
- Capture Rate % by Region: Displays the efficiency of carbon capture operations as a percentage within geographic regions.
-
Click to Purchases Carbon Capture Firms Dashboard in Power BI
Capture Analysis in Carbon Capture Firms Dashboard
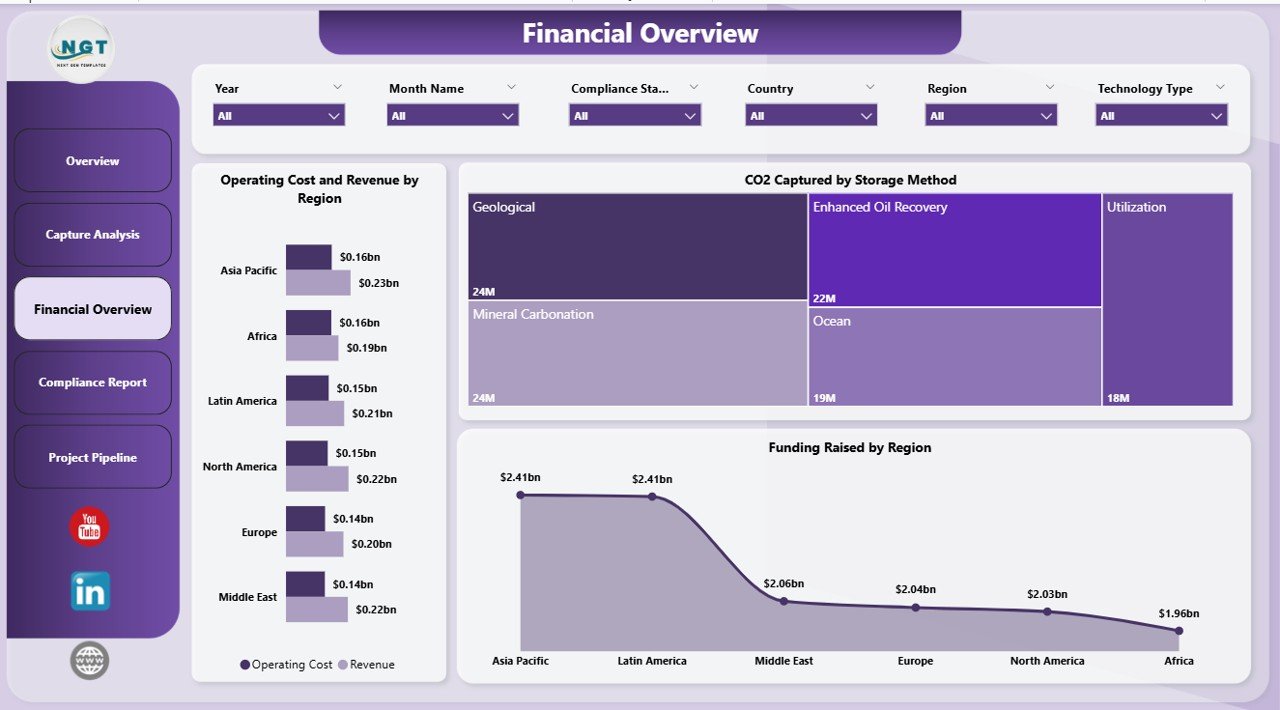
3 – Financial Overview
The financial tab focuses on funding, costs, and revenue streams by region and storage methods.
- Operating Cost and Revenue by Region: Tracks financial performance metrics geographically, highlighting areas with high expenditure or profit.
- CO2 Captured by Storage Method: Integrates financial data with storage techniques to assess economic viability.
- Funding Raised by Region: Displays the amount of financial investments secured by different regions.
Financial Overview in Carbon Capture Firms Dashboard
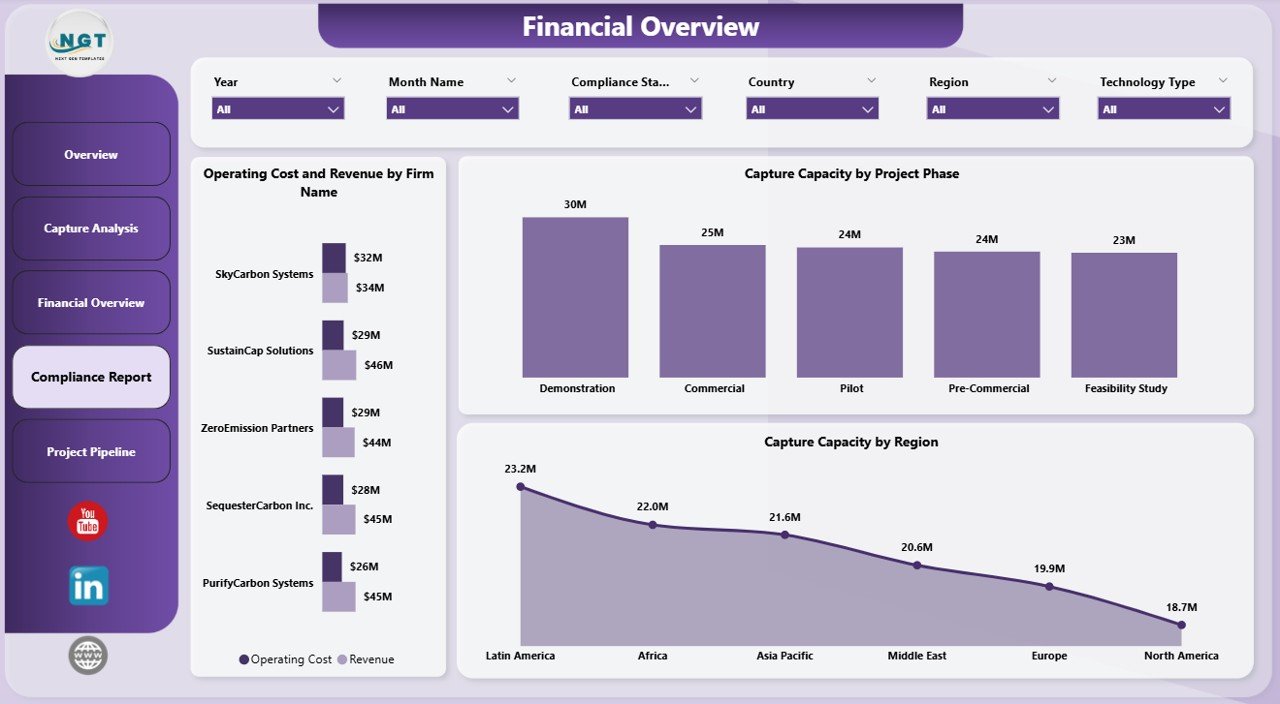
4 – Compliance Report
This section enables users to monitor compliance with operational and regulatory standards across firms and regions.
- Operating Cost and Revenue by Firm Name: Tracks financial metrics on a firm-by-firm basis.
- Capture Capacity by Project Phase: Reviews capacity targets relative to project lifecycle stages.
- Capture Capacity by Region: Assesses if regional capacity targets align with regulations.
Compliance Report in Carbon Capture Firms Dashboard
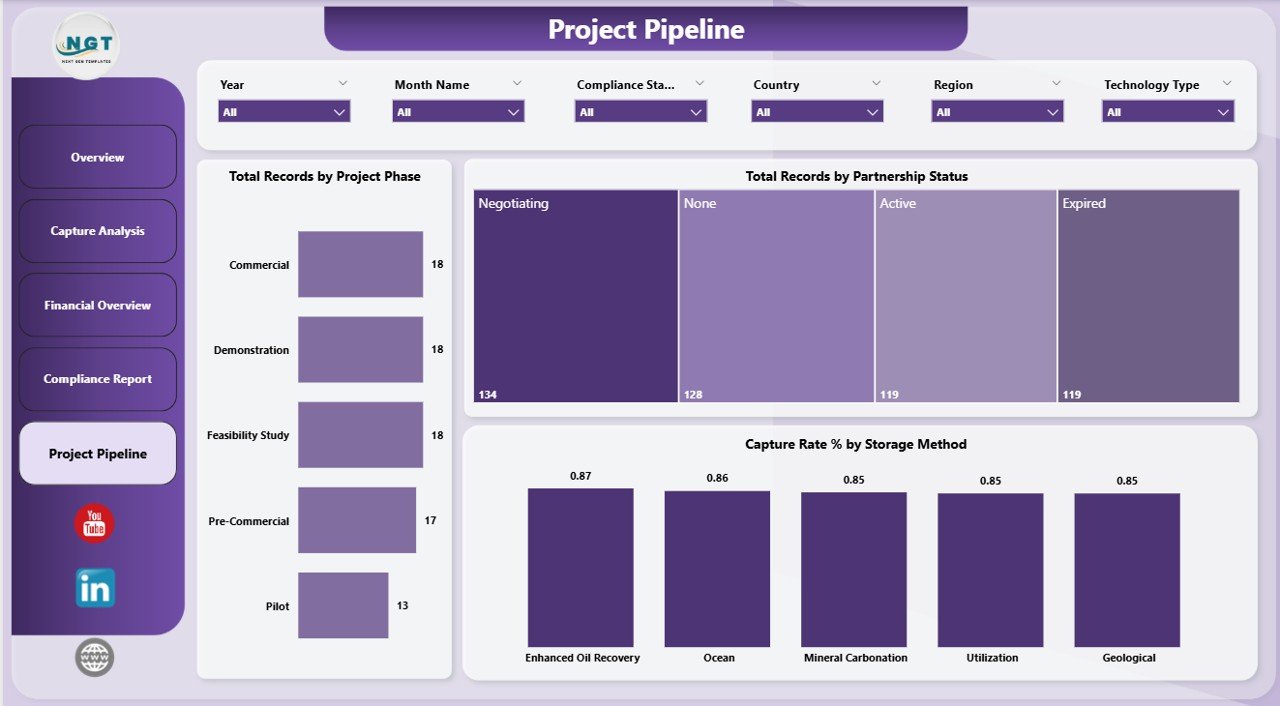
5 – Project Pipeline
Get a forward-looking view on projects currently in development and their characteristics.
- Total Records by Project Phase: Displays ongoing project counts segmented by development phases.
- Total Records by Partnership Status: Indicates how many projects are operated independently versus through partnerships.
- Capture Rate % by Storage Method: Shows the efficiency rate of carbon capture tailored by the storage technique applied.
-
Click to Purchases Carbon Capture Firms Dashboard in Power BI
Project Pipeline in Carbon Capture Firms Dashboard
Advantages of Carbon Capture Firms Dashboard in Power BI
- Efficiency: Automates data refresh and visualization updates for real-time analysis.
- Comprehensive Insights: Covers operational, financial, compliance, and pipeline data in a cohesive manner.
- User-Friendly Interface: Easy to navigate with slicers and filters to find relevant data quickly.
- Customization: Easily adaptable to specific data sets or organizational requirements.
- Supports Decision Making: Visual and summarized data helps stakeholders act confidently.
Opportunities for Improvement
- Include predictive analytics and trend forecasting for enhanced future planning.
- Add geo-mapping for more intuitive geographic data visualization.
- Enhance mobile responsiveness for users accessing the dashboard on different devices.
- Integrate real-time data streaming for more live updates as projects evolve.
Best Practices
- Ensure regular updates of the underlying data file before refreshing the dashboard.
- Use the provided slicers strategically to drill down or aggregate data as needed.
- Validate data accuracy frequently to maintain reliable insights.
- Share dashboard access only with stakeholders and team members who require the information.
- Document and train users on dashboard features for optimum utility.
FAQs
- How do I update the data for this dashboard?
Simply update your data in the Excel or source data file, connect it to the Power BI file, and click the Refresh button from the Home tab in Power BI. - Can I customize the dashboard visuals?
Yes, the dashboard is editable within Power BI. You can modify or add visuals as per your analysis needs. - Do I need Power BI Pro to use this dashboard?
While you can use Power BI Desktop for personal use, sharing or publishing may require Power BI Pro or Premium. - Is this dashboard suitable for all types of carbon capture firms?
Yes, this dashboard is designed to be flexible and applicable across diverse firms and technologies in the carbon capture space. -
Click to Purchases Carbon Capture Firms Dashboard in Power BI
Conclusion
The Carbon Capture Firms Dashboard in Power BI offers an all-encompassing solution to streamline monitoring, evaluation, and reporting of carbon capture initiatives. It connects your data seamlessly with powerful visual analytics, enabling actionable insights with minimal setup. Whether tracking funding, project phases, or efficiency, this dashboard empowers organizations to drive sustainability goals effectively.
Leverage the dashboard to enhance data-driven decision-making within your carbon capture operations and unlock new potentials. Regularly update your data, explore the interactive pages, and utilize the dashboard to its fullest for optimal results.
For more detailed tutorials and demo videos, visit our YouTube channel.
Explore more about Power BI and data analytics at Microsoft Power BI official site.
Click to Purchases Carbon Capture Firms Dashboard in Power BI