Organizations across the world are shifting toward sustainable business models. Today, companies no longer focus only on profit. Instead, they also measure environmental impact, resource efficiency, waste reduction, and long-term sustainability. Because of this shift, businesses need structured tools to track circular economy performance effectively.That is exactly where the Circular Economy KPI Scorecard in Excel becomes essential.In this article, you will learn everything about the Circular Economy KPI Scorecard in Excel, including its purpose, features, benefits, implementation process, best practices, and frequently asked questions. Moreover, you will understand how this ready-to-use Excel template helps organizations monitor sustainability KPIs using a simple yet powerful system.
Click to buy Circular Economy KPI Scorecard in Excel
What Is a Circular Economy KPI Scorecard in Excel?
A Circular Economy KPI Scorecard in Excel is a ready-to-use performance management tool designed to measure and track sustainability and circular economy metrics in a structured format.
Unlike traditional reporting methods, this scorecard centralizes all key sustainability indicators into one interactive dashboard. As a result, organizations can evaluate performance quickly and make informed decisions.
The circular economy focuses on:
- Reducing waste
- Reusing materials
- Recycling resources
- Extending product life cycles
- Improving energy efficiency
Therefore, businesses require measurable KPIs to monitor progress. Excel provides a flexible and cost-effective platform to manage these indicators without investing in expensive software.
Why Do Organizations Need a Circular Economy KPI Scorecard?
Many organizations attempt to track sustainability using scattered spreadsheets. However, this approach creates confusion and delays decision-making.
A structured KPI scorecard solves these problems because it:
- Standardizes sustainability measurement
- Improves transparency across departments
- Enables real-time performance tracking
- Supports ESG and sustainability reporting
- Encourages data-driven environmental strategies
Furthermore, leaders gain visibility into performance trends, allowing them to adjust strategies proactively instead of reacting too late.
Key Features of Circular Economy KPI Scorecard in Excel
This ready-to-use template simplifies KPI monitoring through a well-structured workbook design. The scorecard contains four worksheets, each serving a specific purpose.
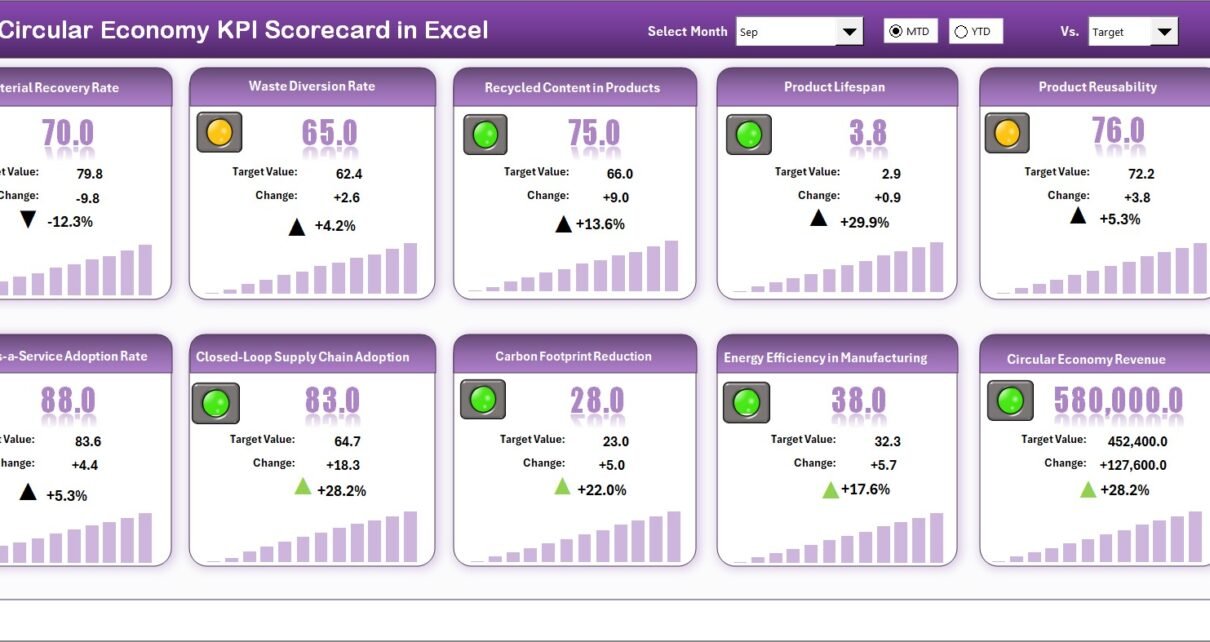
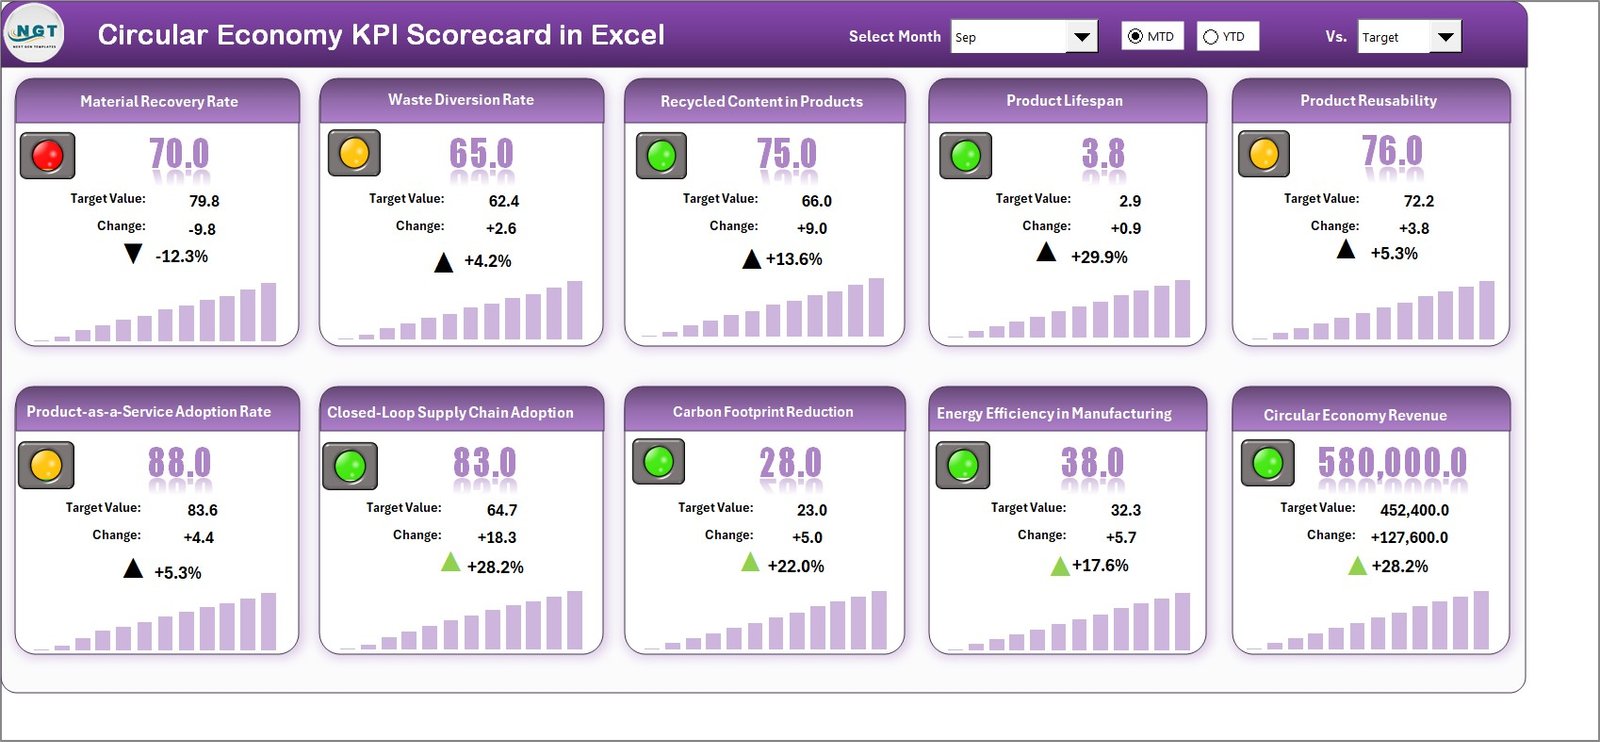
Scorecard Sheet – The Main Performance Dashboard
The Scorecard Sheet acts as the primary interface where users analyze KPI performance instantly.
Key Functionalities
- Dropdown Menus
- Select Month for analysis
- Switch between MTD (Month-to-Date) and YTD (Year-to-Date) views
- Instantly refresh dashboard values
- Actual vs Target Comparison
- Compare real performance against defined goals
- Identify underperforming areas quickly
- Visual Indicators
- Conditional formatting highlights performance status
- Color coding simplifies interpretation
- Comprehensive KPI Overview
- Displays all KPI details in one place
- Shows MTD and YTD comparisons simultaneously
- Single View Monitoring
- Track 10 KPIs on one screen
- Reduce reporting complexity
Because everything appears on one dashboard, managers can evaluate sustainability progress within seconds.
Click to buy Circular Economy KPI Scorecard in Excel
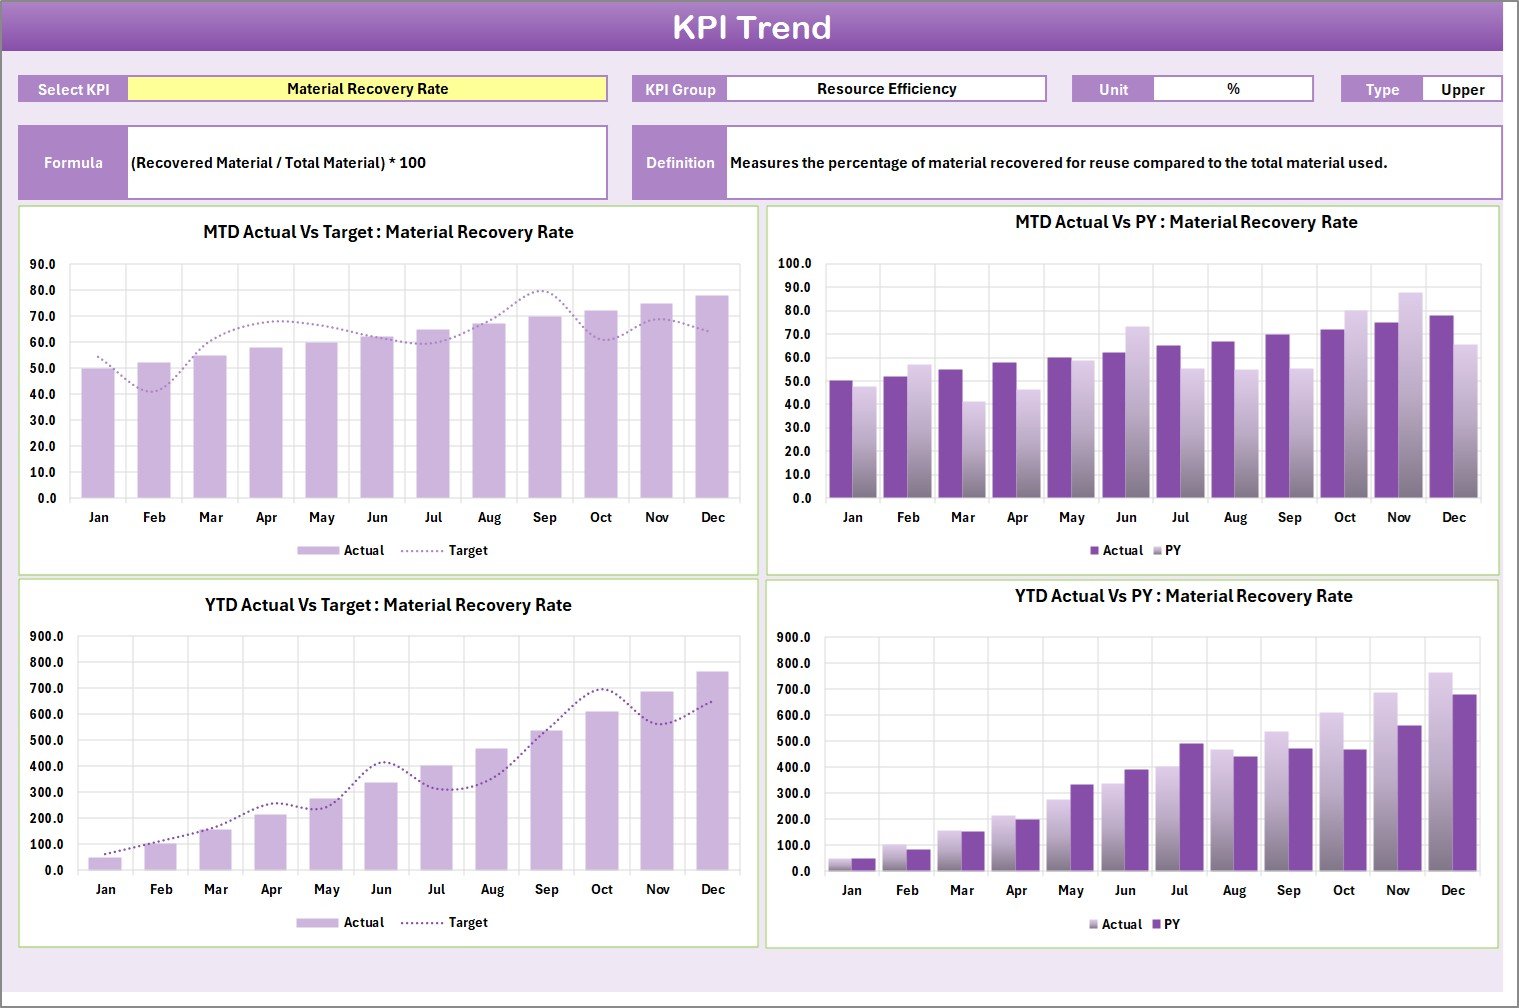
KPI Trend Sheet – Performance Analysis Over Time
While the scorecard shows current performance, the KPI Trend Sheet focuses on historical analysis.
Users can select a KPI from the dropdown located in Cell C3, which dynamically updates the entire view.
Information Displayed
- KPI Group
- KPI Unit
- KPI Type (Lower the Better or Upper the Better)
- KPI Formula
- KPI Definition
Additionally, the sheet includes:
- MTD Trend Chart
- YTD Trend Chart
- Actual vs Target vs Previous Year comparison
Therefore, decision-makers can easily identify improvement patterns and seasonal variations.
Click to buy Circular Economy KPI Scorecard in Excel
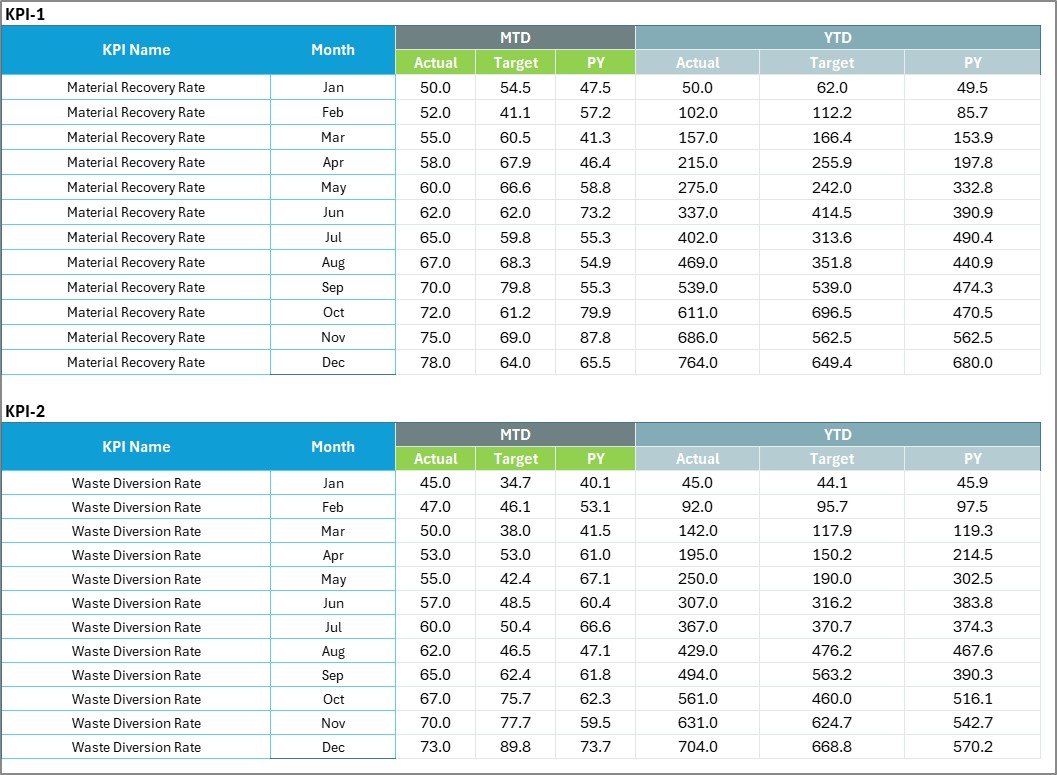
Input Data Sheet – Centralized Data Entry
The Input Data Sheet serves as the data foundation of the scorecard.
Main Functions
- Enter Actual KPI values
- Record Target numbers
- Update monthly performance
- Maintain consistent data structure
Because the system updates automatically, users only need to enter data once. Consequently, the scorecard remains accurate and current.
Click to buy Circular Economy KPI Scorecard in Excel
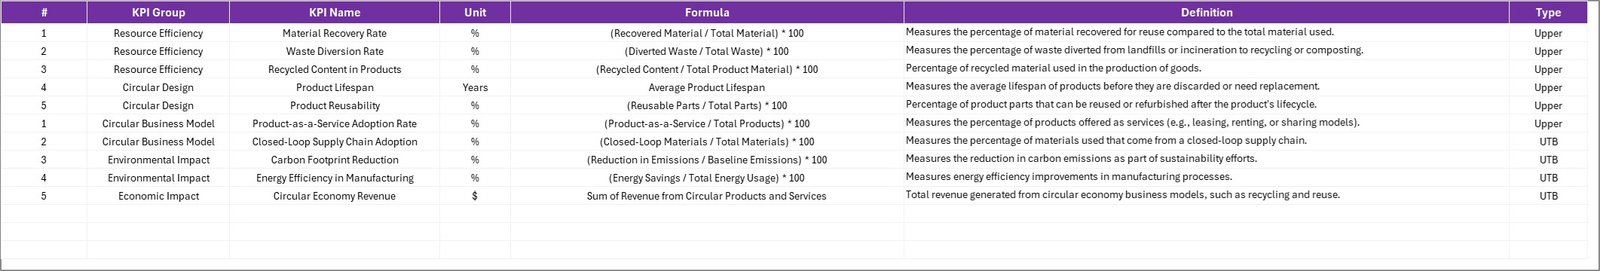
KPI Definition Sheet – KPI Documentation Center
The KPI Definition Sheet ensures clarity and standardization.
Users enter:
- KPI Name
- KPI Group
- Unit of Measurement
- KPI Formula
- KPI Definition
This documentation eliminates confusion and ensures every stakeholder understands how KPIs work.
Click to buy Circular Economy KPI Scorecard in Excel
What KPIs Can Be Included in a Circular Economy Scorecard?
Organizations can customize KPIs depending on industry requirements. However, common circular economy KPIs include:
- Material Recycling Rate
- Waste Reduction Percentage
- Energy Consumption per Unit
- Water Reuse Ratio
- Carbon Emission Reduction
- Product Lifecycle Extension Rate
- Renewable Energy Usage
- Resource Recovery Rate
- Sustainable Supplier Percentage
- Packaging Reusability Index
Because Excel allows flexibility, businesses can easily modify KPIs without technical expertise.
How Does the Circular Economy KPI Scorecard Work?
The workflow remains simple and user-friendly.
Step-by-Step Process
- Define KPIs in the KPI Definition sheet
- Enter targets and actual data in Input Data sheet
- Select month or YTD view in Scorecard sheet
- Review performance indicators
- Analyze trends in KPI Trend sheet
- Take corrective actions based on insights
As a result, organizations move from manual reporting to structured performance monitoring.
Advantages of Circular Economy KPI Scorecard in Excel
Implementing this scorecard provides multiple operational and strategic benefits.
Improved Sustainability Tracking
Organizations monitor environmental performance consistently.
Better Decision-Making
Managers identify issues early and respond quickly.
Cost-Effective Solution
Excel eliminates the need for expensive analytics software.
Easy Implementation
Teams start using the template immediately.
Increased Transparency
All departments access standardized KPI definitions.
Performance Accountability
Clear targets encourage responsible operations.
Data Visualization
Charts and indicators simplify complex information.
How Does This Scorecard Support ESG Reporting?
Environmental, Social, and Governance (ESG) reporting requires reliable data. The KPI scorecard helps organizations:
- Track sustainability progress accurately
- Maintain audit-ready KPI documentation
- Provide measurable environmental metrics
- Align business goals with sustainability initiatives
Therefore, companies strengthen stakeholder confidence while improving compliance.
Who Can Use the Circular Economy KPI Scorecard?
This Excel template suits multiple industries and organizational roles.
Industries
- Manufacturing
- Recycling companies
- Logistics organizations
- Retail and consumer goods
- Energy companies
- Construction firms
- Government agencies
Roles
- Sustainability Managers
- Operations Leaders
- ESG Analysts
- Environmental Consultants
- Business Analysts
- Corporate Strategy Teams
Because the structure remains flexible, organizations of any size can adopt it.
How to Implement Circular Economy KPIs Successfully?
Successful implementation requires planning and consistency.
Define Clear Objectives
First, organizations must identify sustainability goals aligned with business strategy.
Select Relevant KPIs
Choose measurable indicators that directly impact circular economy outcomes.
Assign Ownership
Each KPI should have a responsible owner.
Monitor Regularly
Update data monthly to maintain accuracy.
Review Trends Frequently
Trend analysis helps detect long-term improvement opportunities.
Best Practices for the Circular Economy KPI Scorecard in Excel
Following best practices ensures maximum value from the scorecard.
Keep KPIs Simple and Measurable
Avoid overly complex indicators.
Update Data Consistently
Regular updates improve reliability.
Use Standard Definitions
Ensure everyone interprets KPIs the same way.
Focus on Actionable Metrics
Track KPIs that drive decisions.
Review Performance Monthly
Frequent reviews encourage improvement.
Align KPIs with Sustainability Goals
Connect metrics directly with environmental strategy.
Train Users Properly
Ensure team members understand how to use the template.
How Does Excel Make KPI Tracking Easier?
Excel remains one of the most powerful business tools because:
- Most employees already know how to use it
- It supports automation and formulas
- Dashboards update dynamically
- Customization remains simple
- Data integration becomes easier
Therefore, organizations achieve advanced analytics without complex systems.
Future of Circular Economy Performance Management
Sustainability measurement will continue evolving. Businesses increasingly adopt:
- Data-driven ESG strategies
- Automated reporting tools
- Real-time sustainability dashboards
- AI-supported analytics
However, Excel scorecards will remain valuable because they provide flexibility, accessibility, and affordability.
Conclusion
The Circular Economy KPI Scorecard in Excel provides a practical and powerful way to measure sustainability performance. Instead of managing multiple spreadsheets, organizations gain a centralized system for tracking KPIs, analyzing trends, and improving environmental outcomes.
Moreover, the template simplifies complex sustainability reporting while supporting better strategic decisions. Because it combines flexibility with visualization, teams can monitor progress efficiently and continuously improve operations.
In today’s sustainability-focused world, businesses that measure performance accurately gain a strong competitive advantage. Therefore, adopting a structured KPI scorecard represents an important step toward achieving circular economy goals.
Frequently Asked Questions (FAQs)
What is a Circular Economy KPI Scorecard?
A Circular Economy KPI Scorecard is a tool used to measure sustainability performance using predefined environmental and operational KPIs.
Why should businesses track circular economy KPIs?
Businesses track these KPIs to reduce waste, improve resource efficiency, and support sustainability reporting.
Can beginners use this Excel scorecard?
Yes. The template uses simple dropdowns and structured sheets, making it easy for beginners.
How often should KPI data be updated?
Organizations should update KPI data monthly for accurate analysis.
Can KPIs be customized?
Yes. Users can modify KPIs based on industry requirements.
Does the scorecard support YTD analysis?
Yes. The template allows both Month-to-Date and Year-to-Date performance tracking.
Is Excel suitable for sustainability dashboards?
Yes. Excel offers flexibility, automation, and visualization features ideal for KPI tracking.
How many KPIs can be tracked?
The main scorecard displays 10 KPIs at once, but users can expand the dataset.
Who benefits most from this template?
Sustainability managers, ESG teams, analysts, and operational leaders benefit the most.
Does the scorecard help with ESG reporting?
Yes. It organizes sustainability metrics clearly, supporting ESG disclosures and reporting.
Visit our YouTube channel to learn step-by-step video tutorials
Watch the step-by-step video tutorial:
Click to buy Circular Economy KPI Scorecard in Excel