Introduction
The Civic Engagement Platforms Dashboard in Excel is a powerful, ready-to-use tool designed to help organizations track and analyze civic engagement activities efficiently. By simply updating your data in the Data sheet and refreshing the dashboard, you can gain valuable insights into visits, users, campaigns, funds raised, and much more.
Click to Purchases Civic Engagement Platforms Dashboard in Excel
Key Features of Civic Engagement Platforms Dashboard in Excel
- Dynamic and interactive Excel dashboard made for civic engagement analysis.
- Multiple pages covering different dimensions of civic platform performance.
- Easy data refresh capability to update the entire dashboard with a single click.
- Comprehensive use of cards, charts, and slicers for quick filtering and in-depth analysis.
- Automated pivot tables driving dynamic charts for real-time insights.
Dashboard Pages Explanation
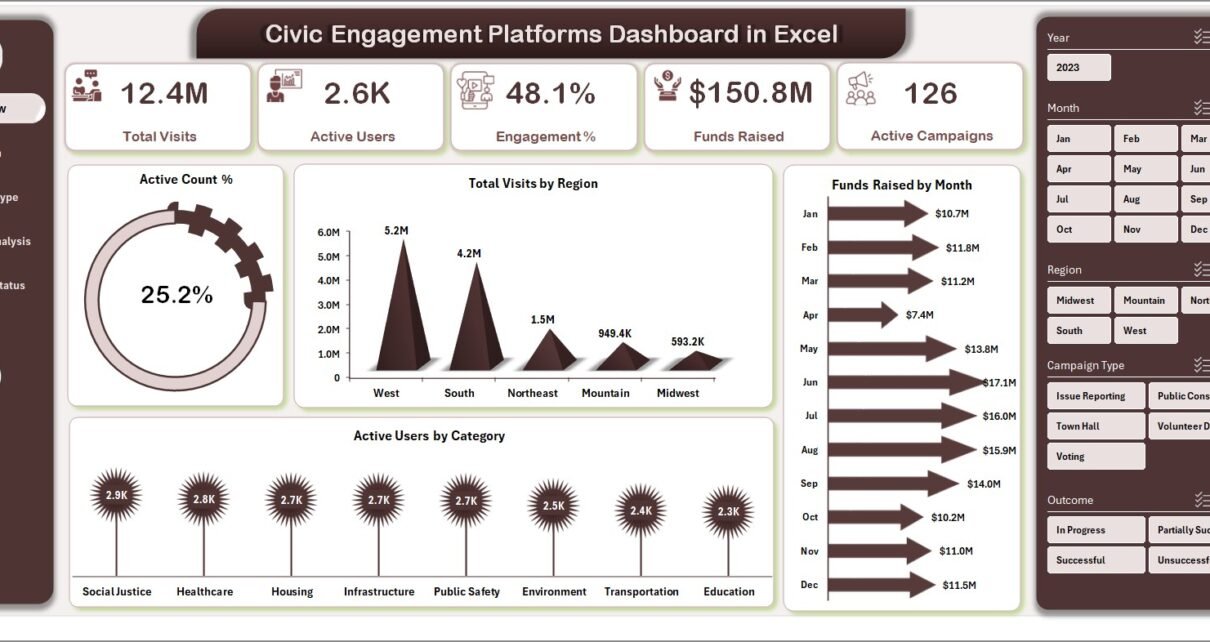
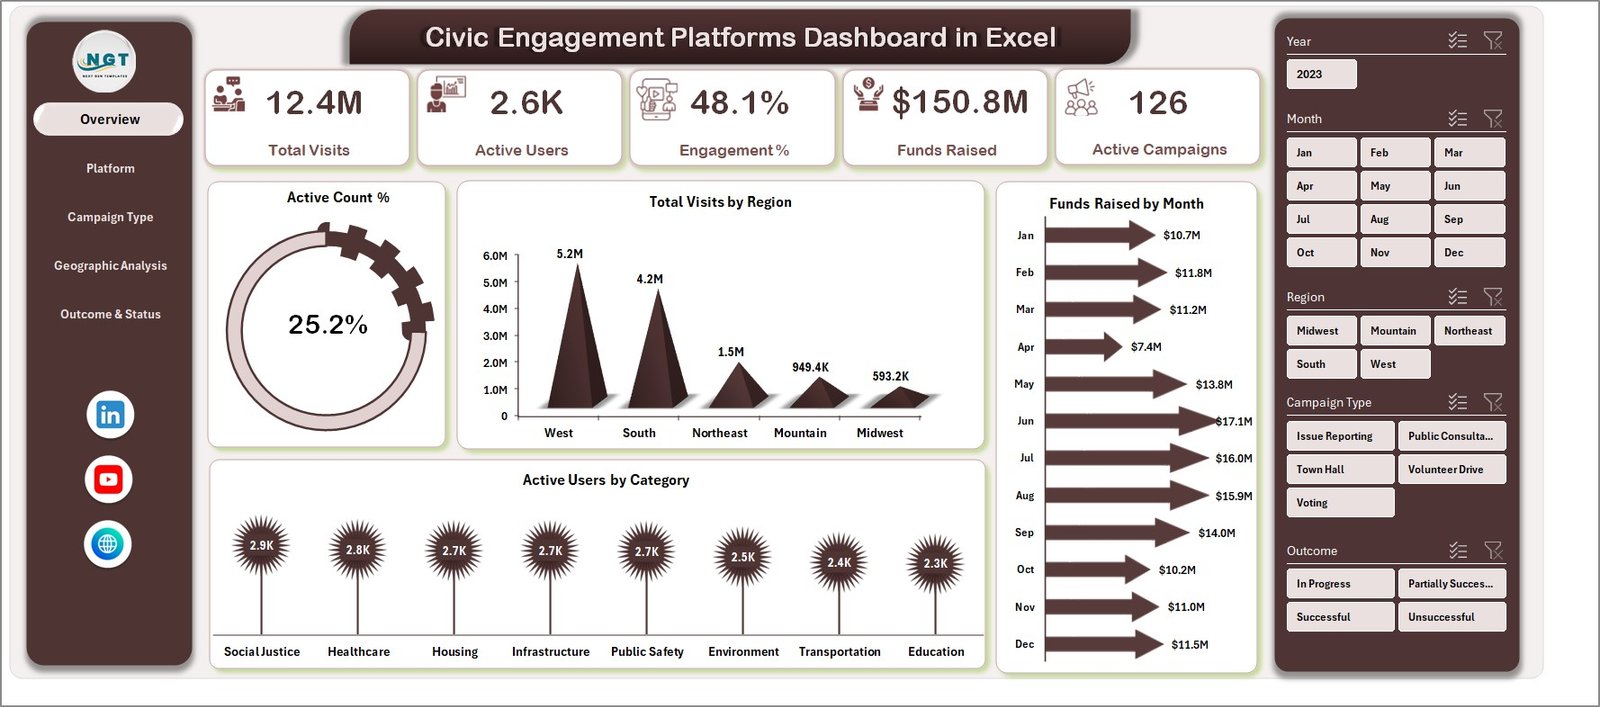
1. Overview Page
The Overview page offers a snapshot of your civic engagement performance through high-level cards and interactive charts.
- Cards: Display key metrics such as Total Visits, Active Users, Engagement %, Funds Raised, and Active Campaigns.
- Charts:
- Active Count %: Shows the proportion of active users relative to total users, allowing for quick engagement assessment.
- Total Visits by Region: Visualizes user visit distribution across various geographic areas for strategic planning.
- Funds Raised by Month: Tracks fundraising progress month-by-month to identify trends and spikes.
- Active Users by Category: Highlights participation across different user segments or categories.
- Slicers: Enable quick filtering based on region, campaign type, or date to tailor the analysis.
Civic Engagement Platforms Dashboard in Excel
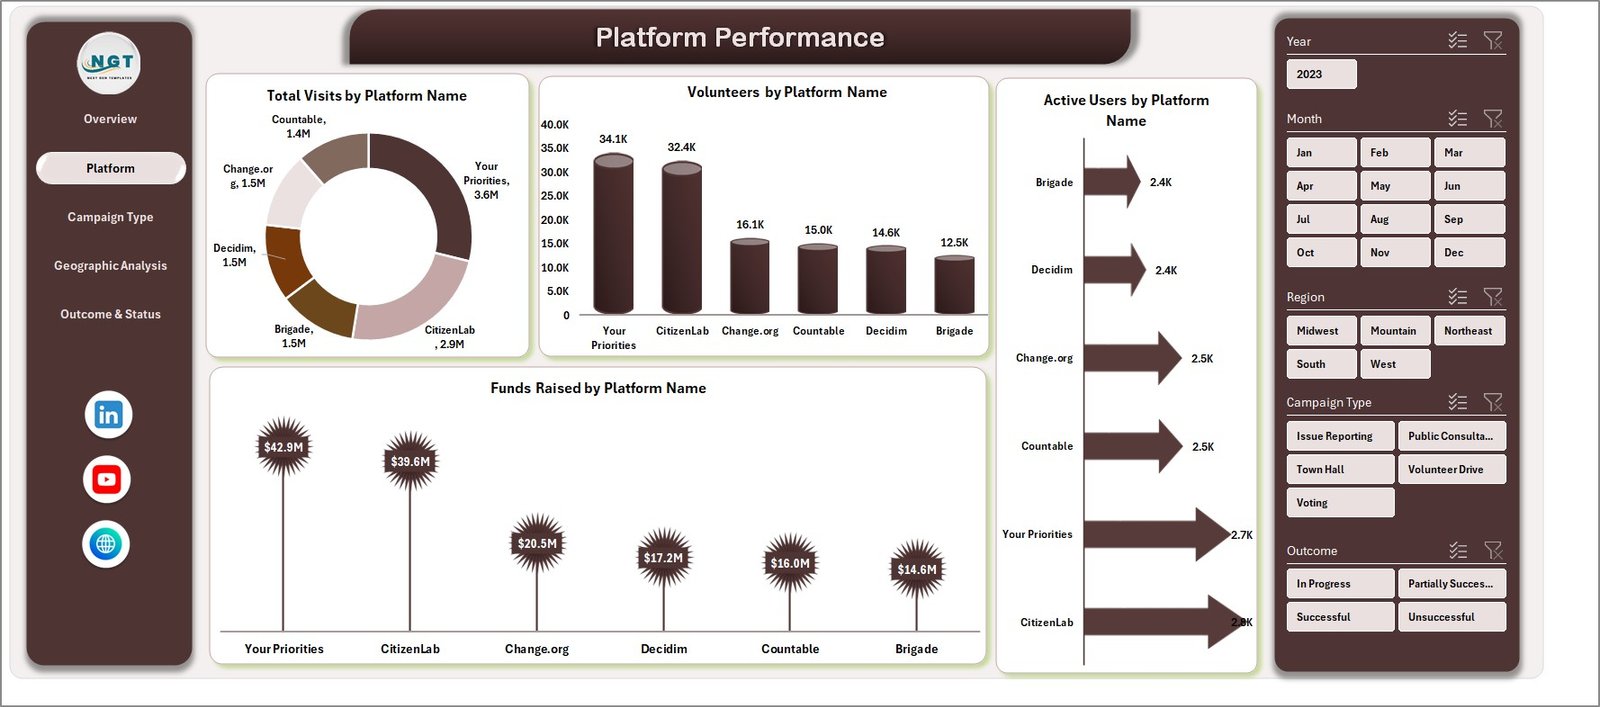
2. Platform Performance
This sheet tab offers detailed performance insights per platform.
- Total Visits by Platform Name: Analyze the number of visits each platform has received.
- Volunteers by Platform Name: Track volunteer counts associated with platforms for resource allocation.
- Active Users by Platform Name: Measure user activity levels per platform.
- Funds Raised by Platform Name: Monitor fundraising success across platforms.
Platform Performance
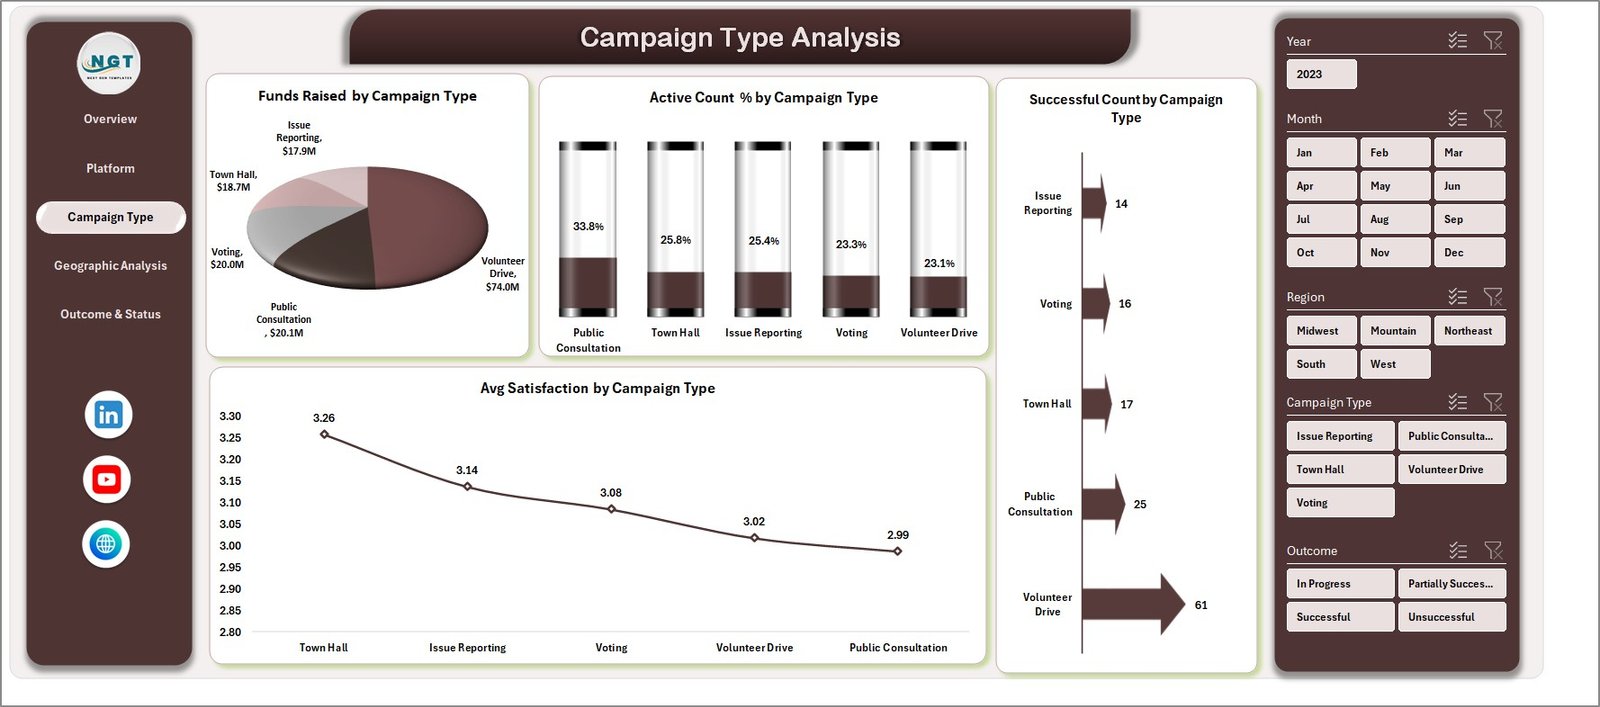
3. Campaign Type Analysis
This analysis tab gives deeper insights on campaigns to help evaluate effectiveness and satisfaction.
- Funds Raised by Campaign: Shows fundraising totals categorized by campaign types.
- Active Count % by Campaign: Percentage of active users involved in each campaign.
- Successful Count by Campaign: Number of campaigns marked as successful for assessing outcomes.
- Avg Satisfaction by Campaign: Measures user satisfaction averages helping improve future campaigns.
Campaign Type Analysis
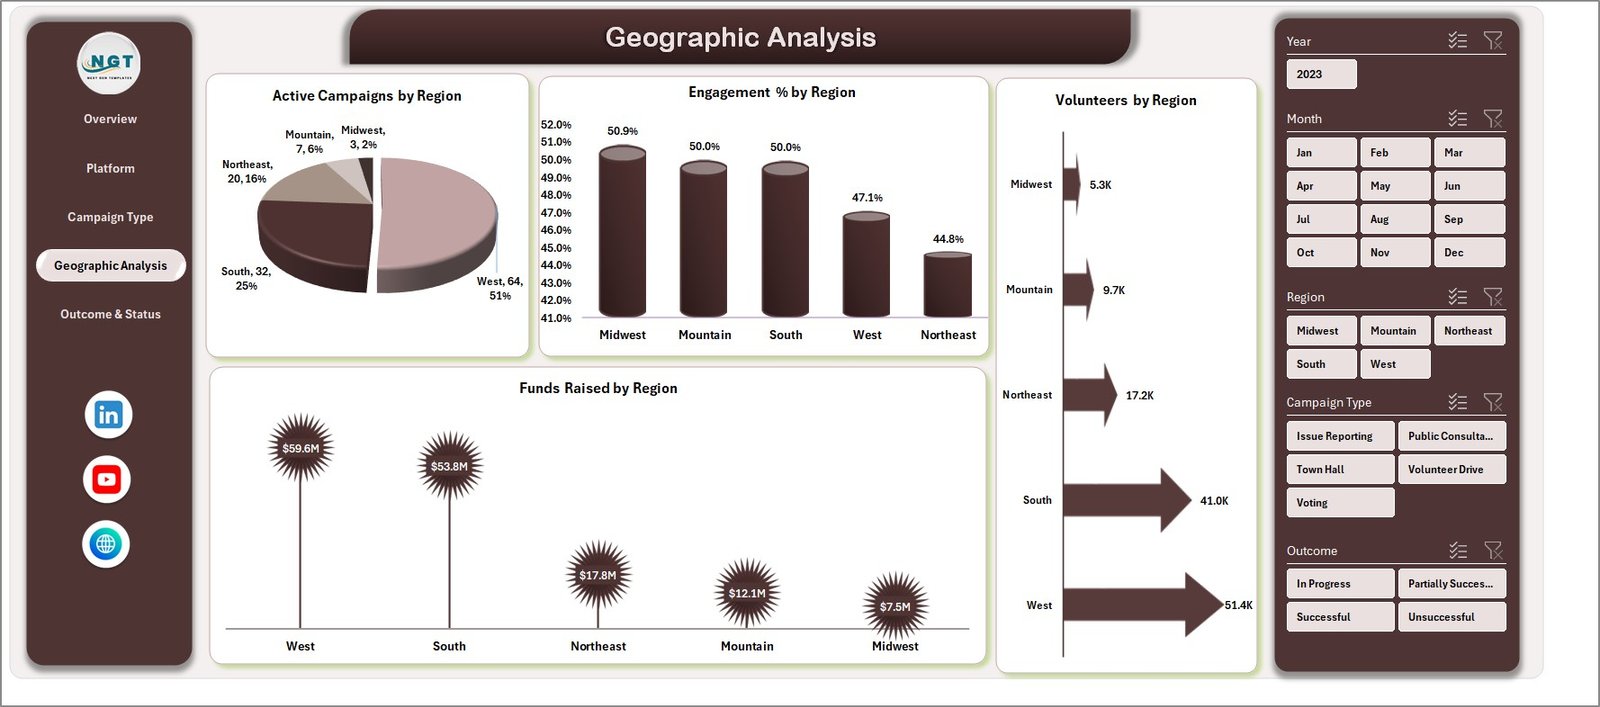
4. Geographic Analysis
Examine engagement and resource distribution across different regions.
- Active Campaigns by Region: Number of ongoing campaigns in each geographic area.
- Engagement % by Region: Engagement levels demonstrating regional participation.
- Volunteers by Region: Counts of volunteers available by location.
- Funds Raised by Region: Regional fundraising achievements visualized.
Geographic Analysis
5. Outcome & Status
This page helps track completion statuses and success rates over time.
- Completed Count by Month: Number of completed campaigns or activities each month.
- Total Visits by Month: Monthly visits trend to monitor user engagement.
- Successful Count %: Percentage of successful campaigns relative to total launched campaigns.
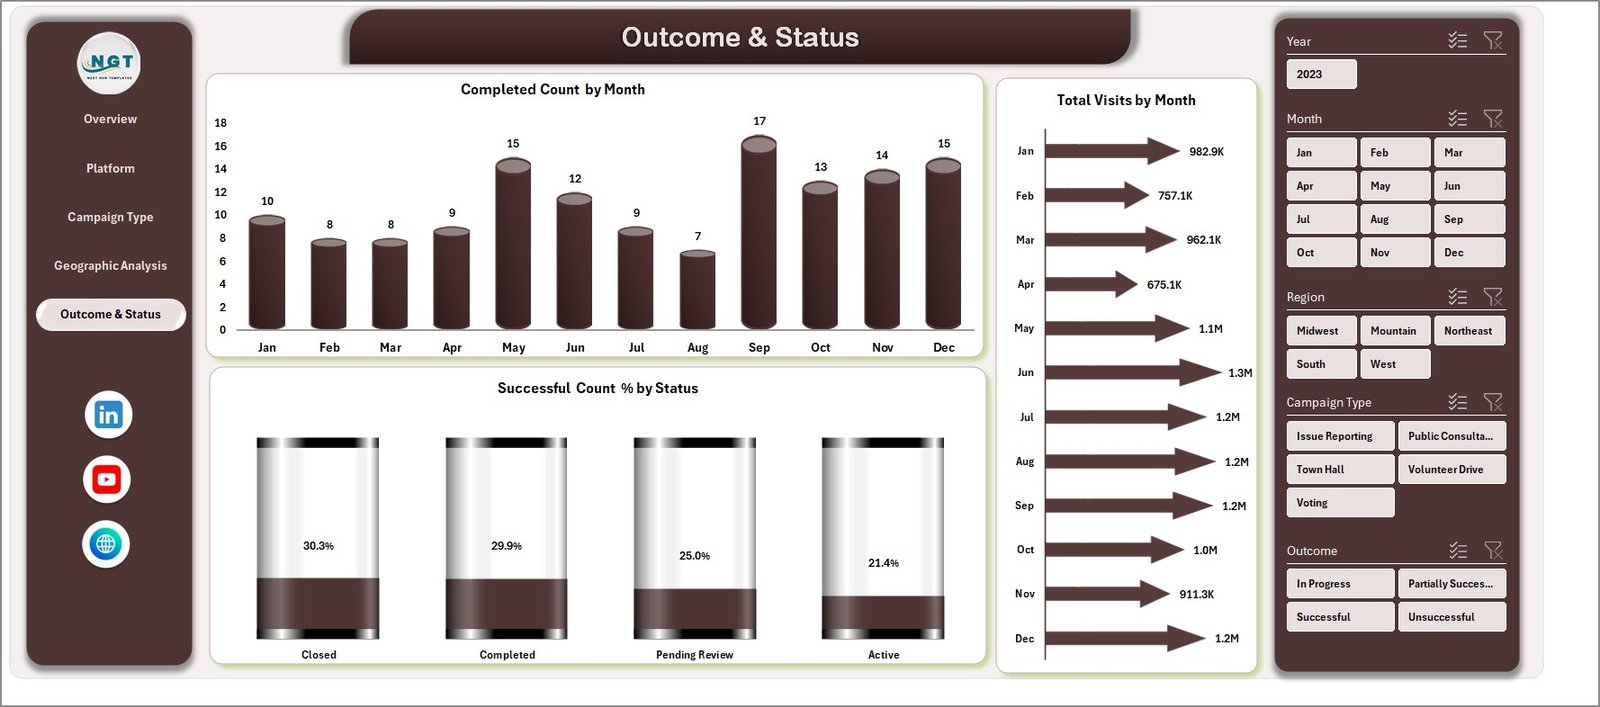
Outcome & Status
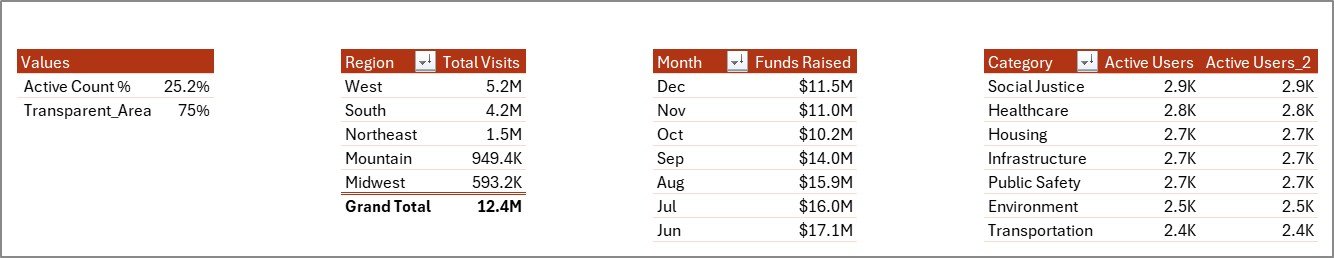
6. Data Sheet Tab
This is the master data sheet where all raw data is entered in a consistent format. Ensure data accuracy here to maintain dashboard integrity.

Data Sheet tab
7. Support Sheet
This hidden sheet contains pivot tables that power the dashboard’s dynamic charts and metrics. After updating the Data sheet, clicking ‘Refresh All’ under the Data tab instantly updates all dashboard elements.
Support sheet tab
Advantages of Civic Engagement Platforms Dashboard in Excel
- Easy to use: No coding needed-simply update data and refresh.
- Comprehensive insight: Multi-dimensional analysis across platforms, campaigns, geography, and outcomes.
- Time-saving: Automated reports eliminate manual chart making and repetitive tasks.
- Customizable: Add or modify filters, slicers, and charts as per your organizational needs.
- Wide accessibility: Excel format ensures compatibility across workplaces without specialized software.
Opportunities for Improvement
- Integrate Power BI for more advanced visualization and interactivity.
- Add automation scripts (VBA) for auto-refresh on file open.
- Include predictive analytics to forecast future engagement trends.
- Expand geographic mapping for detailed district or city-level insights.
- Enable collaboration via cloud versions like Excel Online.
Best Practices
- Maintain data cleanliness and consistency on the Data sheet to avoid errors.
- Refresh pivot tables frequently to ensure dashboard reflects latest data.
- Use slicers wisely to drill down without overwhelming the visuals.
- Back up your Excel file regularly to prevent data loss.
- Train team members on how to update the data and refresh the dashboard.
FAQs
Can I customize the dashboard to add more metrics?
Yes, you can add new pivot tables and charts to the Support sheet and link them to your dashboard for more KPIs.
Is it compatible with Excel versions other than Microsoft 365?
The dashboard is compatible with Excel 2016 and above, but some newer features might require Microsoft 365.
How often should I update the data sheet?
Update based on your data collection frequency – weekly or monthly is typical for most civic programs.
Can I share this dashboard with others?
Yes, but ensure they have compatible Excel versions to view and interact with slicers and refresh pivots.
Click to Purchases Civic Engagement Platforms Dashboard in Excel
Conclusion
The Civic Engagement Platforms Dashboard in Excel is an essential tool for organizations aiming to track, analyze, and enhance their civic engagement initiatives effectively. Its user-friendly interface combined with robust analytical capabilities makes it a perfect fit for both beginners and advanced Excel users. By leveraging this dashboard, you can easily monitor key metrics, streamline reporting, and make informed decisions to boost the impact of your campaigns.
Explore further resources and maximize your Excel skills with Microsoft Excel official support.
Visit our YouTube channel to watch the demo: Youtube.com/@NextGenTemplates