Civic Technology Startups Dashboard in Excel is a professionally designed, interactive analytics template that empowers civic tech entrepreneurs, government technology advisors, smart city project managers, and social impact investors to track revenue, grant funding, user adoption, government partnerships, and civic impact scores from a single, pivot-driven Excel workbook. Whether you are launching a citizen engagement platform, building open data tools, or managing a portfolio of civic innovation projects, this Civic Technology Startups Dashboard in Excel gives you the visual analytics and reporting power you need to make data-driven decisions.
Click to Purchases Civic Technology Startups Dashboard in Excel
Civic technology is transforming how governments interact with citizens, how public services are delivered, and how communities participate in democratic processes. From open data portals and digital voting platforms to smart city sensors and citizen feedback tools, the civic tech sector is growing rapidly. Managing this growth requires robust analytics, and that is exactly what this dashboard delivers. With five interactive dashboard pages, a structured data sheet, and a hidden support sheet packed with pivot tables, this template turns raw startup data into actionable insights in minutes.
Key Features of Civic Technology Startups Dashboard in Excel
This dashboard template comes loaded with powerful features designed to give you complete visibility into your civic technology startup operations:
- 5 Interactive Dashboard Pages — Overview, Financial Overview, Impact Analysis, Growth Tracking, and Regional Insights provide focused analytics from different perspectives, similar to other startup dashboards in Excel.
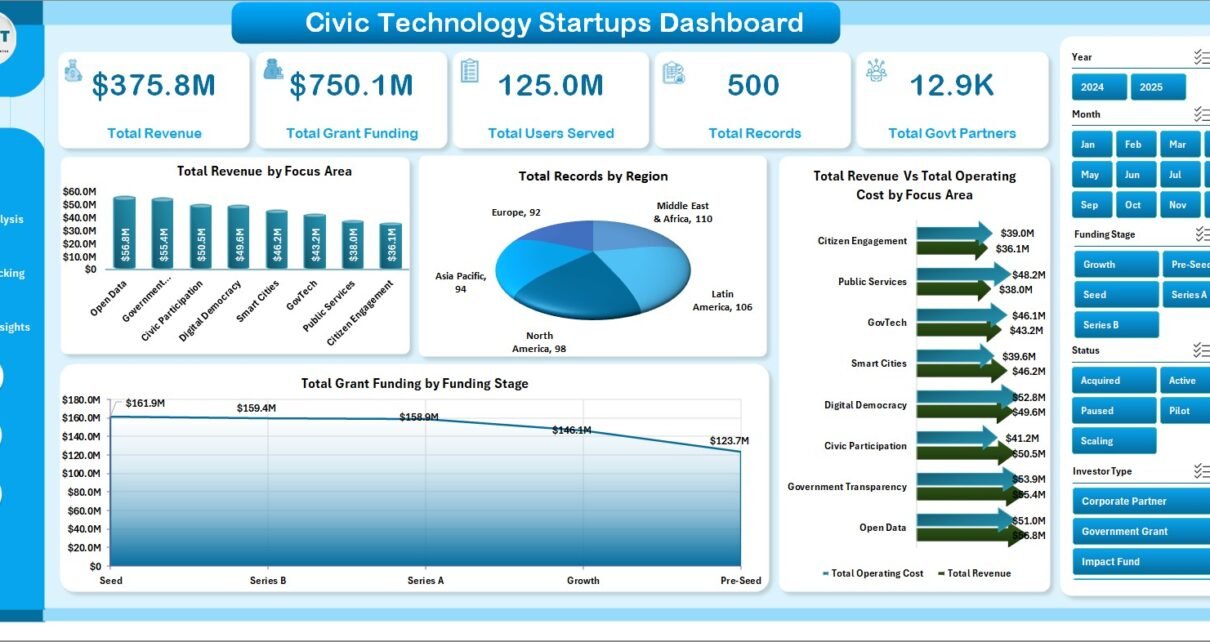
- High-Level KPI Cards — The Overview page displays five critical metrics at the top: Total Revenue, Total Grant Funding, Total Users Served, Total Records, and Total Govt Partners for instant executive-level visibility.
- Dynamic Pivot-Driven Engine — Every chart and KPI card across all five pages is powered by pivot tables in the Support sheet. A single click on Refresh All in the Data ribbon tab updates the entire dashboard after you modify the data.
- Interactive Slicer Filters — Multiple slicers on the Overview page let you filter the entire dashboard by focus area, region, funding stage, investor type, and other dimensions without touching any formulas.
- Revenue vs Operating Cost Comparison — Side-by-side financial analysis across focus areas and regions helps you identify profitability gaps and optimize budget allocation.
- Civic Impact Scoring — Track the Avg. Civic Impact Score by Focus Area and monitor government partnership growth by region to quantify the social value your startups are delivering.
- Monthly Trend Analysis — Revenue by Month, Users Served by Month, and Operating Cost by Month charts let you spot seasonal patterns and growth trajectories.
- Growth and Funding Tracking — Visualize Total Grant Funding by Year, Active Rate % by Focus Area, and Total Records by Status to monitor your pipeline health.
Dashboard Pages Explanation
1. Overview Page
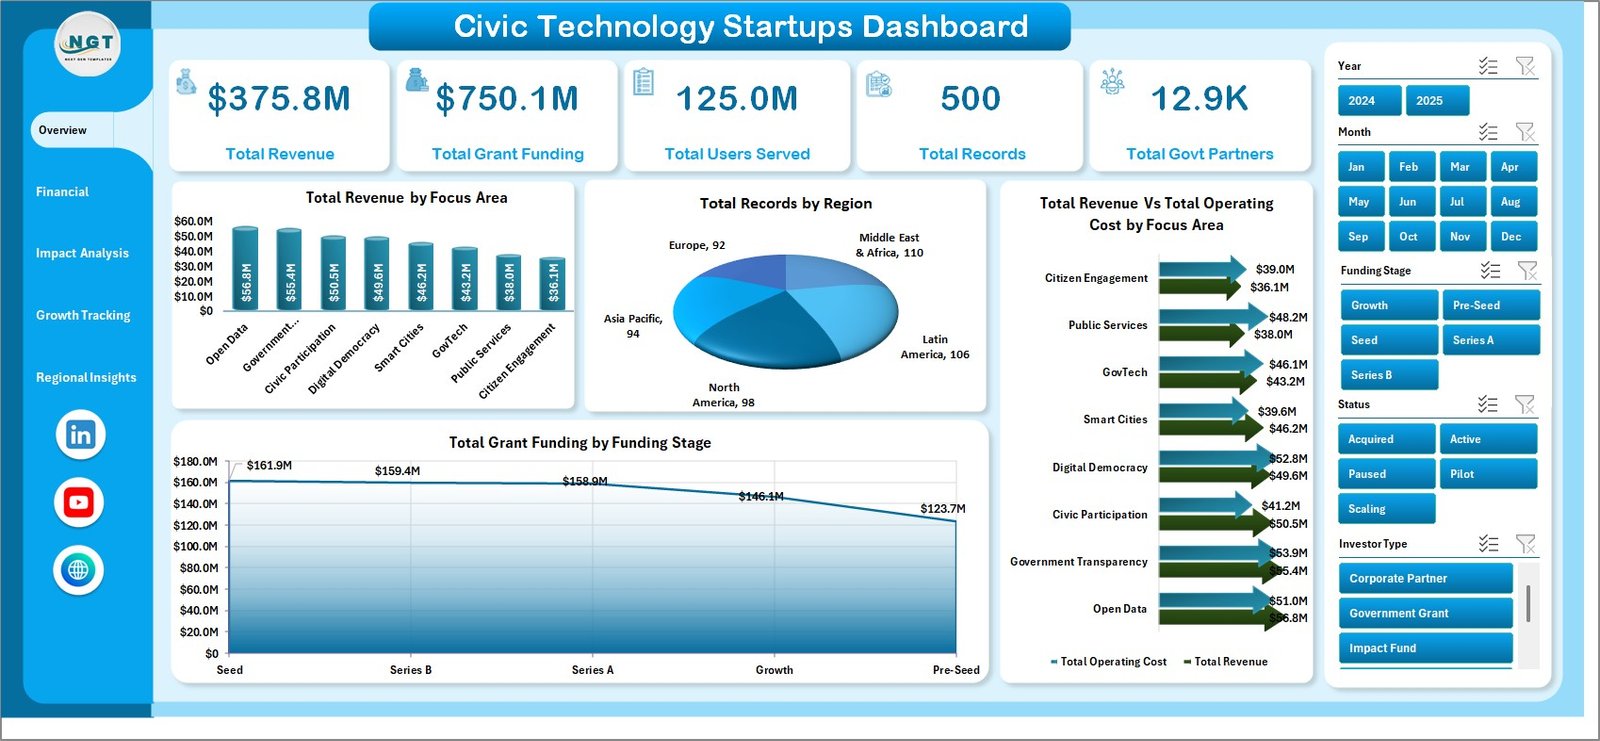
The Overview page is the command center of this Civic Technology Startups Dashboard in Excel. At the top, you will find five high-level KPI cards that display Total Revenue, Total Grant Funding, Total Users Served, Total Records, and Total Govt Partners. These cards give you an instant snapshot of your entire civic tech portfolio performance without scrolling or clicking.
Below the KPI cards, the page features four analytical charts. Total Revenue by Focus Area breaks down your earnings across different civic technology verticals like open data, citizen engagement, and smart city infrastructure. Total Records by Region shows how your startup records are distributed geographically. Total Revenue Vs Total Operating Cost by Focus Area provides a profitability comparison that highlights which focus areas are most cost-efficient. Total Grant Funding by Funding Stage reveals how your grant money is allocated across seed, growth, and mature funding stages. Multiple slicers are included on this page so you can filter the entire dashboard by any dimension instantly.
Civic Technology Startups Dashboard
2. Financial Overview Page
The Financial Overview page dives deeper into the monetary performance of your civic technology startups. This page features four targeted financial charts. Total Revenue by Investor Type shows which investor categories — angel investors, venture capital, government grants, or impact funds — are contributing the most to your revenue streams. Total Revenue Vs Total Operating Cost by Region compares profitability across geographic markets to identify your strongest and weakest regions financially.
Total Users Served by Focus Area reveals which civic tech verticals are attracting the largest user bases, which is critical for measuring product-market fit and community adoption. Total Revenue by Funding Stage helps you understand how revenue correlates with startup maturity, showing whether early-stage or late-stage ventures are generating more income. This page is essential for CFOs, investors, and financial planners working with startup analytics dashboards.
Click to Purchases Civic Technology Startups Dashboard in Excel
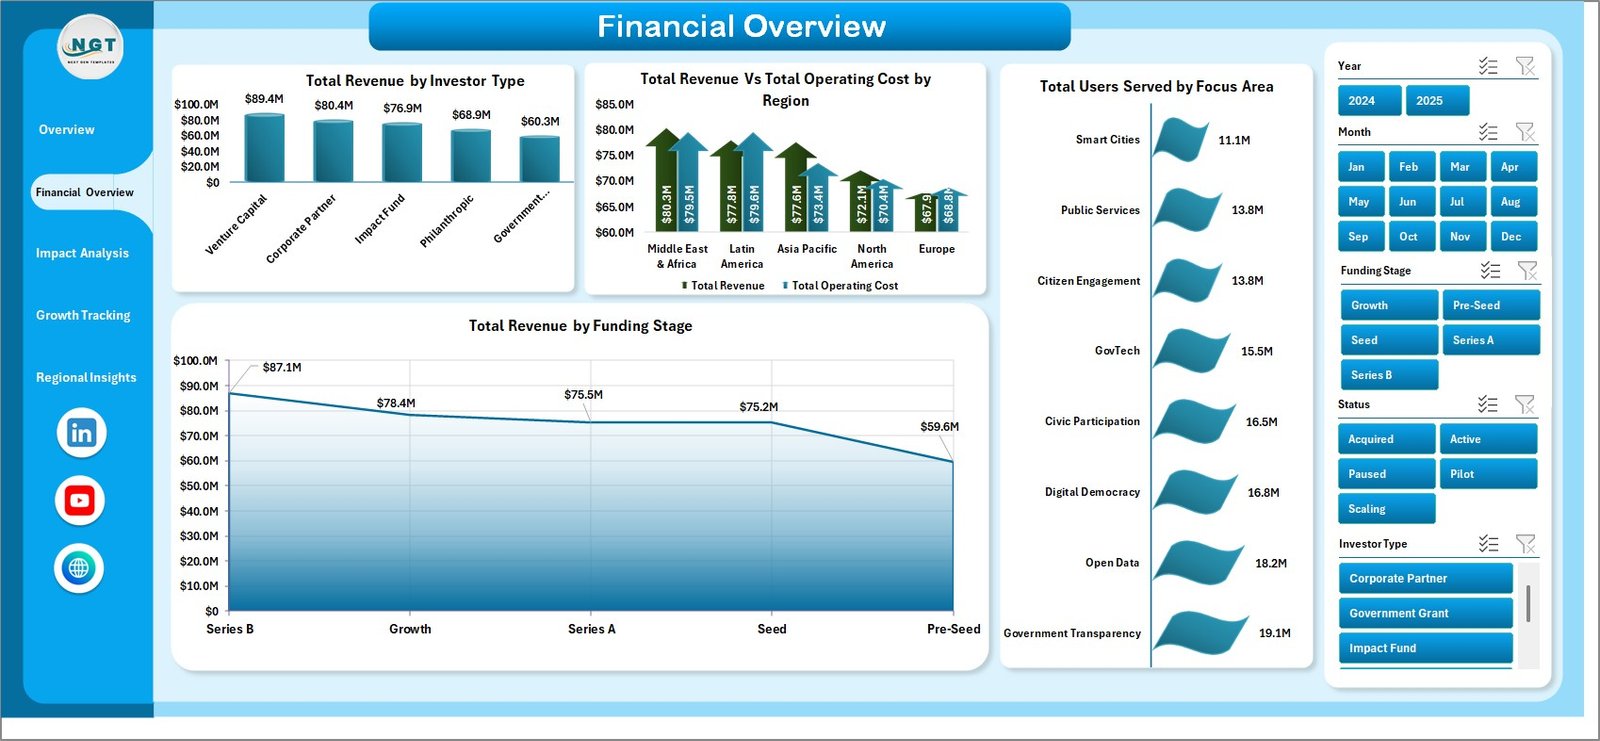
Financial Overview
3. Impact Analysis Page
The Impact Analysis page is where you measure the social and civic value your technology startups are creating. This page features four impact-focused charts. Total Govt Partners by Region shows how many government partnerships your startups have secured across different geographic areas, which is a key indicator of institutional trust and scalability. Avg. Civic Impact Score by Focus Area provides a quantified measure of the social good each civic technology vertical is delivering.
Total Revenue by Month and Total Users Served by Month provide time-series views that let you track monthly growth patterns, identify seasonal trends, and forecast future performance. This page is particularly valuable for impact investors, grant committees, and government agencies who need to evaluate the social return on investment of civic technology initiatives.
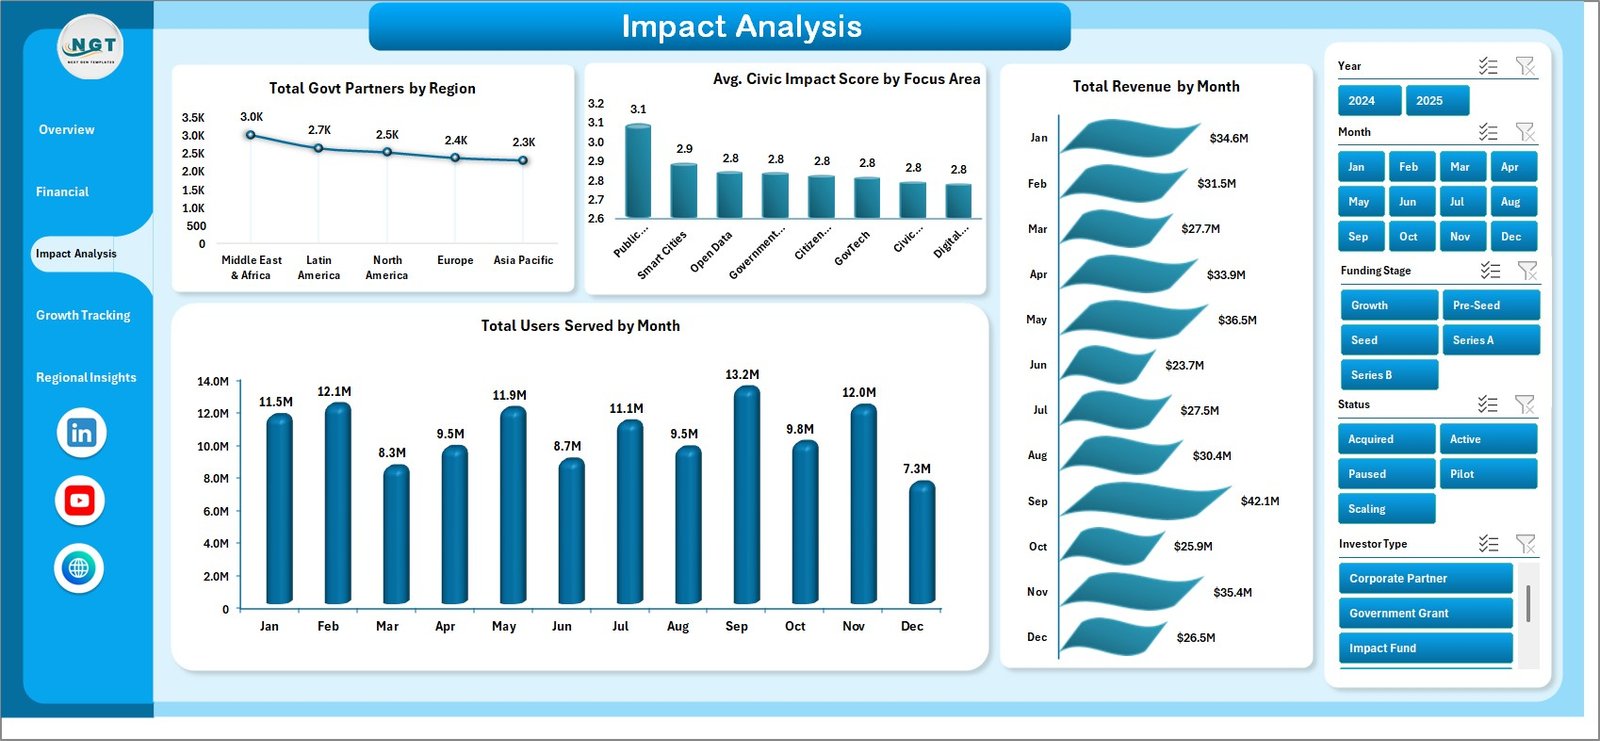
Impact Analysis
4. Growth Tracking Page
The Growth Tracking page focuses on the expansion and pipeline health of your civic technology startup portfolio. Total Grant Funding by Year shows the year-over-year growth in grant money secured, helping you evaluate whether your fundraising efforts are scaling. Total Records by Status breaks down your startup records into categories like Active, Inactive, Pipeline, and Closed, giving you visibility into portfolio health.
Total Grant Funding by Region highlights which geographic markets are attracting the most funding, guiding your regional expansion strategy. Active Rate % by Focus Area reveals the percentage of active startups in each civic tech vertical, helping you identify which focus areas have the highest sustainability and which may need intervention. This kind of growth tracking is similar to what you would find in a technology startup growth dashboard.
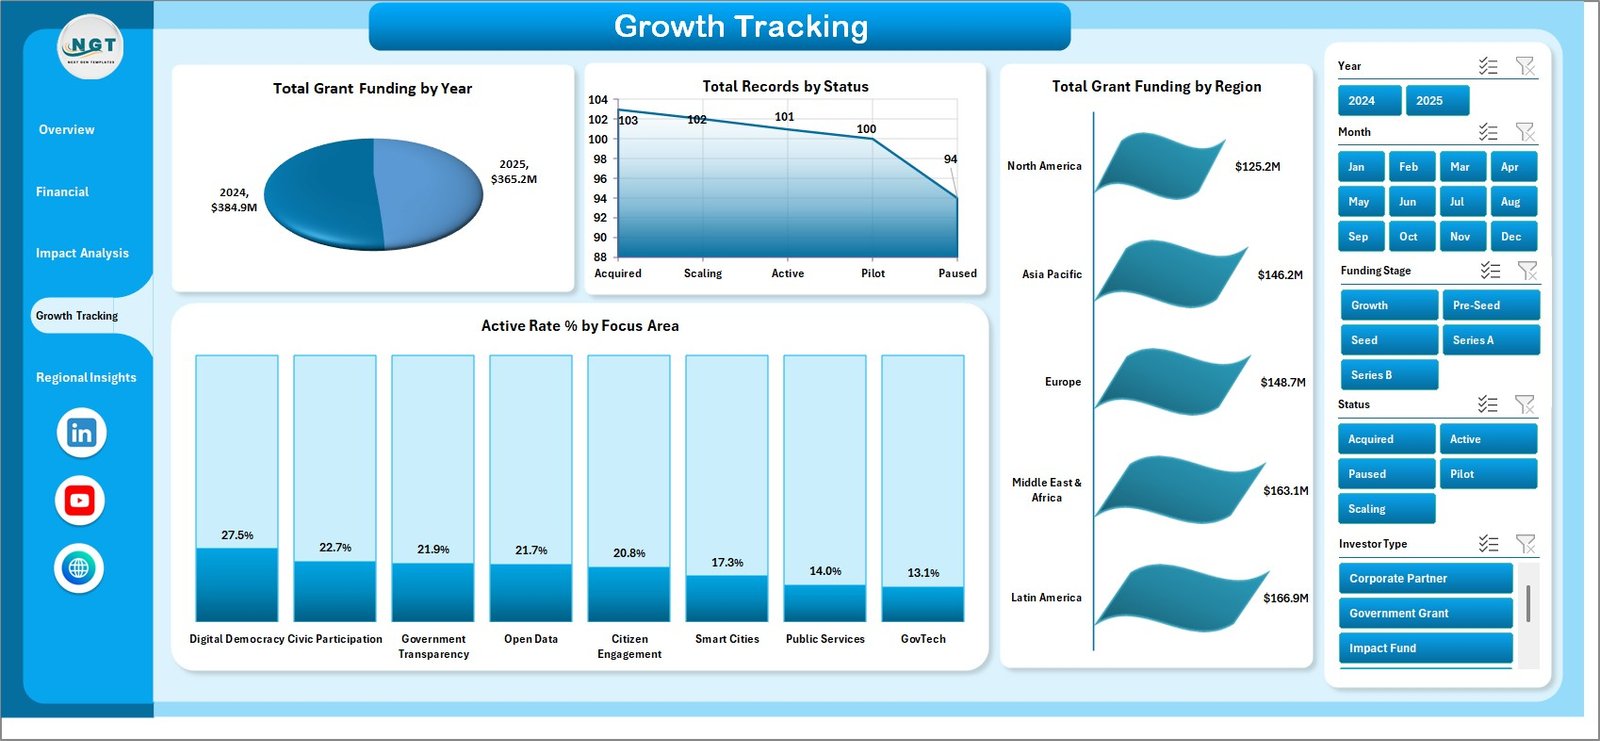
Growth Tracking
5. Regional Insights Page
The Regional Insights page provides a geographic lens on your civic technology startup data. Total Users Served by Region shows which areas have the highest citizen adoption and engagement with your civic tech platforms. Total Records by Investor Type breaks down your portfolio by the types of investors backing startups in each region, helping you understand the investment landscape.
Total Operating Cost by Month reveals cost trends over time, enabling you to forecast future expenditures and manage cash flow effectively. Total Operating Cost by Investor Type shows how operating costs vary depending on the type of investor, which is useful for understanding cost structures across different technology ventures. Together, these charts provide a comprehensive regional strategy view.
Click to Purchases Civic Technology Startups Dashboard in Excel
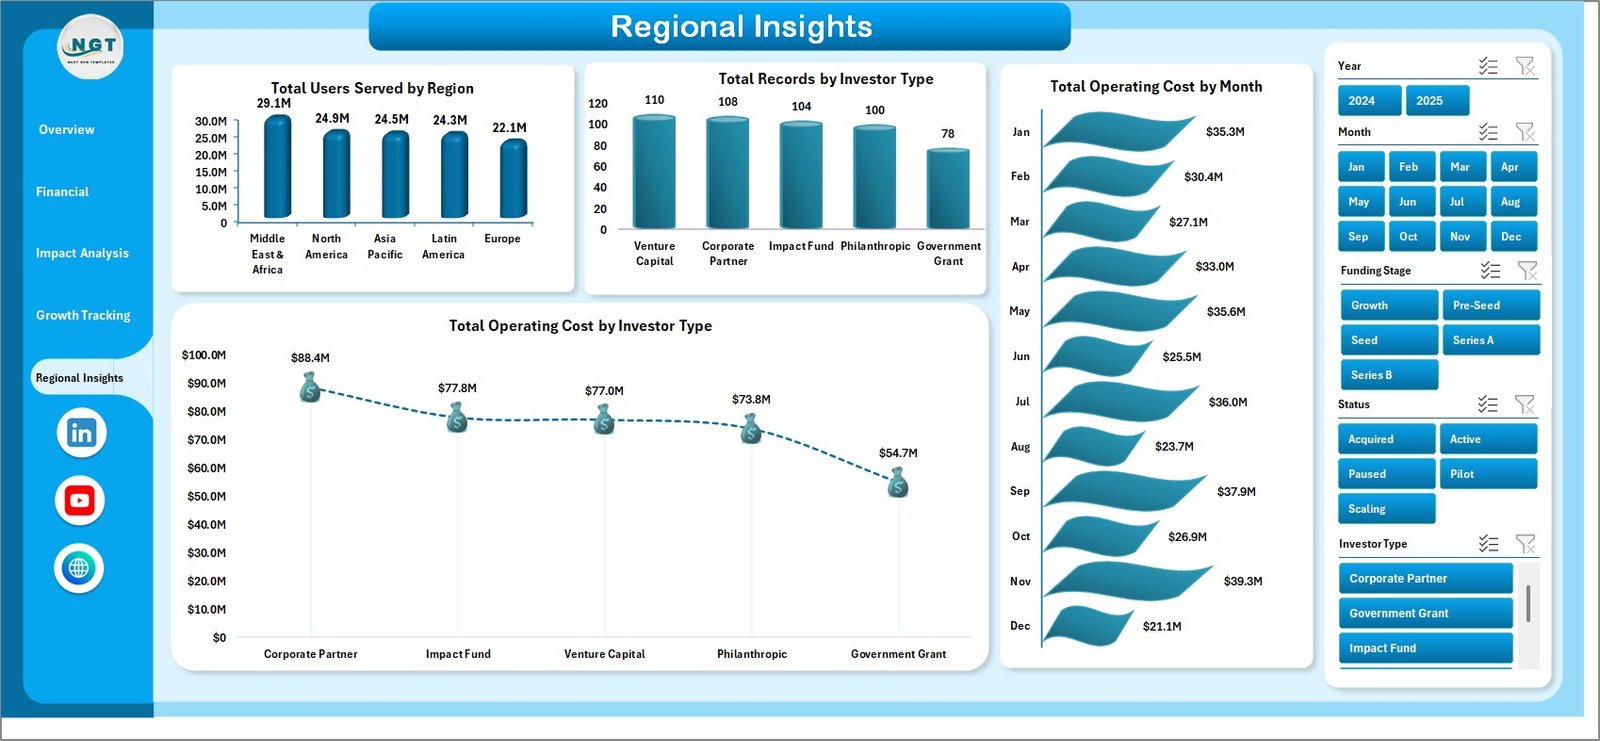
Regional Insights
6. Data Sheet
The Data sheet is the central input hub of this dashboard. This is where you enter all your civic technology startup records in a structured tabular format. Each row represents a single record and includes fields like startup name, region, focus area, funding stage, investor type, revenue, operating cost, grant funding, users served, government partners, civic impact score, and status. Every chart, KPI card, and pivot table across all five dashboard pages draws its data from this sheet. Simply enter your data in the correct columns and refresh the dashboard to see instant updates.
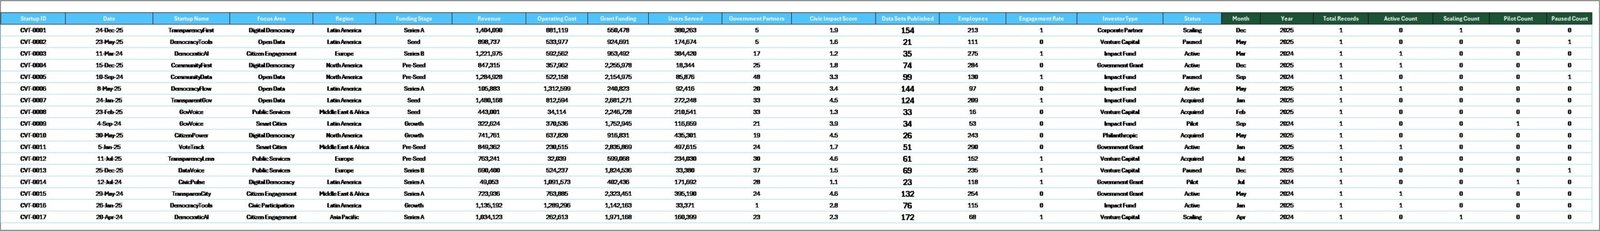
Data Sheet Tab
7. Support Sheet
The Support sheet is the backbone of this dashboard. It contains all the pivot tables that power every chart and KPI card across the five dashboard pages. After updating your data in the Data sheet, navigate to the Data tab in the Excel Ribbon and click Refresh All. All pivot tables will recalculate, and every chart across all pages will update automatically. For a cleaner user experience, you can hide this sheet after your initial setup. The pivot-driven architecture means you never need to write or modify any formulas — the dashboard maintains itself dynamically.
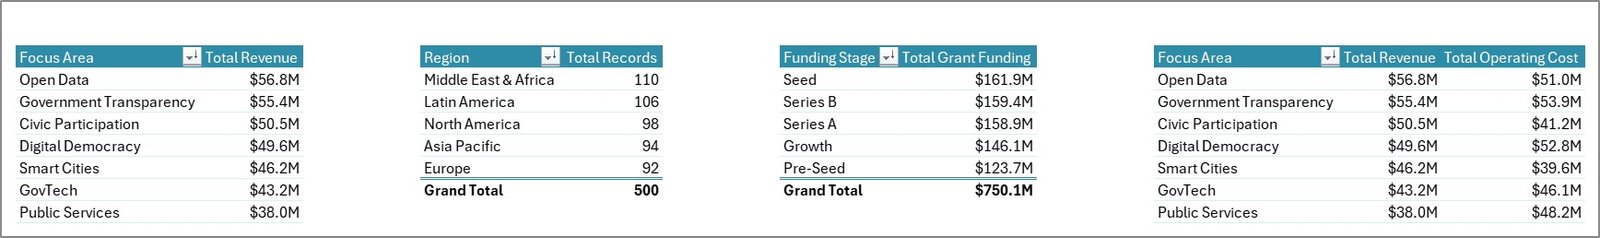
Support Sheet Tab
Advantages of Civic Technology Startups Dashboard in Excel
- Instant Executive Visibility — KPI cards and multi-page charts give stakeholders a complete picture of civic tech performance without manual calculations.
- Zero Formula Maintenance — Pivot tables handle all data aggregation, so you never need to write or debug complex formulas.
- Flexible Filtering — Interactive slicers let you slice and dice data by any dimension for targeted analysis.
- Professional Presentation Ready — Clean, well-designed pages can be printed or shared directly with investors, government partners, and board members.
- Scalable Architecture — Add hundreds or thousands of records to the Data sheet, refresh, and the dashboard scales seamlessly.
- Works in Any Excel Version — Compatible with Microsoft Excel 2016, 2019, 2021, and Microsoft 365 with full pivot table and slicer support.
Opportunities for Improvement
- Conditional Formatting Alerts — You can add conditional formatting rules to flag metrics that exceed or fall below target thresholds for faster anomaly detection.
- Additional Data Fields — Consider adding fields like Employee Count, Time to Market, and Customer Satisfaction Score to enrich your analysis.
- Drill-Down Sub-Pages — Advanced users can create additional pivot charts that drill into specific focus areas or regions for granular reporting.
- Dashboard Automation with VBA — Power users can add VBA macros to auto-refresh pivots on file open or schedule data imports from external sources.
- Integration with Power BI — For organizations needing cloud-based sharing, this data structure can be easily imported into Power BI for interactive web dashboards.
Best Practices for Using This Dashboard
- Keep Data Consistent — Always follow the existing column format in the Data sheet to ensure pivot tables aggregate data correctly.
- Refresh After Every Update — After entering or modifying data, always click Refresh All in the Data ribbon tab to update all charts and KPIs.
- Use Slicers Strategically — Combine multiple slicer selections to create focused views for specific presentations or reports.
- Back Up Regularly — Save dated copies of your workbook before making large data updates to preserve historical versions.
- Hide the Support Sheet — Keep the Support sheet hidden during presentations to maintain a clean, professional appearance.
- Review Monthly — Schedule a monthly review session to update data, analyze trends, and share insights with your team and stakeholders.
- Click to Purchases Civic Technology Startups Dashboard in Excel
Explore Relevant Templates
If you found this Civic Technology Startups Dashboard in Excel useful, explore these related templates that can complement your analytics toolkit:
- Circular Economy Startups Dashboard in Excel — Track sustainability-focused startup metrics with a similar five-page pivot-driven layout.
- Board Game Startups Dashboard in Excel — Analyze entertainment startup portfolios with revenue, cost, and customer rating analytics.
- Cargo Drone Startups Dashboard in Excel — Monitor drone logistics startup performance across regions and funding stages.
- Border Security Tech Dashboard in Excel — Track technology deployment and operational metrics for security-focused ventures.
- API Development Dashboard in Excel — Analyze API development project performance, costs, and developer adoption metrics.
Frequently Asked Questions
What is a Civic Technology Startups Dashboard in Excel?
A Civic Technology Startups Dashboard in Excel is a pre-built analytics template that uses pivot tables, charts, and slicers to visualize key performance metrics for civic tech companies — including revenue, grant funding, user adoption, government partnerships, and civic impact scores — all within a single Excel workbook.
How do I update the dashboard with my own data?
Simply navigate to the Data sheet, enter your civic technology startup records following the existing column format, then go to the Data tab in the Excel Ribbon and click Refresh All. Every chart and KPI card across all five pages will update instantly.
Which version of Excel do I need?
This dashboard works with Microsoft Excel 2016, 2019, 2021, and Microsoft 365. You need a version that supports pivot tables and slicers for full functionality.
Can I add more data fields to the dashboard?
Yes. You can add new columns to the Data sheet and create additional pivot tables in the Support sheet to generate new charts. The pivot-driven architecture makes it easy to extend without breaking existing visualizations.
Is this dashboard suitable for government agencies?
Absolutely. Government technology offices, public innovation labs, and municipal IT departments can use this dashboard to monitor civic tech vendor performance, grant utilization, and citizen engagement metrics across multiple programs and regions.
Can I customize the charts and colors?
Yes. All charts in this dashboard are standard Excel charts that can be customized using the built-in chart formatting tools. You can change colors, chart types, fonts, and layout to match your organizational branding.
Conclusion
The Civic Technology Startups Dashboard in Excel is a powerful, ready-to-use analytics template that transforms raw civic tech startup data into professional, interactive visualizations. With five dedicated dashboard pages, dynamic pivot tables, interactive slicers, and comprehensive KPI cards, this template gives civic tech founders, government advisors, and impact investors everything they need to monitor performance, track growth, and make data-driven decisions. Download it today and start analyzing your civic technology startup portfolio like a pro.
For step-by-step tutorials on how to use Excel dashboards effectively, visit our YouTube channel: Youtube.com/@PK-AnExcelExpert
Click to Purchases Civic Technology Startups Dashboard in Excel