Civic Technology Startups Dashboard in Power BI is a professionally designed, ready-to-use analytics template built specifically for civic tech innovators, government partners, startup accelerators, and impact investors. The civic technology sector is evolving rapidly, and organizations need reliable, centralized reporting tools to make data-driven decisions. This Power BI dashboard consolidates key performance data — including revenue, operating costs, grant funding, civic impact scores, user statistics, and regional breakdowns — into 5 interactive pages that are easy to navigate, filter, and share with stakeholders.
Click to Purchases Civic Technology Startups Dashboard in Power BI
Whether you manage a portfolio of civic tech ventures, run a government innovation lab, or operate a startup focused on digital public services, this Civic Technology Startups Dashboard in Power BI saves you hours of manual reporting and helps you communicate performance clearly. Simply connect your Excel data, refresh the dashboard, and start exploring insights immediately.
Key Features of Civic Technology Startups Dashboard in Power BI
This Power BI civic tech dashboard comes loaded with features designed for comprehensive startup analytics:
- 5 Purpose-Built Dashboard Pages — Overview, Financial Overview, Impact Analysis, Growth Tracking, and Regional Insights provide a full 360-degree view of your civic technology ecosystem.
- Dynamic KPI Summary Cards — The Overview page displays Total Records, Revenue, Operating Cost, Users Served, and Grant Funding as high-level summary cards for quick performance monitoring.
- Multi-Dimensional Slicers — Filter across Focus Area, Region, Funding Stage, Investor Type, and Month Name to drill down into specific segments instantly.
- Revenue and Cost Comparisons — Side-by-side analysis of Revenue and Operating Cost by Focus Area and by Region enables smarter budget allocation.
- Civic Impact Measurement — Dedicated metrics for Civic Impact Score and Government Partners help quantify real-world outcomes beyond financial metrics.
- Growth and Pipeline Tracking — Monitor Total Records by Status and Grant Funding distribution across regions to identify expansion opportunities.
- Plug-and-Play Architecture — Replace the sample data with your own Excel file and the entire dashboard updates automatically.
- Publication Ready — Publish to Power BI Service for team-wide access, embedding in SharePoint, or sharing via secure links.
- Click to Purchases Civic Technology Startups Dashboard in Power BI
Dashboard Pages Explanation
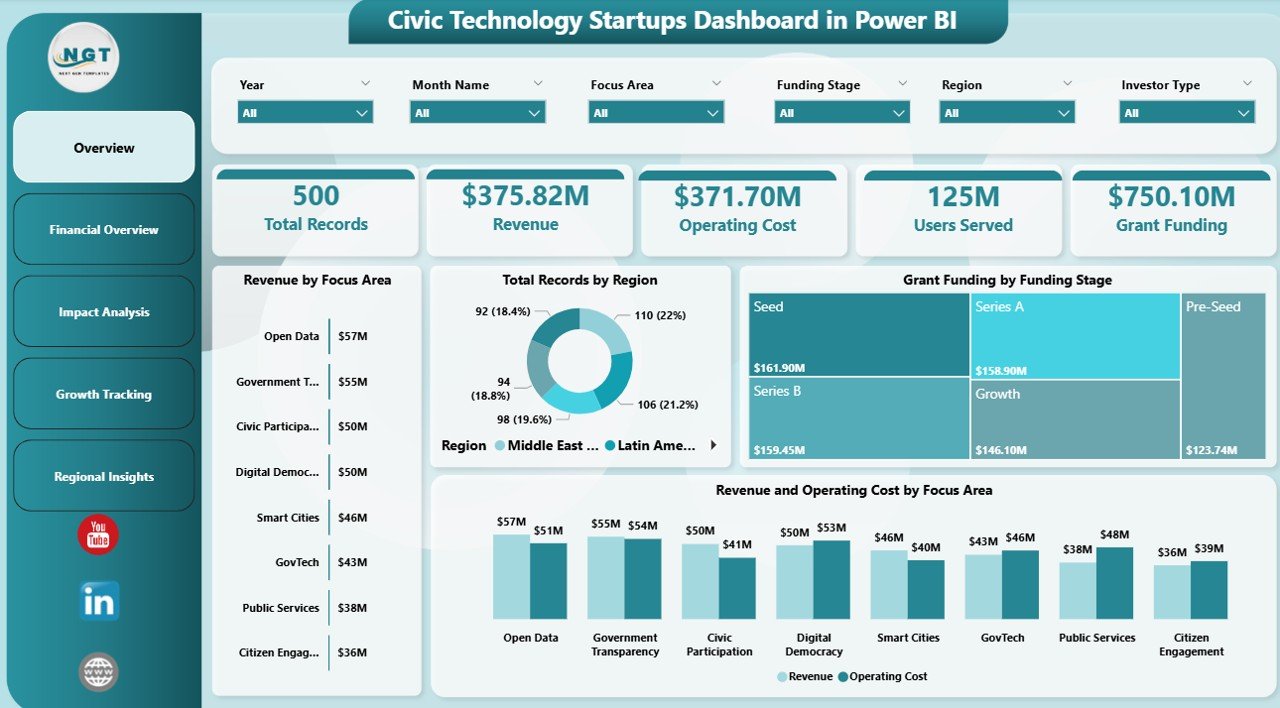
1. Overview Page
The Overview page is your command center. At the top, five KPI cards display the most important high-level metrics: Total Records, Revenue, Operating Cost, Users Served, and Grant Funding. These cards update dynamically based on slicer selections, giving you an instant pulse check on the entire civic tech portfolio.
Below the cards, several analytical visualizations provide deeper context. Revenue by Focus Area breaks down income streams across different civic technology verticals. Total Records by Region shows geographic distribution of your startups. Grant Funding by Funding Stage reveals how funding flows across seed, early, growth, and mature stages. Revenue and Operating Cost by Focus Area compares revenue against expenses to highlight profitability by vertical. Multiple slicers on the page let you filter all visuals simultaneously for fast, focused analysis.
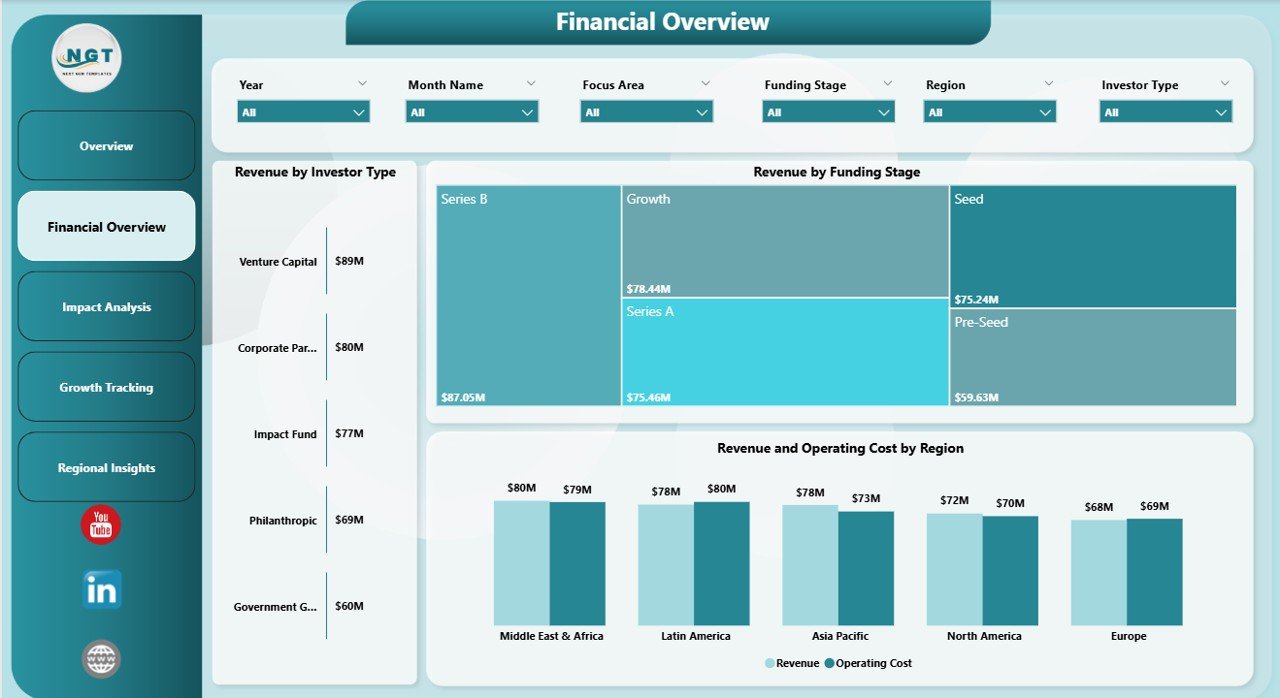
Civic Technology Startups Dashboard in Power BI2. Financial Overview
The Financial Overview page dives deeper into the money side of your civic tech operations. Revenue by Investor Type shows which investor categories — angel, venture capital, government grants, corporate partnerships — contribute the most to your revenue base. Revenue by Funding Stage helps you understand how revenue correlates with startup maturity. Revenue and Operating Cost by Region presents a geographic comparison that helps leadership allocate resources where they generate the most return.
 Financial Overview
3. Impact Analysis
Impact Analysis is what sets a civic tech dashboard apart from a standard business template. Civic Impact Score by Focus Area quantifies the social and community value generated across different technology verticals. Government Partners by Region maps out public-sector collaboration across geographies. Revenue by Month Name adds a temporal dimension so you can spot seasonal patterns and plan accordingly. Together, these charts help you tell a compelling impact story to donors, government agencies, and community stakeholders.
Click to Purchases Civic Technology Startups Dashboard in Power BI
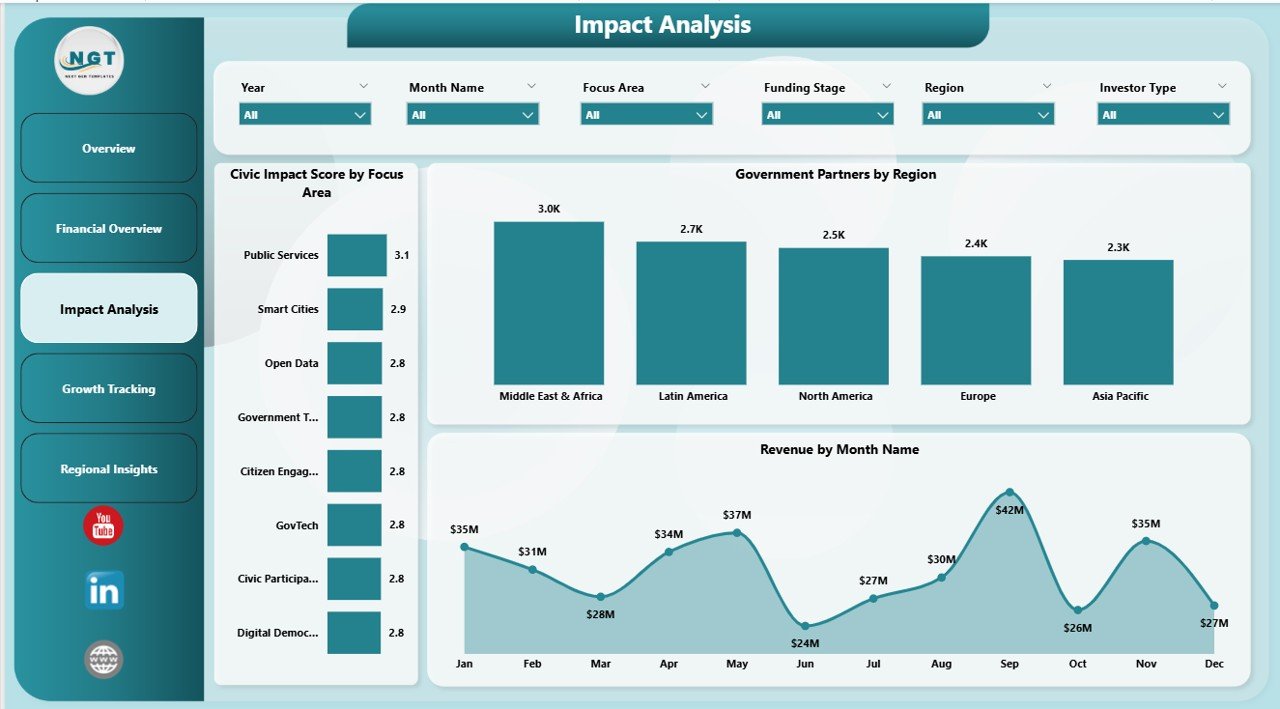 Impact Analysis
4. Growth Tracking
The Growth Tracking page helps you monitor how your civic tech startup portfolio is expanding. Total Records by Status segments startups into active, inactive, pipeline, and completed categories so you can see pipeline health at a glance. Grant Funding by Region reveals which geographic areas attract the most funding. Government Partners by Month Name tracks partnership momentum over time, helping you identify periods of acceleration or slowdown in public-sector engagement.
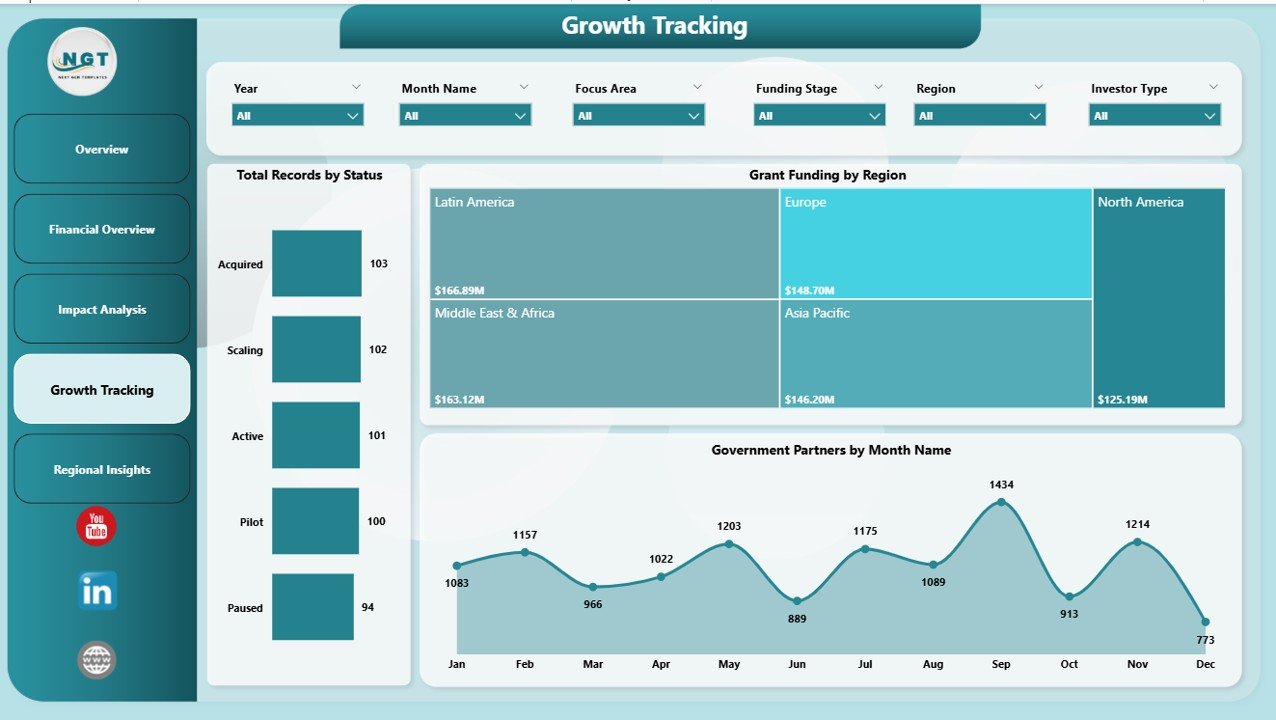 Growth Tracking
5. Regional Insights
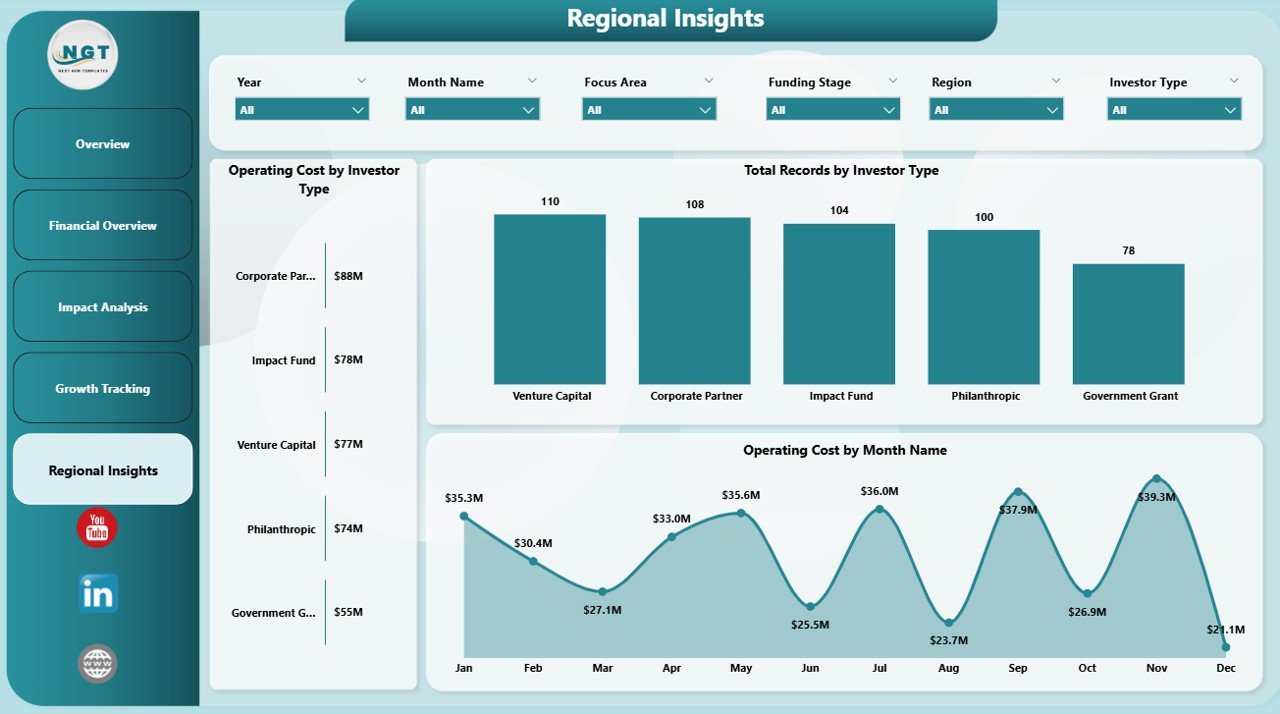
Regional Insights takes a geographic lens to operational efficiency. Operating Cost by Investor Type shows how different investor categories influence cost structures across regions. Total Records by Investor Type reveals investor concentration patterns. Operating Cost by Month Name uncovers temporal cost trends that can inform quarterly budgeting and resource planning. This page is essential for organizations operating across multiple cities, states, or countries.
Click to Purchases Civic Technology Startups Dashboard in Power BI
 Regional Insights
Advantages of Civic Technology Startups Dashboard in Power BI
- Saves Hours of Manual Reporting — Consolidate civic tech performance data into a single, auto-updating dashboard instead of maintaining multiple spreadsheets.
- Improves Decision-Making — Interactive slicers and cross-filtered visuals allow leadership to explore data from any angle without waiting for analyst support.
- Enhances Stakeholder Communication — Share polished, interactive reports with government partners, investors, and board members via Power BI Service links.
- Scales with Your Portfolio — Whether you track 10 startups or 500, the dashboard architecture handles growing data volumes seamlessly.
- Measures What Matters — Civic Impact Scores and Government Partner metrics go beyond financials to capture the real-world value civic tech delivers.
If you are also exploring similar analytics for other startup sectors, check out the Board Game Startups Dashboard in Power BI or the Circular Economy Startups Dashboard in Power BI for comparable structures tailored to different industries.
Opportunities for Improvement
- Custom DAX Measures — Power users can add advanced DAX calculations for metrics like Revenue Per User, Grant Conversion Rate, or Cost-to-Impact Ratio.
- Automated Data Refresh — Connecting to SharePoint or OneDrive enables scheduled refreshes without manual file updates.
- Bookmarks and Drill-Through Pages — Adding bookmarks or drill-through pages can create executive summary views and detailed startup profiles for deeper exploration.
- Row-Level Security — Implementing RLS allows different stakeholders to see only the data relevant to their region or portfolio.
- AI Visuals — Power BI’s built-in AI features like Key Influencers and Decomposition Tree could reveal hidden drivers behind civic impact scores.
Best Practices for Using This Dashboard
- Keep Data Updated Monthly — Regular data refreshes ensure KPIs reflect current performance, especially for fast-moving startup metrics.
- Start with the Overview — Use the Overview page for high-level monitoring, then navigate to specialized pages for deep dives into finances, impact, growth, or regional performance.
- Use Slicers Strategically — Combine multiple slicer selections to isolate specific segments, such as early-stage startups in a particular region with government funding.
- Share with Stakeholders — Publish to Power BI Service and schedule email subscriptions so key stakeholders receive automated updates.
- Customize to Your Needs — The dashboard is fully editable in Power BI Desktop. Add, remove, or rearrange visuals to match your reporting requirements. Refer to Microsoft Power BI documentation for advanced customization guidance.
Explore Relevant Templates
Looking for more ready-to-use Power BI dashboard templates? Explore these popular options from NextGenTemplates:
- Civic Technology Startups Dashboard in Excel — The Excel version of this same civic tech analytics template for users who prefer spreadsheet-based reporting.
- Board Game Startups Dashboard in Power BI — Track startup performance in the gaming and entertainment industry with a similar multi-page layout.
- Circular Economy Startups Dashboard in Power BI — Analyze sustainability-focused startups with dedicated circular economy KPIs.
- Border Security Tech Dashboard in Excel — Government technology analytics focused on border security and defense operations.
Click here to Purchase Civic Technology Startups Dashboard in Power BI
Frequently Asked Questions
What software do I need to use this dashboard?
You need Microsoft Power BI Desktop, which is free to download from Microsoft. To share reports online, you will need a Power BI Pro or Premium license.
Can I replace the sample data with my own data?
Yes. The dashboard is connected to an Excel data source. Simply update the file path in Power BI’s Transform Data editor to point to your own Excel file and click Refresh.
How many startups can this dashboard track?
There is no hard limit. Power BI handles large datasets efficiently, so you can track dozens or hundreds of civic tech startups without performance issues.
Can I customize the charts and visuals?
Absolutely. Open the .pbix file in Power BI Desktop and you can modify any visual, add new pages, change colors, or create custom DAX measures to suit your needs.
Is this dashboard suitable for government organizations?
Yes. The dashboard includes metrics like Government Partners and Civic Impact Score that are highly relevant for public sector reporting and grant accountability.
Can I share this dashboard with my team?
Yes. Publish the report to Power BI Service and share it via workspace access, direct links, or embed it in Microsoft Teams or SharePoint for seamless collaboration.
Conclusion
Click here to Purchase Civic Technology Startups Dashboard in Power BI
The Civic Technology Startups Dashboard in Power BI is an essential analytics tool for anyone working in the civic tech ecosystem. With 5 interactive pages covering financial performance, civic impact, growth tracking, and regional insights, this template eliminates manual reporting and empowers data-driven decision-making. Whether you are a startup founder, an investor, a government innovation team, or a consultant, this dashboard delivers professional-grade insights in minutes.
Purchase the Civic Technology Startups Dashboard in Power BI today and transform how you monitor, analyze, and communicate civic tech performance.
Visit our YouTube channel for step-by-step Power BI tutorials and template walkthroughs:
Click here to Purchase Civic Technology Startups Dashboard in Power BI