Managing procurement in a clinic is not easy. Clinics handle medicines, medical equipment, consumables, vendors, invoices, and budgets every single day. Therefore, without a proper tracking system, costs rise quickly, errors increase, and decision-making becomes slow.
That is exactly where the Clinic Procurement Dashboard in Power BI plays a powerful role.
In this detailed article, you will learn everything about the Clinic Procurement Dashboard in Power BI, including its features, benefits, structure, best practices, and real-world use cases. Moreover, this guide explains each dashboard page clearly so you can understand how it improves procurement efficiency and financial control.
Click to Purchases Clinic Procurement Dashboard in Power BI
What Is a Clinic Procurement Dashboard in Power BI?
A Clinic Procurement Dashboard in Power BI is an interactive data visualization tool that helps clinics track, analyze, and manage procurement activities in one place.
Instead of using multiple Excel files or manual reports, this dashboard converts raw procurement data into meaningful visuals. As a result, clinic managers, finance teams, and procurement officers can make faster and better decisions.
Moreover, the dashboard uses Power BI with Excel as the data source, which makes it easy to update, maintain, and customize.
Why Do Clinics Need a Procurement Dashboard?
Clinics handle daily purchasing of medicines, equipment, lab items, and consumables. However, manual tracking creates several challenges.
Here is why clinics need a procurement dashboard:
-
Procurement costs keep increasing without visibility
-
Vendor performance remains unclear
-
Budget overruns happen frequently
-
Invoice tracking becomes complex
-
Monthly and yearly trends stay hidden
Therefore, a Clinic Procurement Dashboard in Power BI helps clinics solve these problems by offering:
✔ Real-time cost tracking
✔ Clear vendor performance insights
✔ Budget vs actual comparison
✔ Department-wise analysis
✔ Monthly trend monitoring
What Is Included in the Clinic Procurement Dashboard?
This dashboard contains 5 powerful analytical pages, each designed to provide clear insights into procurement performance.
Let’s explore each page in detail.
1️⃣ Overview Page – Complete Procurement Summary
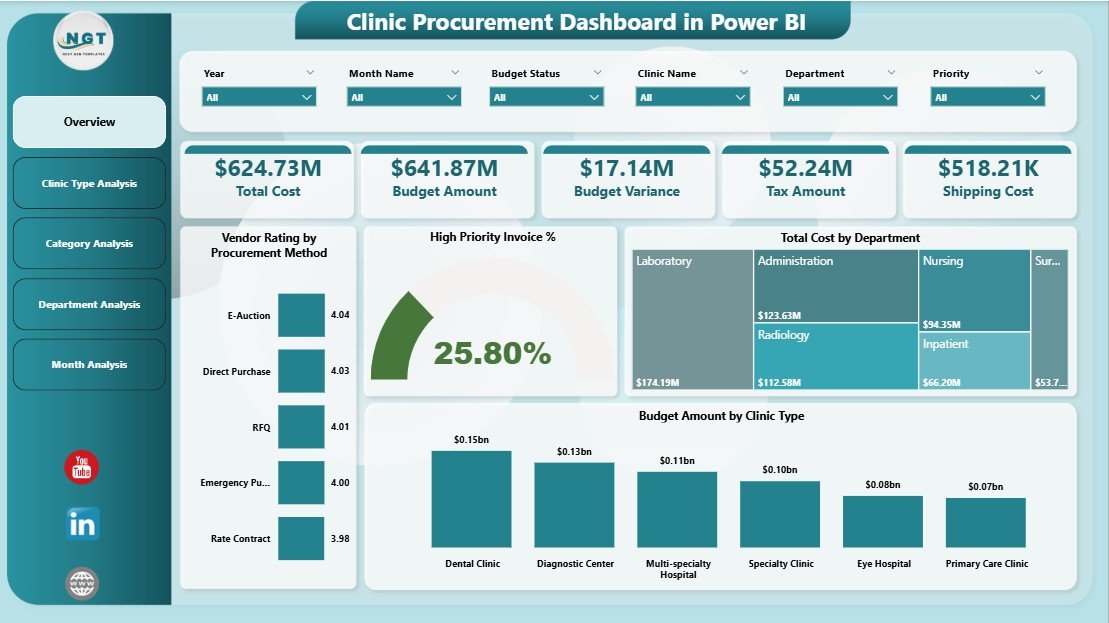
The Overview Page works as the main control panel of the dashboard. It gives a quick snapshot of overall procurement performance.
🔹 Key Features of the Overview Page
✅ Interactive Slicers
-
Filter data by clinic, time period, or category
-
Quickly analyze specific procurement areas
✅ 4 Key KPI Cards
-
Total procurement value
-
High-priority invoice percentage
-
Total cost
-
Budget overview
✅ 4 Insightful Charts
-
Vendor Rating by Procurement Method
-
High Priority Invoice Percentage
-
Total Cost by Department
-
Budget Amount by Clinic Type
🔹 Why This Page Matters
This page helps management:
-
Understand overall spending trends
-
Identify high-cost departments
-
Track vendor performance instantly
-
Monitor budget allocation
As a result, decision-makers can act faster and avoid cost overruns.
Click to Purchases Clinic Procurement Dashboard in Power BI
2️⃣ Clinic Type Analysis – Performance by Clinic Category
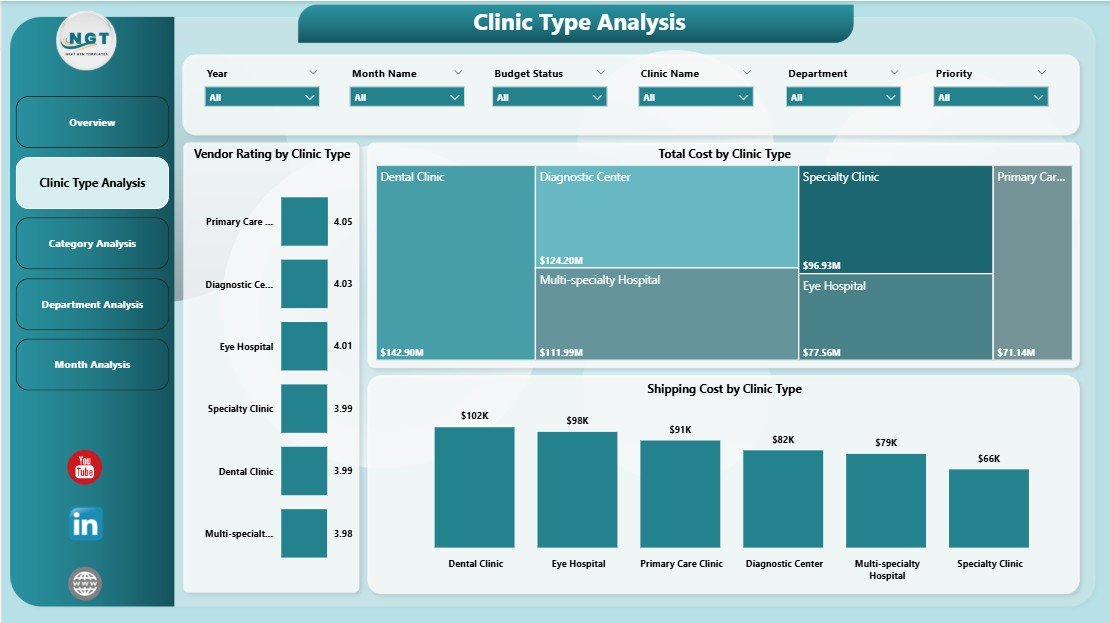
The Clinic Type Analysis Page focuses on procurement performance based on different clinic types.
🔹 Key Charts Included
📊 Vendor Rating by Clinic Type
📊 Total Cost by Clinic Type
📊 Shipping Cost by Clinic Type
🔹 How This Page Helps
This page helps you:
-
Compare procurement efficiency across clinic types
-
Identify clinics with high shipping or purchase costs
-
Evaluate vendor performance per clinic category
Therefore, management can optimize procurement strategies based on clinic type.
3️⃣ Category Analysis – Deep Dive into Purchase Categories
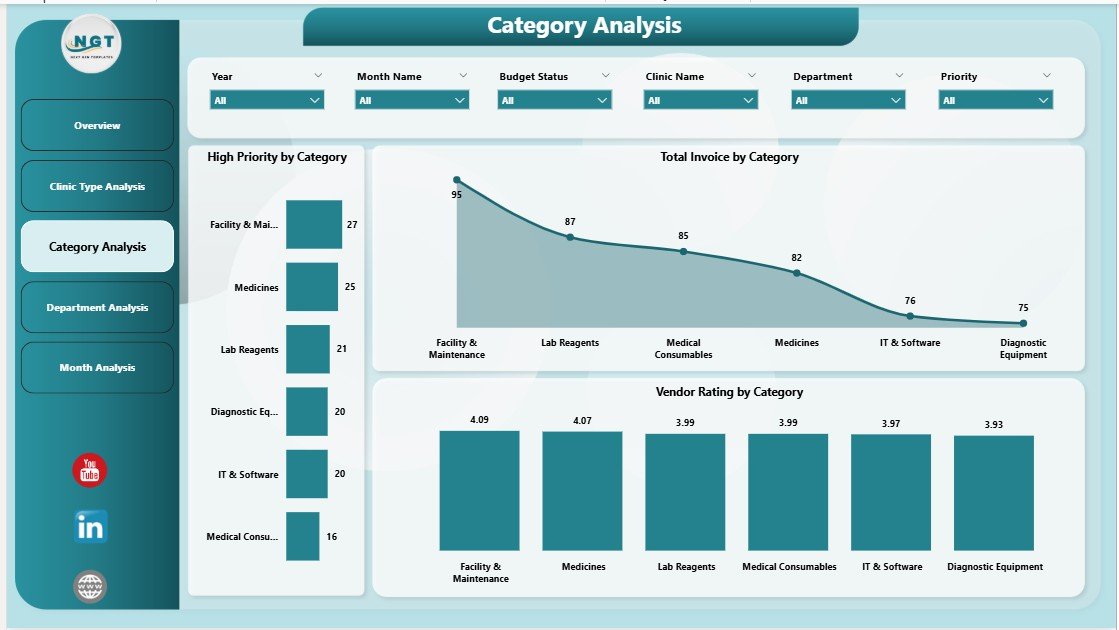
The Category Analysis Page gives clarity on procurement categories such as medicines, equipment, lab supplies, and consumables.
🔹 Charts Available on This Page
📈 Vendor Rating by Category
📈 Total Invoice Value by Category
📈 High Priority Purchases by Category
🔹 Benefits of Category Analysis
-
Helps identify cost-heavy categories
-
Shows which category requires urgent procurement
-
Improves inventory planning
-
Helps reduce unnecessary spending
As a result, clinics gain better control over category-wise procurement.
4️⃣ Department Analysis – Department-Wise Cost Control
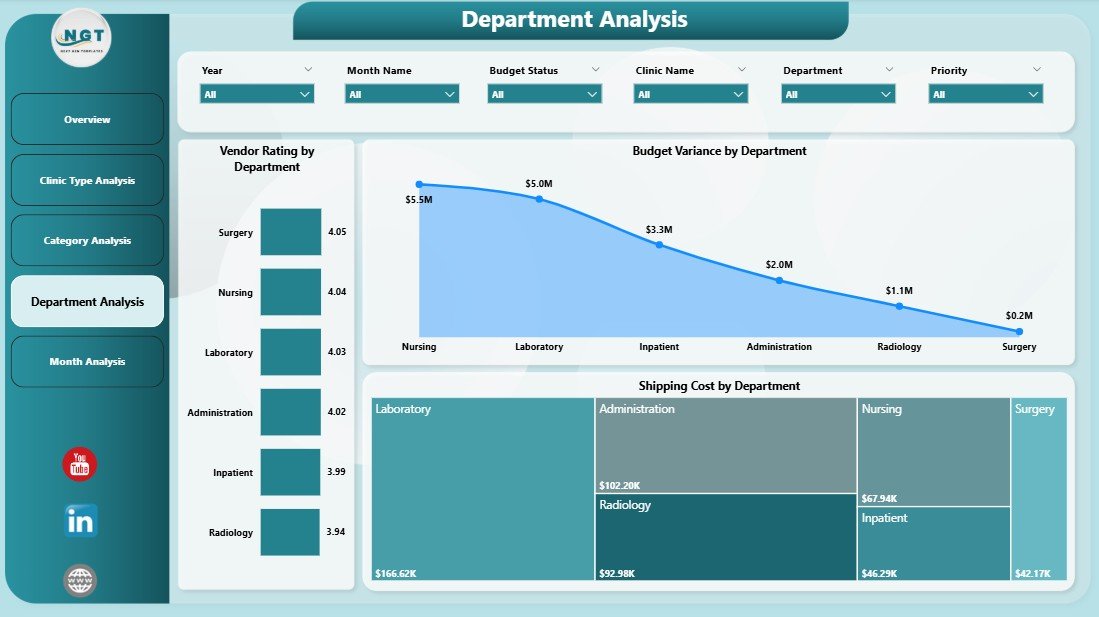
The Department Analysis Page focuses on how each department spends its procurement budget.
🔹 Charts Included
📊 Vendor Rating by Department
📊 Budget Variance by Department
📊 Shipping Cost by Department
🔹 Why This Page Is Important
This page helps:
-
Compare departmental spending
-
Identify budget deviations
-
Control excess shipping costs
-
Improve accountability
Therefore, clinic administrators can take corrective action before budgets go out of control.
Click to Purchases Clinic Procurement Dashboard in Power BI
5️⃣ Monthly Trends – Track Performance Over Time
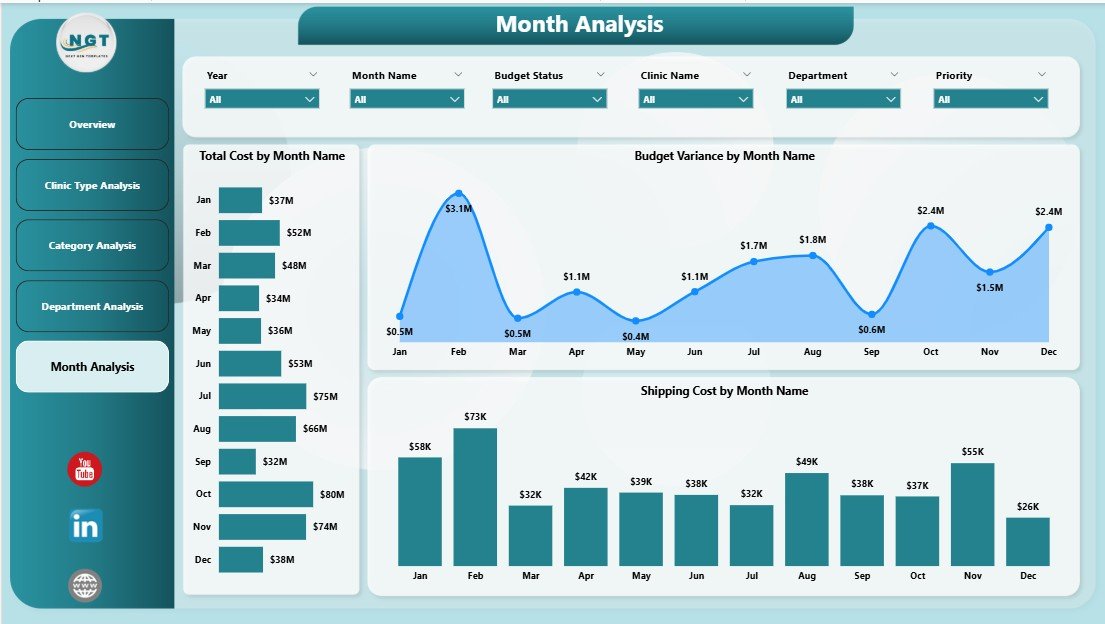
The Monthly Trends Page shows how procurement performance changes month by month.
🔹 Key Visuals
📅 Total Cost by Month
📅 Budget Variance by Month
📅 Shipping Cost by Month
🔹 Benefits of Monthly Trend Analysis
-
Tracks seasonal procurement patterns
-
Identifies months with high expenses
-
Helps in future budget forecasting
-
Supports better financial planning
Thus, this page helps clinics plan smarter and reduce financial surprises.
Advantages of Clinic Procurement Dashboard in Power BI
✅ Centralized Data Management
You can manage all procurement data from a single dashboard.
✅ Better Cost Control
You can easily track expenses and prevent budget overruns.
✅ Improved Vendor Performance Tracking
You can identify top-performing and underperforming vendors.
✅ Faster Decision-Making
Visual insights help management act quickly.
✅ Easy Data Updates
You can update data using Excel without technical complexity.
✅ Time-Saving Reporting
The dashboard eliminates manual reporting work.
✅ Improved Transparency
Every department can see performance clearly.
Best Practices for Using Clinic Procurement Dashboard in Power BI
✔ Keep Data Clean and Updated
Always update procurement data regularly to maintain accuracy.
✔ Use Filters Smartly
Use slicers to analyze department-wise or month-wise data.
✔ Monitor Budget Variance Frequently
Check budget vs actual spending every month.
✔ Review Vendor Ratings Regularly
Replace low-performing vendors to improve quality and cost efficiency.
✔ Use Monthly Trends for Forecasting
Plan future purchases using historical data.
✔ Train Staff Properly
Ensure procurement teams understand how to use the dashboard.
Click to Purchases Clinic Procurement Dashboard in Power BI
Who Can Use This Dashboard?
This dashboard works perfectly for:
-
Clinic Administrators
-
Procurement Managers
-
Finance Teams
-
Hospital Management
-
Healthcare Consultants
-
Operations Managers
How This Dashboard Improves Clinic Operations
This dashboard improves clinic operations by:
✔ Reducing procurement errors
✔ Increasing financial visibility
✔ Improving vendor accountability
✔ Supporting data-driven decisions
✔ Saving time and operational costs
As a result, clinics operate more efficiently and profitably.
Conclusion
The Clinic Procurement Dashboard in Power BI is a powerful and essential tool for modern healthcare management. It simplifies procurement tracking, improves visibility, and helps clinics control costs effectively.
With its structured pages, interactive visuals, and insightful analytics, this dashboard empowers clinics to make smart procurement decisions. Moreover, it reduces manual work and increases operational efficiency.
If you want better control over clinic procurement, this dashboard is the perfect solution.
Frequently Asked Questions (FAQs)
❓ What is a Clinic Procurement Dashboard in Power BI?
A Clinic Procurement Dashboard in Power BI is an interactive report that tracks procurement costs, vendor performance, and budget utilization in clinics.
❓ Can I use Excel as a data source?
Yes, this dashboard uses Excel as a data source, making it easy to update and manage.
❓ Is this dashboard suitable for small clinics?
Yes, both small and large clinics can use this dashboard effectively.
❓ Does this dashboard support monthly analysis?
Yes, the dashboard includes a Monthly Trends page for detailed time-based analysis.
❓ Can I customize the dashboard?
Yes, you can easily customize visuals, KPIs, and filters as per your clinic’s needs.
❓ Does it require technical knowledge?
No, basic Excel and Power BI knowledge is enough to use this dashboard.
Visit our YouTube channel to learn step-by-step video tutorials