Precision agriculture continues to transform modern farming. Farmers, agribusiness managers, and agri-consultants now rely on data instead of guesswork. However,
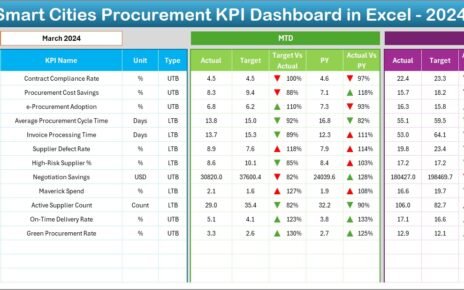
Smart city projects continue to expand across the world. As cities invest heavily in infrastructure, technology, utilities, and public services,
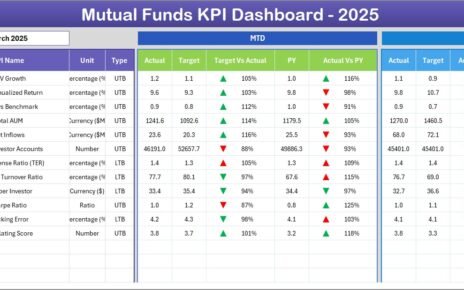
Mutual fund managers and AMC operations teams in 2026 face a familiar squeeze — Morningstar Direct seats run $1,800 to