In today’s fast-paced business world, customer service has evolved beyond just answering queries or resolving complaints. It now plays a key role in generating revenue. That’s why tracking and analyzing your customer service and support KPIs is no longer optional—it’s essential. And what better way to do it than using a Customer Service and Support Revenue Tracking KPI Dashboard in Excel?
This article will walk you through everything you need to know about building and using this dashboard effectively. Whether you’re a startup or a large enterprise, this tool can help you maximize your customer support team’s performance and revenue contribution.
Click to Purchases Customer Service and Support Revenue Tracking KPI Dashboard in Excel
What Is a Customer Service and Support Revenue Tracking KPI Dashboard?
A Customer Service and Support Revenue Tracking KPI Dashboard is a ready-to-use Excel-based analytics tool designed to help organizations monitor key performance indicators (KPIs) related to customer service and its impact on revenue.
This dashboard enables you to:
-
Track monthly and yearly revenue trends
-
Measure performance against targets
-
Analyze historical data for better decision-making
-
Monitor KPIs like upsell conversion rate, ticket resolution value, and customer retention revenue
It gives you a clear visual summary of your team’s performance and allows you to identify improvement areas quickly.
Key Components of the Excel Dashboard
Let’s break down the seven core worksheet tabs that power this template:
Home Sheet (Navigation Panel)
This is the entry point of the dashboard. The Home sheet offers six clickable buttons that take you directly to each dashboard section. This makes navigation smooth and intuitive, especially for first-time users.
Click to Purchases Customer Service and Support Revenue Tracking KPI Dashboard in Excel
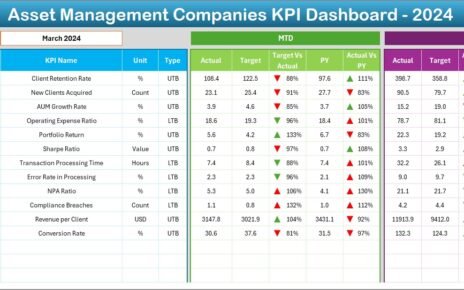
Dashboard Sheet (Main Visual Summary)
This is the heart of the template. The Dashboard sheet shows:
-
MTD (Month-to-Date) and YTD (Year-to-Date) figures
-
Actual vs. Target vs. Previous Year data
-
Up/Down arrows with conditional formatting for quick visual cues
-
Easy month selection via drop-down in cell
D3
This sheet gives you a full overview of how customer support activities contribute to revenue, both in the short term and over the year.
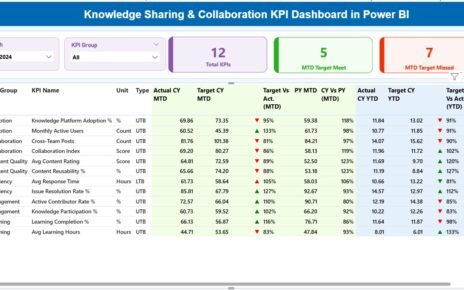
KPI Trend Sheet
Here, you can drill down into individual KPI performance. This sheet provides:
-
Drop-down selection of KPIs in cell
C3 -
Displays KPI Group, Unit, Type (UTB or LTB), Formula, and Definition
-
Charts showing monthly MTD and YTD trends of Actual, Target, and Previous Year
It helps you evaluate long-term performance patterns.
Actual Numbers Input Sheet
This sheet is where you enter monthly performance numbers. Key features include:
-
Month control in cell
E1to set the fiscal start -
Entry fields for MTD and YTD actuals across all KPIs
Keep it updated to maintain dashboard accuracy.
Target Sheet
In this section, input the monthly and yearly target values for each KPI. These values will automatically reflect in the Dashboard and Trend sheets for comparison.
Previous Year Numbers Sheet
Add the MTD and YTD data from the previous year. This enables side-by-side analysis of progress over time.
KPI Definition Sheet
Here’s where all your KPIs are defined. This tab includes:
-
KPI Group
-
KPI Name
-
Unit of Measure
-
Calculation Formula
-
Short KPI Definition
It ensures standardization and clarity across your team.
Advantages of Customer Service and Support Revenue Tracking KPI Dashboard
Click to Purchases Customer Service and Support Revenue Tracking KPI Dashboard in Excel
Implementing this dashboard offers numerous benefits:
1. Informed Decision Making
With real-time access to revenue-linked support metrics, managers can make data-backed decisions.
2. Improved Accountability
Employees know what to aim for. Everyone is aligned toward measurable goals.
3. Enhanced Productivity
Visual performance summaries help teams focus on what matters most—KPIs that move the revenue needle.
4. Cost Efficiency
Using Excel means no additional software costs. Plus, it’s easy to update and customize.
5. Performance Benchmarking
Historical data tracking helps compare current performance with past trends and targets.
Key KPIs to Track in Customer Support Revenue
Below are some essential KPIs to include:
-
Revenue per Resolved Ticket
Measures income generated from each resolved support ticket. -
Upsell Conversion Rate
Tracks how many tickets convert into additional product/service purchases. -
Average Revenue per Customer Contact
Calculates how much revenue each customer interaction brings. -
Customer Retention Revenue
Total revenue from returning customers driven by support quality. -
Cost per Support Interaction
Operational cost divided by the number of interactions. -
First Contact Resolution Rate
Directly affects customer satisfaction and likelihood of repeat business. -
Net Promoter Score (NPS)
While not a revenue figure, NPS correlates strongly with future revenue.
Best Practices for Using This Excel Dashboard
To make the most out of your Customer Service and Support Revenue Tracking KPI Dashboard, follow these best practices:
🔄 1. Update Regularly
Maintain consistent entries in Actual, Target, and Previous Year sheets. Regular updates make trend analysis reliable.
🎯 2. Align KPIs With Business Goals
Only track KPIs that directly impact customer experience and revenue. Avoid unnecessary clutter.
🧪 3. Use the Trend Sheet for Early Warnings
If a KPI shows a downward trend for two or more months, investigate immediately.
📈 4. Customize When Needed
You can modify the KPI list, formulas, or design. Make sure it aligns with your organization’s workflow.
💬 5. Train the Team
Ensure everyone understands the dashboard’s purpose and how to interpret the data.
Why Should You Use Excel for KPI Dashboards?
Excel remains one of the most accessible and powerful tools for tracking metrics. Here’s why:
-
Almost everyone knows how to use it
-
Built-in chart and formula capabilities
-
No need for expensive software
-
Easily shareable across departments
-
Supports VBA for automation
When used effectively, Excel can be your complete business intelligence solution for customer service and support teams.
How to Customize This Dashboard for Your Business?
Every organization has unique KPIs. Here are a few ways to tailor the dashboard:
-
Replace default KPIs with your internal metrics
-
Use slicers for region, support channel, or agent
-
Add conditional formatting to flag underperformance
-
Use macros to automate monthly data entry
-
Embed this dashboard into other project trackers
The flexibility of Excel allows limitless customization.
Real-World Example: Dashboard in Action
Imagine this:
Your customer support team handles 2,000 tickets each month. You introduce upsell suggestions during live chat interactions. You want to track if this results in more revenue.
You use:
-
Upsell Conversion Rate KPI to track ticket upsell outcomes
-
Revenue per Resolved Ticket to measure direct returns
-
Customer Retention Revenue to see if satisfaction impacts future sales
After three months of tracking, you notice:
-
Upsell conversion rose from 3% to 6%
-
Revenue per ticket increased by 25%
-
Customer retention revenue spiked
This insight helps justify your team’s ROI and secures higher budget approval next quarter.
Conclusion
Customer service is no longer just a support function—it’s a revenue-driving powerhouse. With the Customer Service and Support Revenue Tracking KPI Dashboard in Excel, you can take full control of your team’s financial performance. You don’t need complex BI software. Just open Excel, feed in your data, and let the dashboard guide your decisions.
Start today, and turn your customer support team into a profit center!
❓ Frequently Asked Questions (FAQs)
Q1: What makes this dashboard different from general KPI dashboards?
Answer:
This dashboard focuses specifically on revenue-related KPIs tied to customer support, such as upsell conversions, ticket value, and retention revenue—metrics that general dashboards often overlook.
Q2: Can I use this dashboard for non-revenue KPIs too?
Answer:
Yes. You can add or modify KPIs to include satisfaction scores, ticket resolution times, or support quality metrics. The structure is fully customizable.
Q3: Do I need Excel expertise to use it?
Answer:
No advanced knowledge required. Just basic Excel skills are enough to enter data, read charts, and use drop-down filters. It’s designed to be beginner-friendly.
Q4: Can this template handle large datasets?
Answer:
Yes, it can handle monthly and yearly data across many KPIs. However, for massive datasets (100K+ rows), you may consider Power BI.
Q5: Is this dashboard compatible with Google Sheets?
Answer:
No. Since it uses Excel-specific features like slicers and VBA, it will not function correctly in Google Sheets.
Q6: How often should I update the data?
Answer:
You should update monthly to track trends accurately. For high-velocity teams, weekly updates can also be beneficial.
Visit our YouTube channel to learn step-by-step video tutorials