Managing a distillery does not stop at producing premium spirits. You must control production efficiency, monitor yield, track losses, manage quality, and hit revenue targets every single month. However, many distilleries still rely on scattered spreadsheets and manual tracking. As a result, teams lose visibility. Moreover, decision-makers struggle to identify problems early.
So, how can you track all production, quality, financial, and operational KPIs in one place?
The answer is simple.
You need a Distilleries KPI Dashboard in Power BI.
Click to Purchases Distilleries KPI Dashboard in Power BI
This ready-to-use dashboard helps distillery owners, plant managers, finance heads, and operations teams monitor performance in a structured and interactive way. Furthermore, it allows you to compare Month-to-Date (MTD) and Year-to-Date (YTD) numbers with targets and previous year performance instantly. Therefore, you gain clarity, control, and confidence.
In this detailed guide, you will learn:
-
What a Distilleries KPI Dashboard in Power BI is
-
Why distilleries need KPI tracking
-
Detailed explanation of all 3 dashboard pages
-
Excel data structure behind the dashboard
-
Advantages of Distilleries KPI Dashboard
-
Best Practices for using the dashboard
-
Frequently Asked Questions with answers
Let us explore everything step by step.
What Is a Distilleries KPI Dashboard in Power BI?
A Distilleries KPI Dashboard in Power BI is a structured performance monitoring system built inside Microsoft Power BI. It helps you track key performance indicators related to production, yield, losses, quality, finance, and compliance.
Instead of checking multiple files, you can:
-
View all KPIs in one interactive report
-
Compare actual vs target instantly
-
Monitor performance trends over time
-
Identify underperforming KPIs quickly
-
Drill down to understand formulas and definitions
Because the dashboard connects with an Excel data source, you can easily update the numbers every month. As soon as you refresh the data, Power BI updates all visuals automatically.
Why Do Distilleries Need a KPI Dashboard?
Distilleries operate in a highly competitive and regulated environment. Therefore, they must monitor operations carefully.
Without structured KPI tracking:
-
Production losses increase
-
Yield efficiency drops
-
Quality issues go unnoticed
-
Target achievement remains unclear
-
Profit margins shrink
However, when you use a KPI dashboard:
-
You identify gaps quickly
-
You take action faster
-
You improve operational efficiency
-
You control costs effectively
-
You align teams with clear goals
As a result, your distillery operates smoothly and profitably.
How Is the Distilleries KPI Dashboard Structured in Power BI?
This dashboard contains 3 interactive pages inside the Power BI desktop file:
-
Summary Page
-
KPI Trend Page
-
KPI Definition Page (Drill Through Page)
Let us understand each page in detail.
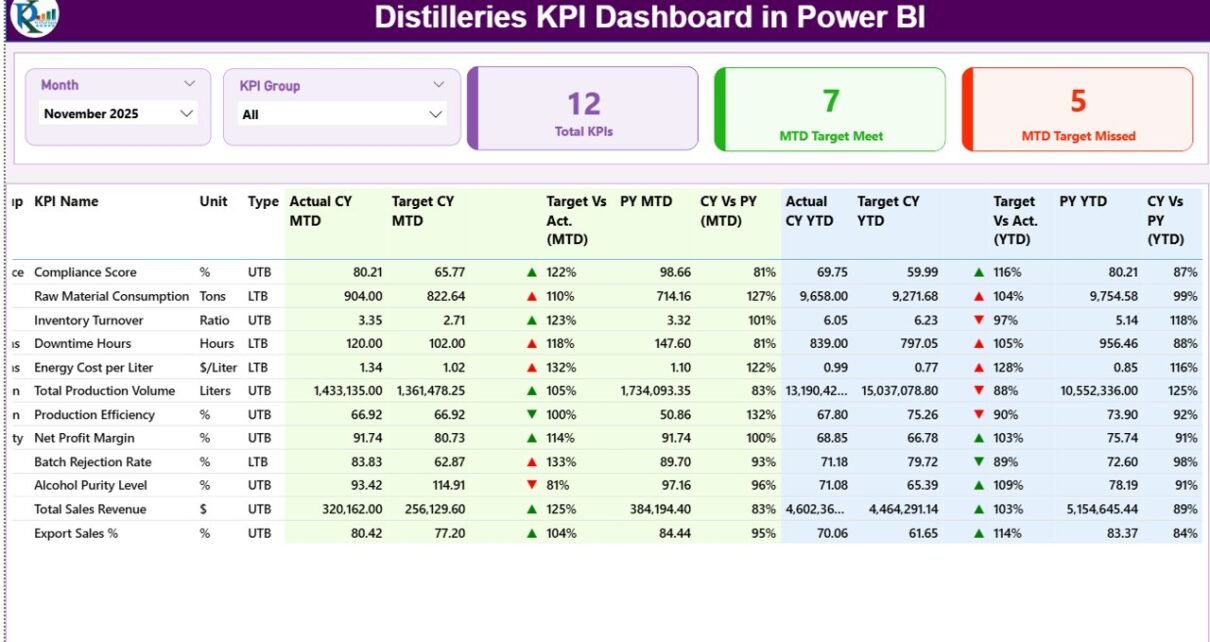
1️⃣ What Does the Summary Page Show?
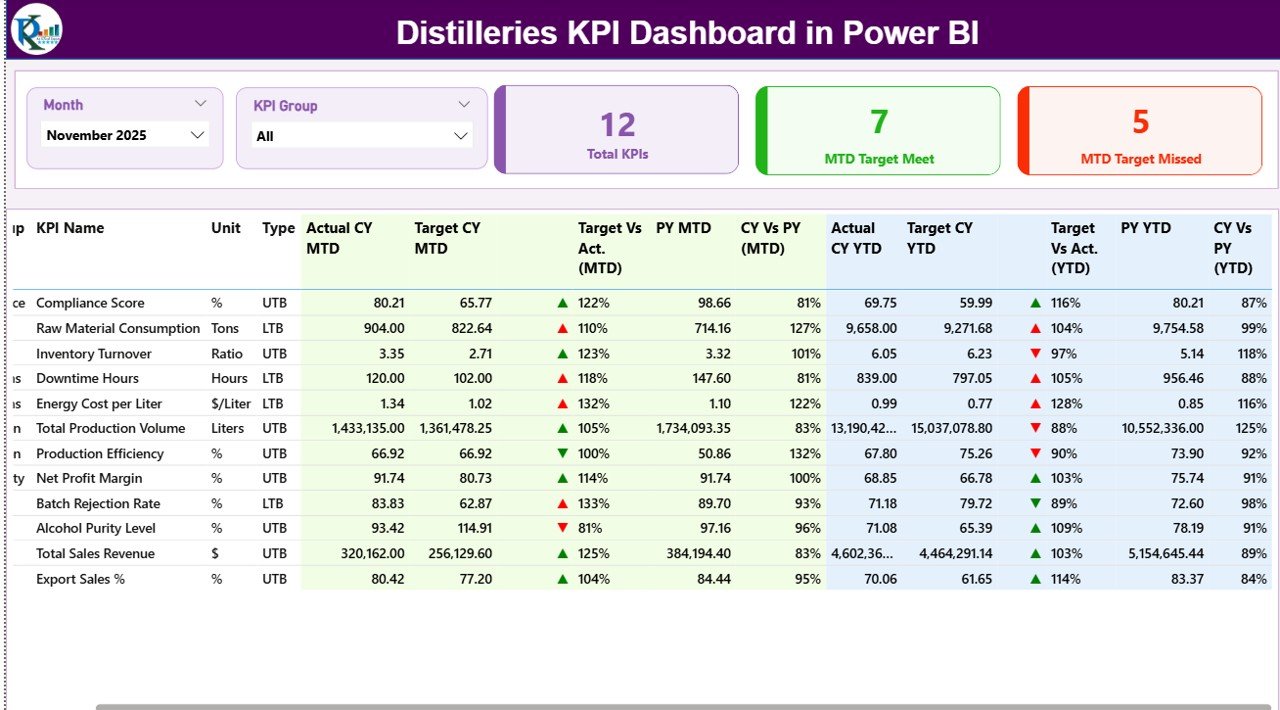
The Summary Page acts as the main control center of the dashboard. Here, you can view overall KPI performance at a glance.
🔹 Top Section – Slicers
At the top of the page, you will find:
-
Month Slicer
-
KPI Group Slicer
You can select any month. Immediately, the entire dashboard updates. Similarly, you can filter KPIs by group, such as:
-
Production KPIs
-
Quality KPIs
-
Financial KPIs
-
Efficiency KPIs
-
Compliance KPIs
Because of these slicers, you gain complete flexibility.
🔹 KPI Performance Cards
Below the slicers, you will see three powerful cards:
-
Total KPIs Count
-
MTD Target Meet Count
-
MTD Target Missed Count
These cards quickly answer important questions:
-
How many KPIs are active?
-
How many KPIs meet the monthly target?
-
How many KPIs require attention?
Therefore, management can assess performance within seconds.
🔹 Detailed KPI Table – Full Performance View
Below the cards, the dashboard displays a detailed KPI table with the following columns:
KPI Number
Sequence number of the KPI.
KPI Group
Category of the KPI.
KPI Name
Name of the KPI.
Unit
Measurement unit (Liters, %, Cases, INR, etc.).
Type (LTB or UTB)
-
UTB (Upper the Better) – Higher values indicate better performance.
-
LTB (Lower the Better) – Lower values indicate better performance.
This classification helps evaluate performance correctly.
🔹 MTD Performance Metrics
-
Actual CY MTD – Current year actual MTD value.
-
Target CY MTD – Current year target MTD value.
-
MTD Icon – ▲ (Green) or ▼ (Red) for quick visual status.
-
Target Vs Act. (MTD) – Formula:
-
PY MTD – Previous year MTD value.
-
CY Vs PY (MTD) – Formula:
Because of these metrics, you compare current performance against both targets and historical data.
🔹 YTD Performance Metrics
Similarly, the table shows:
-
Actual CY YTD
-
Target CY YTD
-
YTD Icon
-
Target Vs Act. (YTD)
-
PY YTD
-
CY Vs PY (YTD)
As a result, you evaluate long-term performance clearly.
2️⃣ What Does the KPI Trend Page Show?
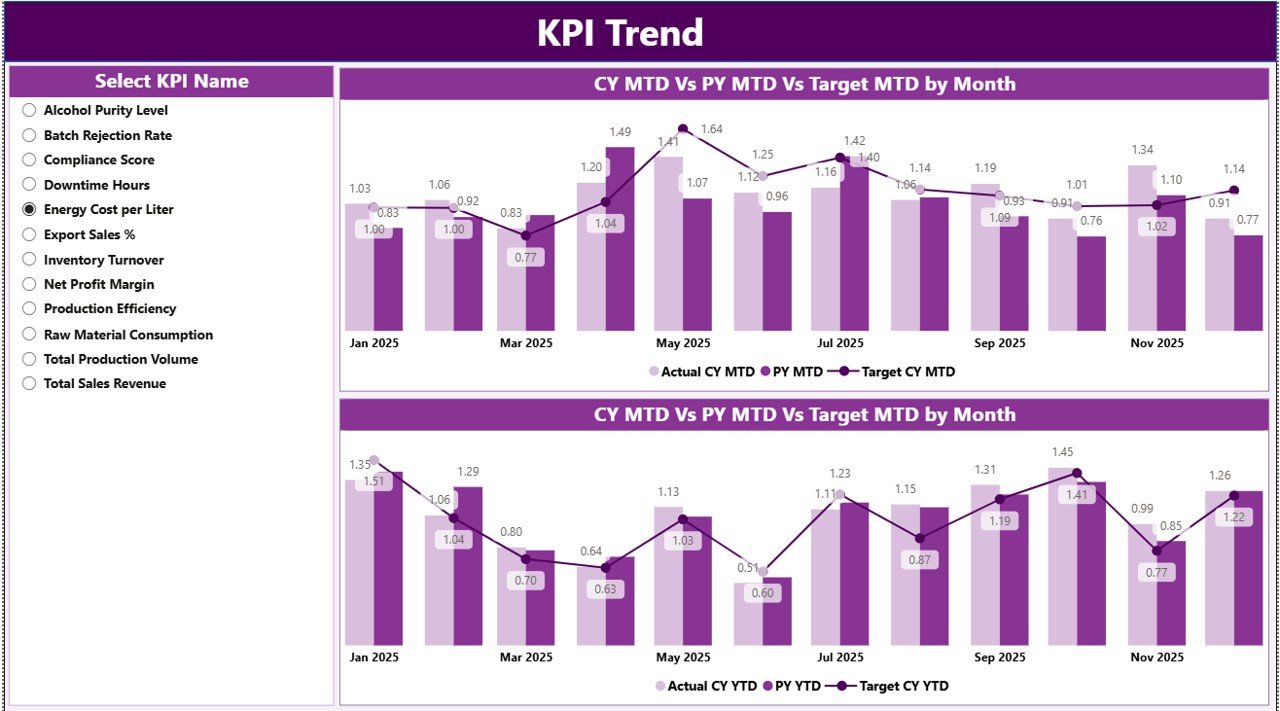
The KPI Trend Page helps you analyze performance over time.
On this page, you will find:
-
A KPI Name Slicer on the left
-
Two Combo Charts
🔹 MTD Trend Combo Chart
This chart displays:
-
Current Year Actual (MTD)
-
Previous Year MTD
-
Target MTD
Because it uses a combo chart, you can see:
-
Bar chart for actual values
-
Line chart for target or previous year
Therefore, you quickly identify seasonal patterns, improvement trends, or performance drops.
🔹 YTD Trend Combo Chart
Click to Purchases Distilleries KPI Dashboard in Power BI
Similarly, the YTD combo chart shows:
-
Current Year YTD
-
Previous Year YTD
-
Target YTD
With this visual:
-
You track long-term growth
-
You monitor cumulative progress
-
You forecast year-end performance
As a result, leadership can plan production, sales, and inventory effectively.
3️⃣ What Is the KPI Definition Page?
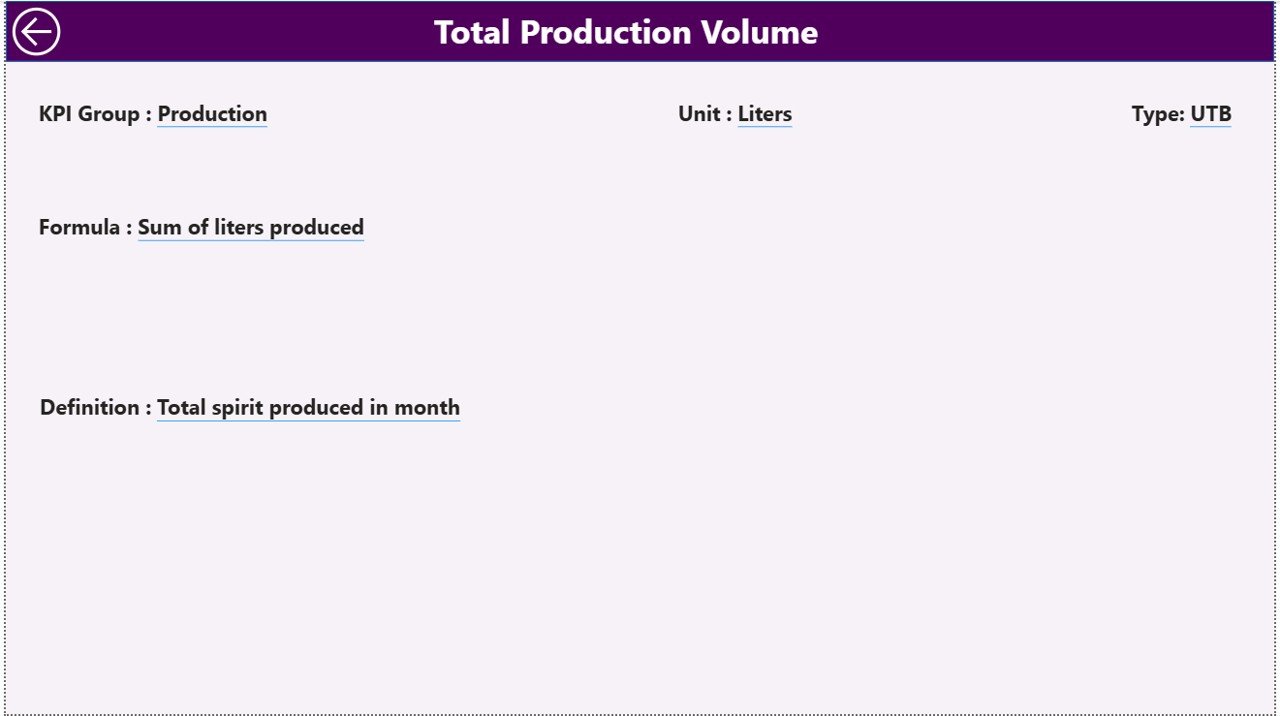
The KPI Definition Page works as a drill-through page.
It remains hidden. However, from the Summary Page, you can right-click on any KPI and drill through.
On this page, you can view:
-
KPI Number
-
KPI Group
-
KPI Name
-
Unit
-
Formula
-
Definition
-
Type (LTB/UTB)
Because of this feature:
-
Everyone understands KPI logic
-
Teams avoid confusion
-
Audits become easier
-
Reporting remains transparent
To return, simply click the Back Button on the top-left corner.
What Excel Data Does This Dashboard Use?
The dashboard connects with an Excel file containing three worksheets:
1️⃣ Input_Actual Sheet
In this sheet, you enter:
-
KPI Name
-
Month (First date of month)
-
MTD Number
-
YTD Number
You only need to update actual numbers monthly. After that, you refresh Power BI.
2️⃣ Input_Target Sheet
In this sheet, you enter:
-
KPI Name
-
Month
-
MTD Target
-
YTD Target
Because targets may change yearly, you can update them easily here.
3️⃣ KPI Definition Sheet
In this sheet, you enter:
-
KPI Number
-
KPI Group
-
KPI Name
-
Unit
-
Formula
-
Definition
-
Type (LTB or UTB)
This sheet drives the drill-through page.
What KPIs Can You Track in a Distillery?
You can track many KPIs, such as:
Production KPIs
-
Alcohol Yield %
-
Batch Completion Rate
-
Production Volume
-
Downtime Hours
-
Capacity Utilization %
Quality KPIs
-
Rejection Rate %
-
Lab Test Failure %
-
Customer Complaints
-
Compliance Score %
Financial KPIs
-
Revenue per Liter
-
Production Cost per Unit
-
Gross Margin %
-
Inventory Turnover
Efficiency KPIs
-
Energy Consumption per Batch
-
Water Usage per Liter
-
Raw Material Loss %
Because you can customize KPI definitions, this dashboard adapts to any distillery size.
Advantages of Distilleries KPI Dashboard in Power BI
Click to Purchases Distilleries KPI Dashboard in Power BI
Now let us understand the major advantages.
1️⃣ Real-Time Visibility
You see performance instantly. Therefore, you avoid delays in decision-making.
2️⃣ Target Monitoring
You clearly identify which KPIs meet targets and which do not.
3️⃣ Trend Analysis
You analyze monthly and yearly trends easily.
4️⃣ Centralized Reporting
Instead of multiple files, you manage everything in one dashboard.
5️⃣ Improved Accountability
Since each KPI shows performance clearly, teams take responsibility.
6️⃣ Better Planning
Because you compare CY vs PY, you plan production and budgets more accurately.
Best Practices for the Distilleries KPI Dashboard
To maximize results, follow these best practices:
1️⃣ Define Clear KPI Ownership
Assign responsibility for each KPI.
2️⃣ Update Data Regularly
Update actual and target sheets monthly without delay.
3️⃣ Keep KPI Definitions Clear
Avoid confusion. Write simple and short formulas.
4️⃣ Review Performance Monthly
Conduct monthly review meetings using the dashboard.
5️⃣ Focus on Root Cause
If a KPI misses target, investigate the reason immediately.
6️⃣ Avoid Too Many KPIs
Track only meaningful KPIs. Otherwise, teams lose focus.
How Does This Dashboard Improve Decision-Making?
Because this dashboard combines:
-
Visual indicators
-
Percentage comparisons
-
Historical trends
-
Target tracking
You move from guesswork to data-driven decisions.
As a result:
-
You reduce losses
-
You improve efficiency
-
You increase profitability
Conclusion
Managing a distillery requires precision, consistency, and control. However, manual tracking creates confusion and delays.
The Distilleries KPI Dashboard in Power BI solves this problem.
It helps you:
-
Monitor MTD and YTD performance
-
Compare current year vs previous year
-
Track target achievement
-
Analyze trends visually
-
Understand KPI formulas through drill-through
Therefore, if you want structured growth, operational clarity, and smarter decisions, this dashboard provides the perfect solution.
Frequently Asked Questions with Answers
❓ What is MTD and YTD in the Distilleries KPI Dashboard?
MTD means Month-to-Date performance. YTD means Year-to-Date performance. MTD tracks monthly progress, while YTD tracks cumulative yearly progress.
❓ What does LTB and UTB mean?
LTB means Lower the Better. UTB means Upper the Better. This classification helps evaluate KPI performance correctly.
❓ Can I customize KPIs in this dashboard?
Yes. You can modify the KPI Definition sheet in Excel and refresh Power BI. The dashboard updates automatically.
❓ Do I need advanced Power BI skills to use this dashboard?
No. You only need to update Excel sheets and refresh the report. The visuals update automatically.
❓ Can this dashboard handle multiple distillery plants?
Yes. You can add plant as a dimension in Excel and extend the data model.
❓ How often should I review the dashboard?
You should review it monthly. However, many teams review it weekly for better control.
Visit our YouTube channel to learn step-by-step video tutorials