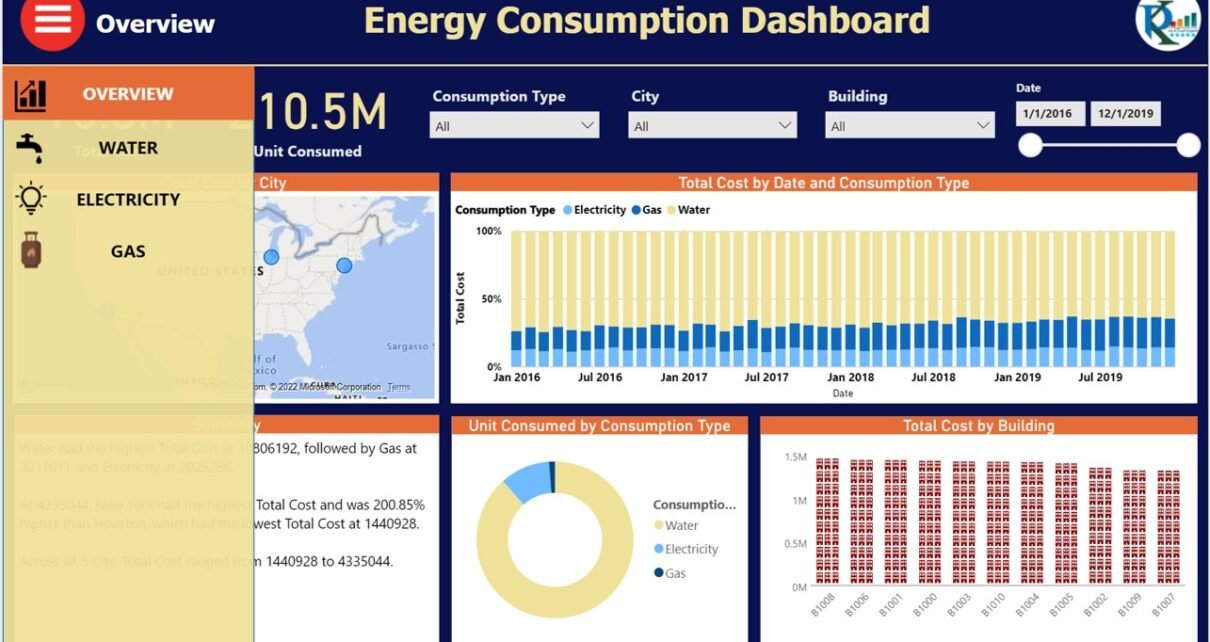
Gain insights into energy usage with our Energy Consumptions Dashboard in Power BI. Designed for clarity and usability, this dashboard combines powerful data transformation, dynamic visualizations, and user-friendly navigation to provide a comprehensive view of energy consumption patterns.

Key Features:
- Step-by-Step Data Transformation: Uses Power Query to transform raw data, ensuring clean and meaningful insights.
- Fact & Dimension Relationships: Establishes clear relationships between fact and dimension tables for accurate data modeling and analysis.
- Advanced DAX Measures: Incorporates DAX measures for in-depth calculations, supporting enhanced data-driven decisions.
- Interactive Navigation and Bookmarks: Includes a navigation bar with bookmarks and a Page Navigator button, making it easy to switch views and explore data insights dynamically .Energy Consumptions Dashboard