Home>Blogs>Charts and Visualization>Dynamic Comparison in Butterfly Chart>Dynamic Comparison in Butterfly Chart-1
Dynamic Comparison in Butterfly Chart-1
28
Jun 2021
64Comments Off on Dynamic Comparison in Butterfly Chart-1
PK
Meet PK, the founder of PK-AnExcelExpert.com! With over 15 years of experience in Data Visualization, Excel Automation, and dashboard creation. PK is a Microsoft Certified Professional who has a passion for all things in Excel. PK loves to explore new and innovative ways to use Excel and is always eager to share his knowledge with others. With an eye for detail and a commitment to excellence, PK has become a go-to expert in the world of Excel. Whether you're looking to create stunning visualizations or streamline your workflow with automation, PK has the skills and expertise to help you succeed. Join the many satisfied clients who have benefited from PK's services and see how he can take your Excel skills to the next level!
https://www.pk-anexcelexpert.com
Related Articles
Smart Cities Project KPI Dashboard in Power BI
Managing smart city projects without a structured performance monitoring system often creates delays, cost overruns, and weak accountability. However, modern
Smart Grid Services KPI Dashboard in Excel
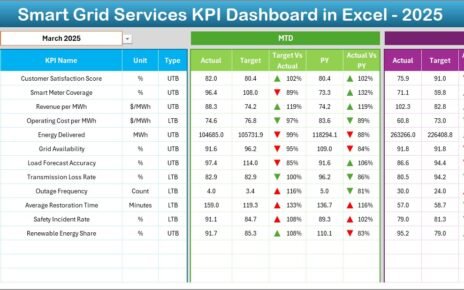
Smart grid services keep modern power systems reliable, efficient, and ready for the future. However, many utility teams still track
Vertical Farming Dashboard in Excel
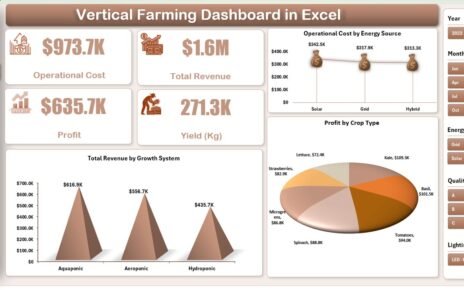
Vertical farming continues to reshape modern agriculture. As urbanization increases and arable land becomes limited, vertical farming offers a sustainable


