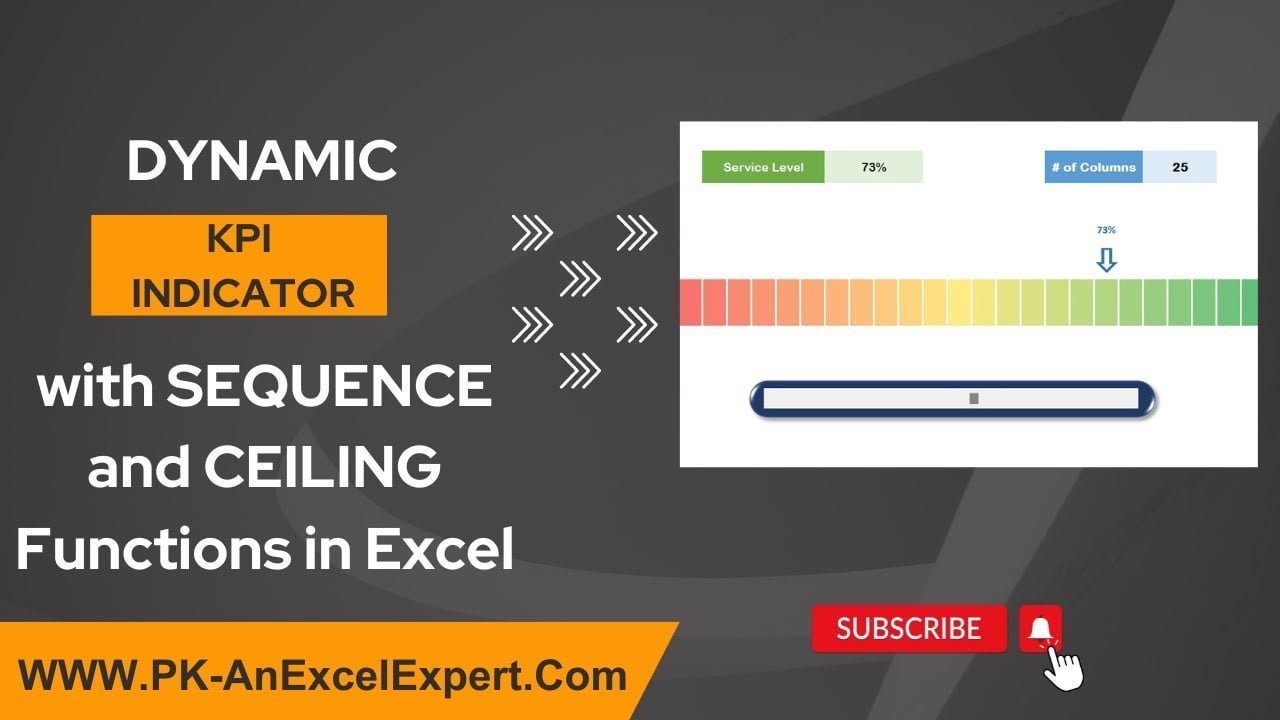
Home>Blogs>Charts and Visualization>Dynamic KPI indicator with SEQUENCE and CEILING Function in Excel>Video Thumbnail: Dynamic KPI indicator with SEQUENCE and CEILING Function in Excel
Video Thumbnail: Dynamic KPI indicator with SEQUENCE and CEILING Function in Excel
28
Jul 2024
0Comments Off on Video Thumbnail: Dynamic KPI indicator with SEQUENCE and CEILING Function in Excel
PK
Meet PK, the founder of PK-AnExcelExpert.com! With over 15 years of experience in Data Visualization, Excel Automation, and dashboard creation. PK is a Microsoft Certified Professional who has a passion for all things in Excel. PK loves to explore new and innovative ways to use Excel and is always eager to share his knowledge with others. With an eye for detail and a commitment to excellence, PK has become a go-to expert in the world of Excel. Whether you're looking to create stunning visualizations or streamline your workflow with automation, PK has the skills and expertise to help you succeed. Join the many satisfied clients who have benefited from PK's services and see how he can take your Excel skills to the next level!
https://www.pk-anexcelexpert.com
Related Articles
Brand Awareness KPI Dashboard in Excel
Brand awareness is essential for any business aiming to make a significant impact in the market. It represents how familiar
Insurance Dashboard in Excel
An insurance dashboard in Excel is a powerful tool designed to help insurance professionals, analysts, and agents track, visualize, and
Cybersecurity KPI Dashboard in Power BI
In the digital era, robust cybersecurity practices are essential for safeguarding critical data. Many organizations are turning to Power BI