In today’s fast-moving business world, companies must make quick and accurate decisions. However, many businesses still rely on scattered data
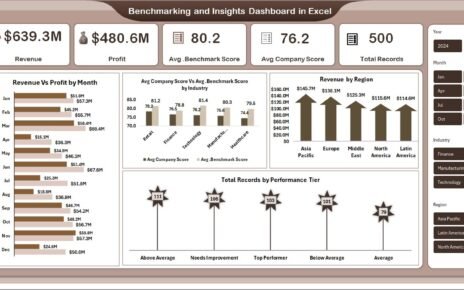
In today’s corporate landscape, businesses focus on more than just financial success. Companies must also demonstrate their commitment to sustainability,
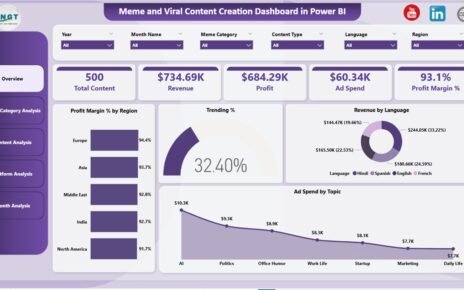
In today’s digital world, meme marketing and viral content play a huge role in brand visibility, audience engagement, and online