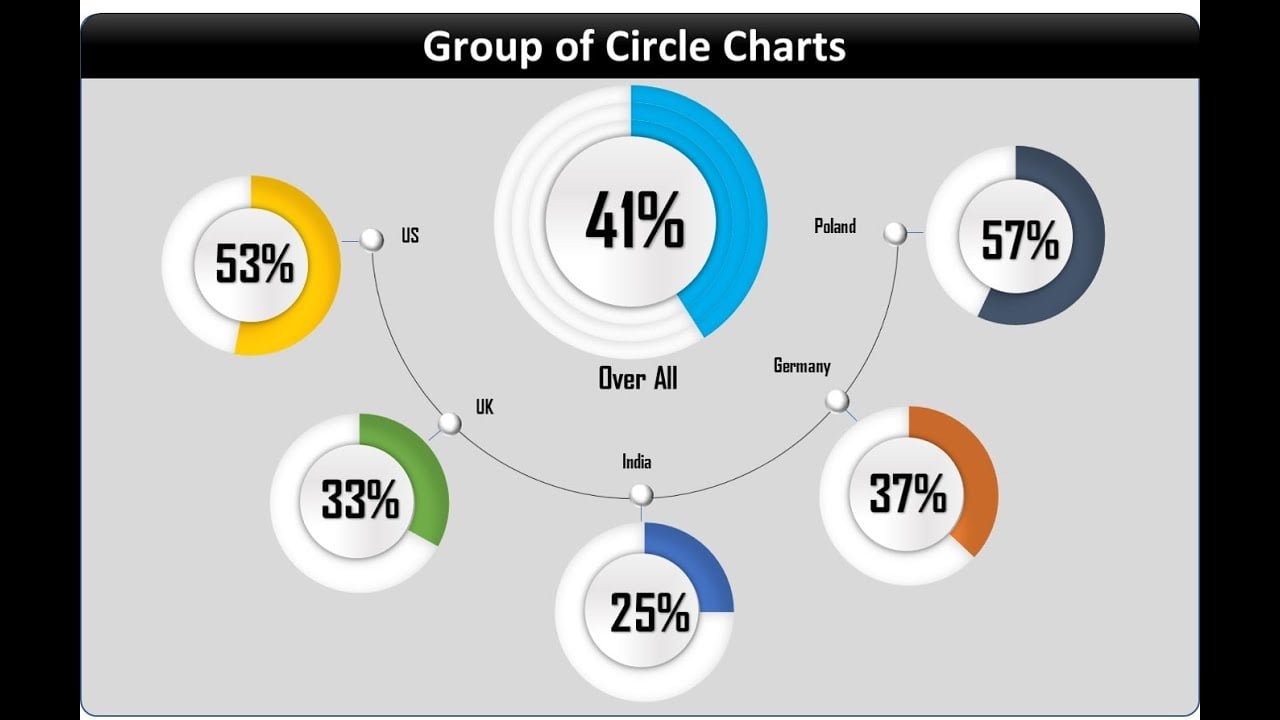
Home>Blogs>Charts and Visualization>Group of Circle Charts in Excel>Video Thumbnail: Info-graphics: Group of Circle Charts in Excel
Video Thumbnail: Info-graphics: Group of Circle Charts in Excel
28
May 2024
0Comments Off on Video Thumbnail: Info-graphics: Group of Circle Charts in Excel
PK
Meet PK, the founder of PK-AnExcelExpert.com! With over 15 years of experience in Data Visualization, Excel Automation, and dashboard creation. PK is a Microsoft Certified Professional who has a passion for all things in Excel. PK loves to explore new and innovative ways to use Excel and is always eager to share his knowledge with others. With an eye for detail and a commitment to excellence, PK has become a go-to expert in the world of Excel. Whether you're looking to create stunning visualizations or streamline your workflow with automation, PK has the skills and expertise to help you succeed. Join the many satisfied clients who have benefited from PK's services and see how he can take your Excel skills to the next level!
https://www.pk-anexcelexpert.com
Related Articles
Outsourced Accounting KPI Dashboard in Power BI
Managing outsourced accounting services requires accurate performance tracking, transparency, and data-driven decision making. However, many organizations still rely on scattered
Sales Lead Submission Tracker in Excel
Sales leads are the backbone of every business. They represent potential customers who show interest in your products or services.
Corporate Compliance Report in Excel
Maintaining corporate compliance is critical for organizations to avoid penalties, reduce risks, and ensure operational integrity. The Corporate Compliance Report


