Hydropower projects play a vital role in renewable energy generation across the world. However, managing hydropower operations requires continuous monitoring of performance, efficiency, targets, and operational outcomes. Without structured reporting, project managers often struggle to understand whether projects meet performance expectations.
Therefore, organizations need a centralized system that tracks performance indicators clearly and consistently.
The Hydropower Projects KPI Dashboard in Power BI solves this challenge by providing a ready-to-use analytics solution that converts raw Excel data into powerful visual insights. Instead of reviewing multiple spreadsheets, teams can monitor all KPIs from one interactive dashboard.
In this detailed guide, you will learn:
-
What a Hydropower KPI Dashboard is
-
Why hydropower projects need KPI tracking
-
Key features of the Power BI dashboard
-
Dashboard pages explained step-by-step
-
Data structure and Excel integration
-
Advantages and best practices
-
Frequently asked questions
Let’s begin by understanding the concept first.
What Is a Hydropower Projects KPI Dashboard in Power BI?
A Hydropower Projects KPI Dashboard in Power BI is a performance monitoring system that helps energy organizations track operational, financial, and efficiency KPIs using interactive visuals.
Instead of manually analyzing reports, the dashboard automatically:
-
Compares Actual vs Target performance
-
Tracks MTD (Month-to-Date) and YTD (Year-to-Date) values
-
Evaluates current year vs previous year performance
-
Highlights KPI status using visual indicators
Because the dashboard connects to Excel as a data source, users can update performance numbers easily without modifying the Power BI file.
As a result, decision-makers receive real-time insights with minimal effort.
Why Do Hydropower Projects Need KPI Dashboards?
Hydropower plants operate under strict performance and sustainability goals. However, managing turbines, water flow efficiency, maintenance schedules, and production targets creates complex datasets.
Without a KPI dashboard:
-
Teams waste time compiling reports.
-
Managers miss performance deviations.
-
Decision-making becomes slow.
-
Operational risks increase.
On the other hand, when organizations implement KPI dashboards, they gain clarity immediately.
Common Challenges in Hydropower Monitoring
-
Scattered operational data
-
Manual reporting errors
-
Lack of performance visibility
-
Difficulty comparing yearly results
-
Slow management reporting
Therefore, a centralized Power BI dashboard becomes essential.
Key Features of Hydropower Projects KPI Dashboard in Power BI
Click to Purchases Hydropower Projects KPI Dashboard in Power BI
This ready-to-use dashboard provides structured KPI monitoring through three interactive pages.
✔ Interactive KPI Monitoring
Users can analyze KPIs dynamically using slicers and filters.
✔ Excel-Based Data Source
You only update Excel sheets, and the dashboard refreshes automatically.
✔ MTD and YTD Performance Tracking
Monitor short-term and long-term performance simultaneously.
✔ Target vs Actual Comparison
Quickly identify whether KPIs meet expectations.
✔ Previous Year Benchmarking
Evaluate progress by comparing historical performance.
✔ Visual Status Indicators
Green and red arrows instantly show KPI performance health.
What Pages Are Included in the Dashboard?
The Power BI dashboard contains three professionally designed pages, each serving a specific analytical purpose.
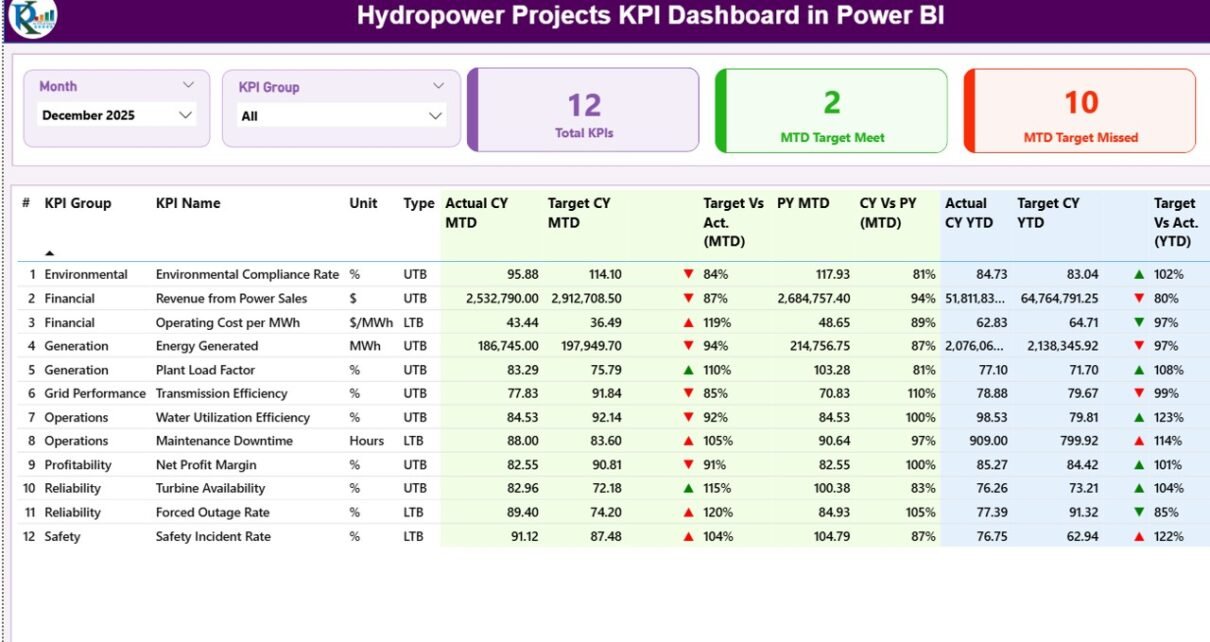
1️⃣ Summary Page – How Does It Provide Complete KPI Visibility?
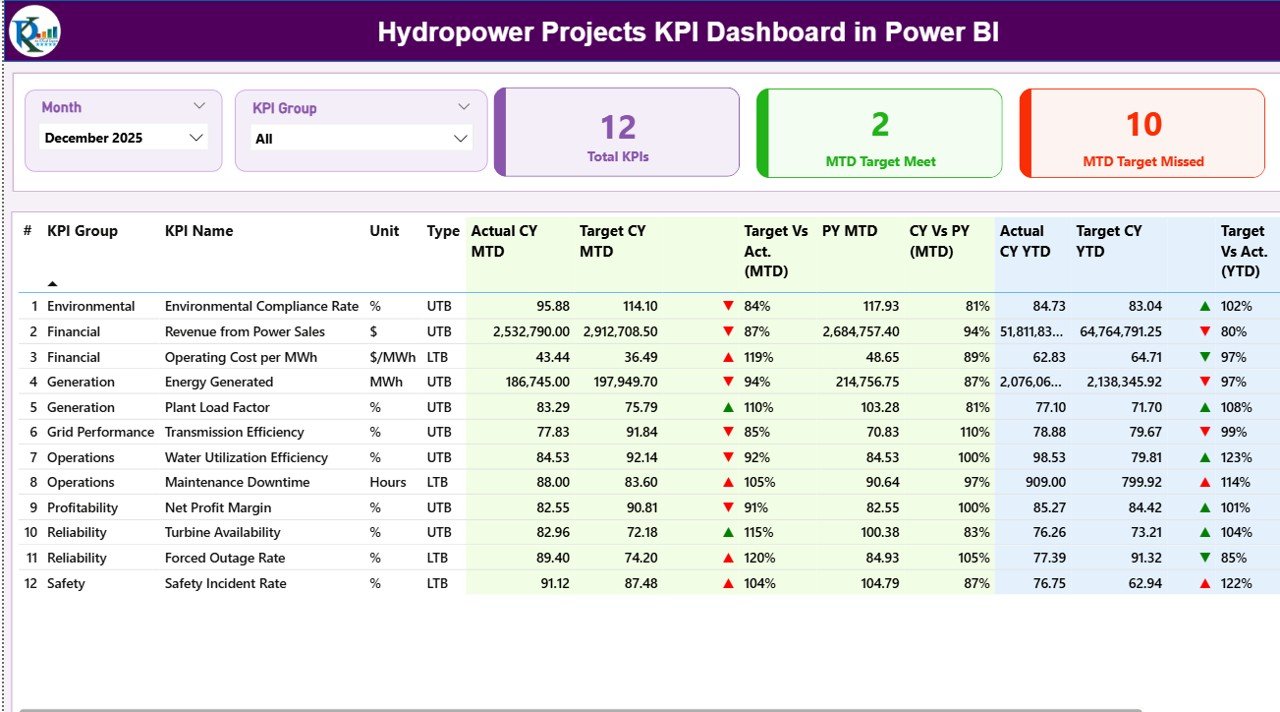
The Summary Page acts as the main control center of the dashboard. It gives decision-makers a complete overview of hydropower project performance.
Top Section Features
At the top of the dashboard, users can find:
-
Month Slicer – Select reporting period instantly.
-
KPI Group Slicer – Filter KPIs by category.
Because of these slicers, users can analyze performance from multiple perspectives.
KPI Performance Cards
The dashboard displays three important KPI cards:
-
Total KPIs Count
-
MTD Target Meet Count
-
MTD Target Missed Count
These cards immediately show overall performance health.
Detailed KPI Table Explained
Below the cards, a comprehensive KPI table displays detailed metrics.
KPI Information Columns
-
KPI Number – Sequential identifier.
-
KPI Group – KPI category classification.
-
KPI Name – Performance indicator title.
-
Unit – Measurement unit.
-
Type – LTB (Lower the Better) or UTB (Upper the Better).
MTD Performance Metrics
-
Actual CY MTD
-
Target CY MTD
-
MTD Icon (▲ Green / ▼ Red)
-
Target vs Actual (MTD %)
-
PY MTD comparison
-
CY vs PY (MTD %)
These metrics help managers evaluate short-term performance quickly.
YTD Performance Metrics
-
Actual CY YTD
-
Target CY YTD
-
YTD Icon indicators
-
Target vs Actual (YTD %)
-
Previous Year YTD values
-
CY vs PY (YTD %)
Therefore, users can understand long-term performance trends instantly.
2️⃣ KPI Trend Page – How Can You Analyze KPI Performance Over Time?
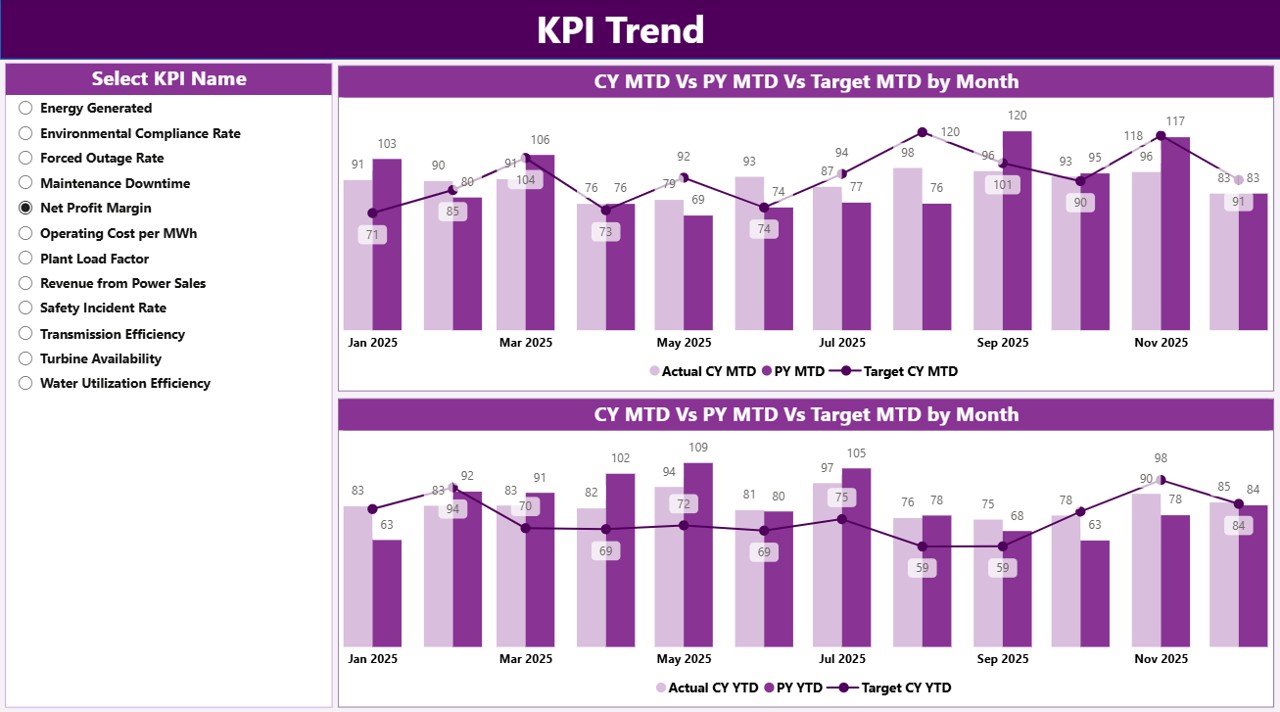
While the summary page shows status, the KPI Trend Page focuses on performance movement over time.
Key Functionalities
-
KPI Name slicer on the left
-
Two combo charts displaying:
-
Current Year Actual
-
Previous Year Actual
-
Target Values
-
Charts Included
-
MTD Trend Combo Chart
-
YTD Trend Combo Chart
Because these charts combine multiple datasets, users can identify:
-
Growth trends
-
Seasonal variations
-
Performance gaps
-
Target achievement patterns
Consequently, managers can make proactive operational decisions.
3️⃣ KPI Definition Page – Why Is Drill-Through Analysis Important?
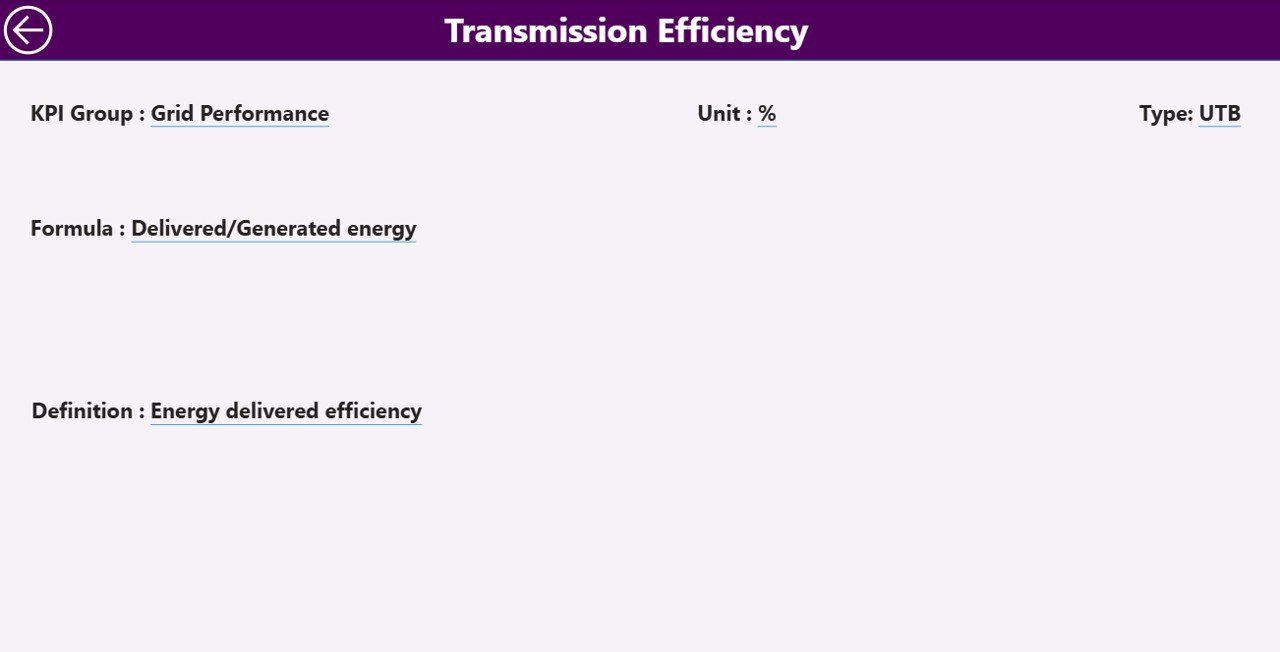
The KPI Definition Page provides detailed KPI documentation.
This page remains hidden and works through drill-through functionality.
Information Available
-
KPI Formula
-
KPI Definition
-
Measurement Unit
-
KPI Type (LTB or UTB)
When users need deeper understanding, they simply drill through from the summary page.
To return, users click the Back Button located at the top-left corner.
This feature improves dashboard usability significantly.
How Does the Excel Data Source Work?
Click to Purchases Hydropower Projects KPI Dashboard in Power BI
The dashboard uses an Excel file as its data backend. Therefore, users can maintain data easily without Power BI expertise.
The Excel file contains three worksheets.
1️⃣ Input_Actual Sheet
Here users enter actual KPI performance data.
Required fields:
-
KPI Name
-
Month (First date of month)
-
MTD Numbers
-
YTD Numbers
Updating this sheet updates performance instantly.
2️⃣ Input_Target Sheet
This sheet stores KPI targets.
Users enter:
-
KPI Name
-
Month
-
Target MTD values
-
Target YTD values
The dashboard automatically compares targets with actual performance.
3️⃣ KPI Definition Sheet
This sheet defines KPI structure.
Columns include:
-
KPI Number
-
KPI Group
-
KPI Name
-
Unit
-
Formula
-
Definition
-
Type (LTB/UTB)
Because of this structure, the dashboard remains standardized and scalable.
How Does This Dashboard Improve Hydropower Project Management?
Hydropower projects involve engineering, environmental monitoring, and operational efficiency tracking. Therefore, leadership teams need reliable insights.
This dashboard helps organizations:
-
Monitor turbine efficiency KPIs
-
Track energy generation performance
-
Evaluate operational reliability
-
Measure sustainability targets
-
Improve reporting transparency
As a result, project teams make faster and better decisions.
Advantages of Hydropower Projects KPI Dashboard in Power BI
✅ Centralized Performance Monitoring
All KPIs appear in one dashboard, eliminating scattered reporting.
✅ Faster Decision Making
Visual indicators highlight issues instantly.
✅ Improved Accountability
Teams clearly understand performance expectations.
✅ Real-Time Insights
Excel updates refresh Power BI visuals quickly.
✅ Historical Performance Comparison
Year-over-year comparisons support strategic planning.
✅ User-Friendly Interface
Even non-technical users can operate the dashboard easily.
Best Practices for Hydropower Projects KPI Dashboard in Power BI
To achieve maximum benefits, organizations should follow proven practices.
✔ Define KPIs Clearly
Ensure each KPI has a measurable formula and objective.
✔ Maintain Consistent Data Entry
Always use the first day of the month for date entries.
✔ Update Data Regularly
Frequent updates keep insights relevant.
✔ Use KPI Groups Wisely
Group KPIs by operations, finance, maintenance, or sustainability.
✔ Monitor Both MTD and YTD
Short-term and long-term tracking improves planning.
✔ Review Trends Monthly
Trend analysis helps identify operational risks early.
✔ Train Users Properly
Provide basic Power BI training for stakeholders.
How Does Power BI Enhance Renewable Energy Analytics?
Click to Purchases Hydropower Projects KPI Dashboard in Power BI
Power BI transforms hydropower analytics through:
-
Interactive visualization
-
Automated calculations
-
Drill-through insights
-
Dynamic filtering
-
Professional reporting layouts
Moreover, Power BI reduces manual reporting dependency, which saves time and improves accuracy.
Who Can Benefit From This Dashboard?
This dashboard serves multiple roles within hydropower organizations:
-
Hydropower Project Managers
-
Renewable Energy Analysts
-
Operations Teams
-
Maintenance Engineers
-
Energy Consultants
-
Executive Leadership Teams
Because the dashboard presents data visually, both technical and non-technical users benefit equally.
How to Implement the Dashboard Successfully?
Follow these simple steps:
-
Prepare KPI definitions.
-
Populate Excel sheets with data.
-
Connect Excel file to Power BI.
-
Refresh the dataset.
-
Apply slicers for analysis.
-
Share insights with stakeholders.
After implementation, organizations can monitor performance continuously.
Future Scope of Hydropower KPI Analytics
Hydropower analytics will evolve rapidly. Organizations can expand dashboards by adding:
-
Predictive maintenance analytics
-
Water level forecasting
-
AI-based performance predictions
-
Real-time IoT integrations
-
Environmental compliance KPIs
Therefore, KPI dashboards will become strategic tools rather than reporting tools.
Conclusion
Click to Purchases Hydropower Projects KPI Dashboard in Power BI
Hydropower projects demand precise performance monitoring to ensure operational efficiency and sustainability. However, manual reporting slows decision-making and increases risk.
The Hydropower Projects KPI Dashboard in Power BI provides a structured, intelligent, and interactive solution that transforms Excel data into actionable insights.
Because it tracks MTD and YTD performance, compares targets, and visualizes trends clearly, organizations gain complete performance visibility.
Ultimately, this dashboard empowers teams to improve efficiency, meet targets consistently, and drive renewable energy success with confidence.
Frequently Asked Questions (FAQs)
1. What is a Hydropower KPI Dashboard?
A Hydropower KPI Dashboard tracks performance indicators related to hydropower operations using visual analytics tools like Power BI.
2. Do I need advanced Power BI skills to use this dashboard?
No. You only need to update Excel sheets and refresh the dashboard.
3. What does LTB and UTB mean?
LTB means Lower the Better, while UTB means Upper the Better KPI performance type.
4. Can I add more KPIs later?
Yes. You can expand the KPI Definition sheet and refresh the model.
5. How often should I update the data?
You should update KPI data monthly or whenever new performance numbers become available.
6. Can this dashboard work for other renewable energy projects?
Yes. You can customize it for solar, wind, or energy infrastructure projects.
7. Why should organizations compare Current Year vs Previous Year?
Year-over-year comparison helps measure improvement and identify long-term trends.
8. Is Excel required for this dashboard?
Yes. Excel acts as the primary data source for easy data entry.
Visit our YouTube channel to learn step-by-step video tutorials