Influencer Marketing Dashboard is no longer optional. Brands now compete for attention on Instagram, YouTube, TikTok, and other platforms every single day. However, many marketing teams still track campaign results in scattered Excel sheets. As a result, they struggle to understand performance, ROI, and audience engagement clearly.
So, how can brands track influencer campaigns in a smarter way?
The answer is simple: Influencer Marketing Dashboard in Power BI.
This dashboard transforms raw campaign data into powerful, interactive insights. Moreover, it helps marketing managers monitor engagement, revenue, budget allocation, and cost per conversion in one centralized system.
In this detailed guide, you will learn:
-
What an Influencer Marketing Dashboard in Power BI is
-
Why businesses need it
-
Dashboard pages and features
-
Advantages of using it
-
Best practices for implementation
-
Frequently asked questions
By the end of this article, you will clearly understand how this dashboard can improve your campaign performance and marketing ROI.
Click to Purchases Influencer Marketing Dashboard in Power BI
What Is an Influencer Marketing Dashboard in Power BI?
An Influencer Marketing Dashboard in Power BI is an interactive analytics solution that helps businesses monitor, analyze, and optimize influencer campaigns.
Instead of checking multiple reports manually, you can:
-
Track engagement rate percentage
-
Monitor campaign budget allocation
-
Analyze revenue by platform
-
Evaluate cost per conversion
-
Compare performance across categories and regions
Therefore, you gain full visibility into influencer performance and marketing efficiency.
Why Do Brands Need an Influencer Marketing Dashboard?
Influencer marketing involves multiple moving parts. Brands work with different influencers, platforms, regions, and content types. Consequently, performance tracking becomes complex.
Without a dashboard:
-
Teams miss budget overruns
-
Managers fail to detect low-performing campaigns
-
ROI becomes unclear
-
Reports take hours to prepare
However, when you use a Power BI dashboard, you simplify everything. You get real-time visuals. You make faster decisions. You improve accountability.
Key Pages of Influencer Marketing Dashboard in Power BI
This dashboard includes 5 interactive pages inside the Power BI Desktop file. Each page focuses on a specific performance area.
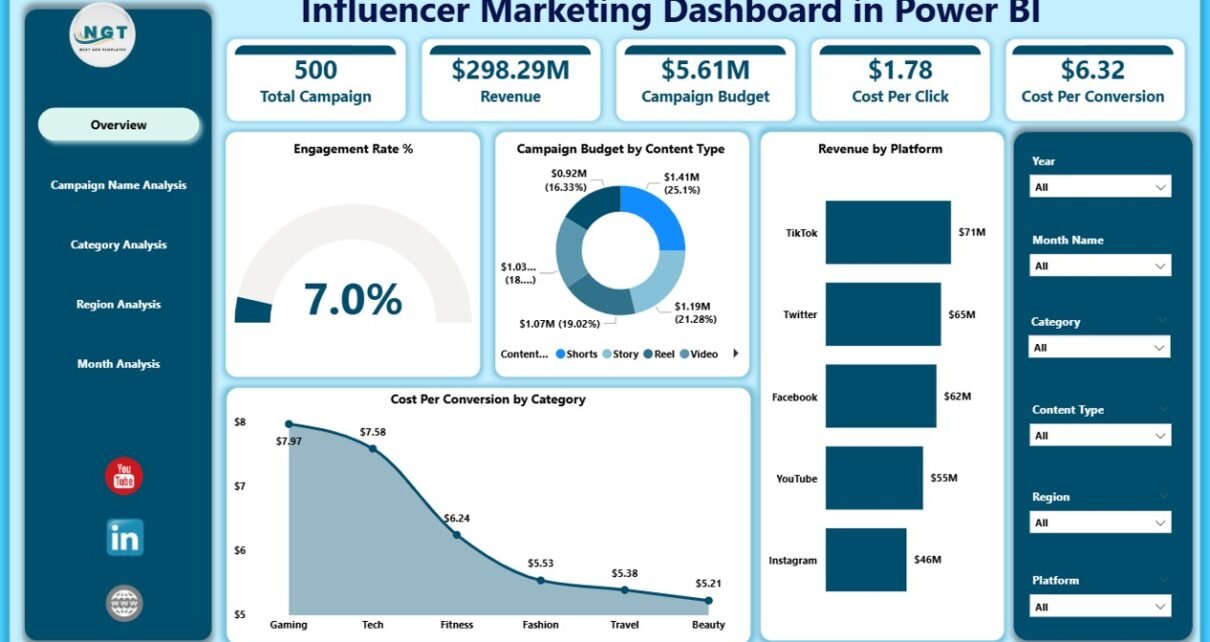
1️⃣ Overview Page – How Can You See Overall Campaign Performance?
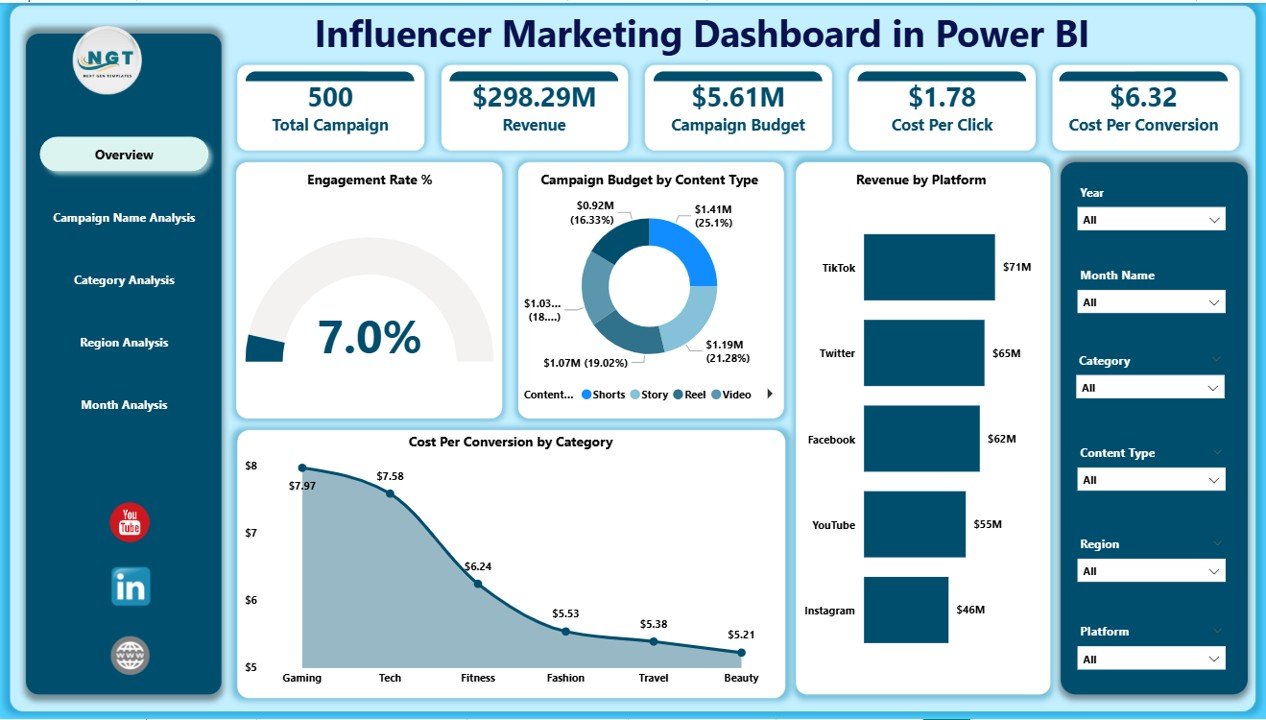
The Overview page acts as the command center of the dashboard. Here, you can use slicers to filter data by campaign, category, region, or month.
Key KPI Cards on Overview Page
-
Engagement Rate %
-
Campaign Budget by Content Type
-
Revenue by Platform
-
Cost Per Conversion by Category
Why This Page Matters
-
You instantly see campaign health.
-
You identify revenue-driving platforms.
-
You compare budget allocation with returns.
-
You detect expensive conversions quickly.
As a result, you make informed decisions without opening multiple reports.
Click to Purchases Influencer Marketing Dashboard in Power BI
2️⃣ Campaign Name Analysis – Which Campaign Performs Best?
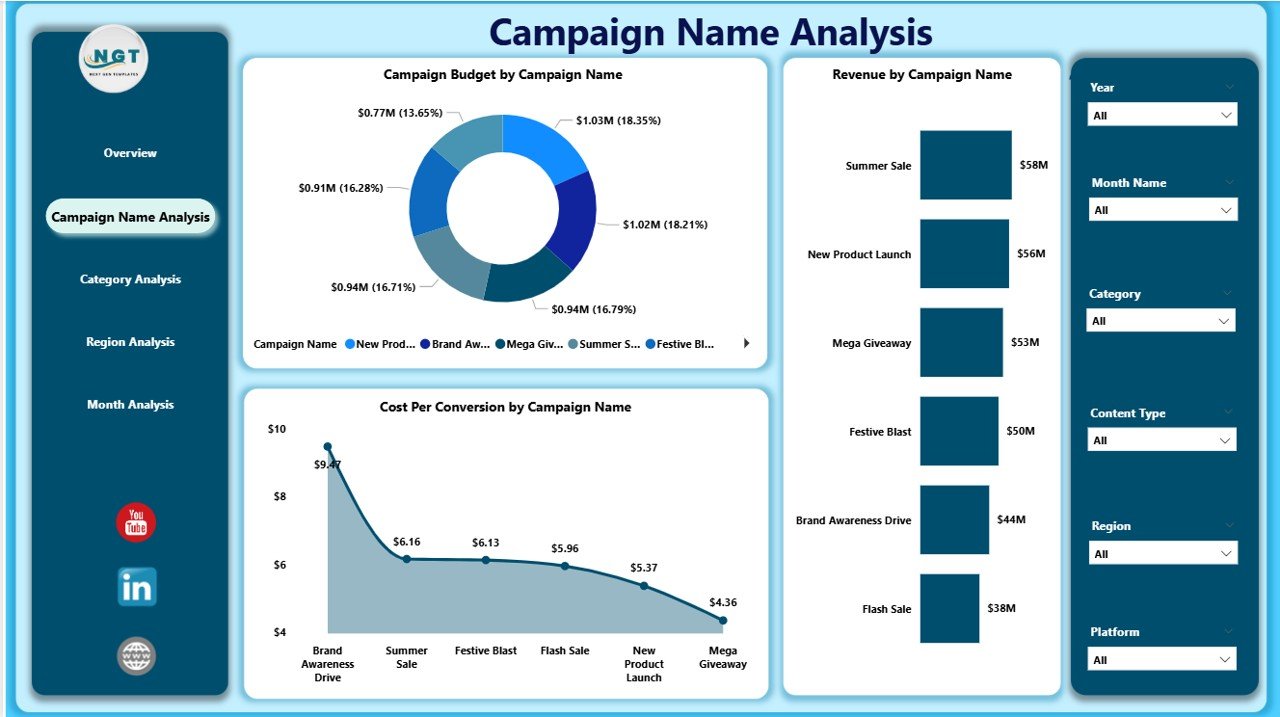
This page focuses on individual campaign performance. Marketing managers often ask:
Which campaign delivers the highest ROI?
This page answers that clearly.
Charts Available:
-
Campaign Budget by Campaign Name
-
Revenue by Campaign Name
-
Cost Per Conversion by Campaign Name
What You Can Analyze:
-
High-budget vs high-revenue campaigns
-
Underperforming campaigns
-
Campaigns with expensive conversions
Therefore, you can reallocate budget wisely and stop low-performing campaigns early.
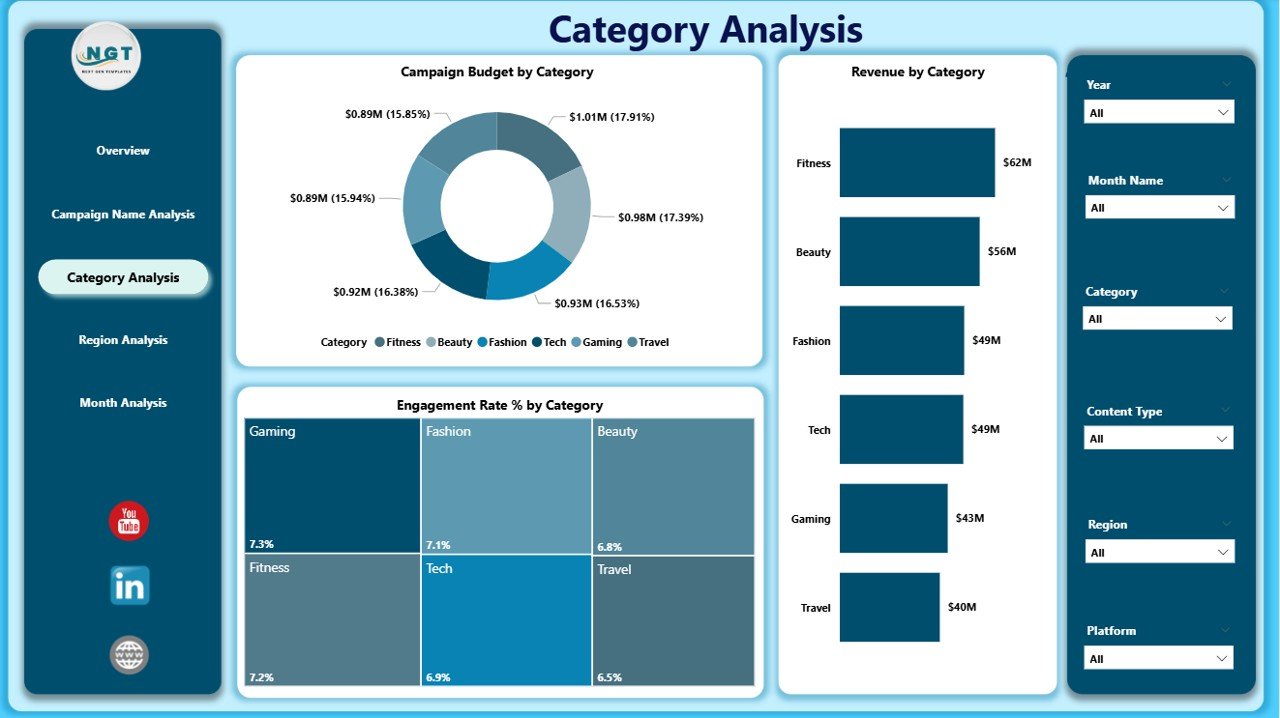
3️⃣ Category Analysis – Which Influencer Category Drives Results?
Influencers fall into categories such as:
-
Fashion
-
Technology
-
Fitness
-
Travel
-
Beauty
-
Gaming
This page helps you analyze category-level performance.
Charts Available:
-
Campaign Budget by Category
-
Revenue by Category
-
Engagement Rate % by Category
Why Category Analysis Matters
Sometimes, brands invest heavily in one category without checking returns. However, this dashboard shows:
-
Which category generates maximum engagement
-
Which category delivers higher revenue
-
Where budget allocation needs adjustment
As a result, you can refine your targeting strategy.
4️⃣ Region Analysis – Which Location Generates Higher ROI?
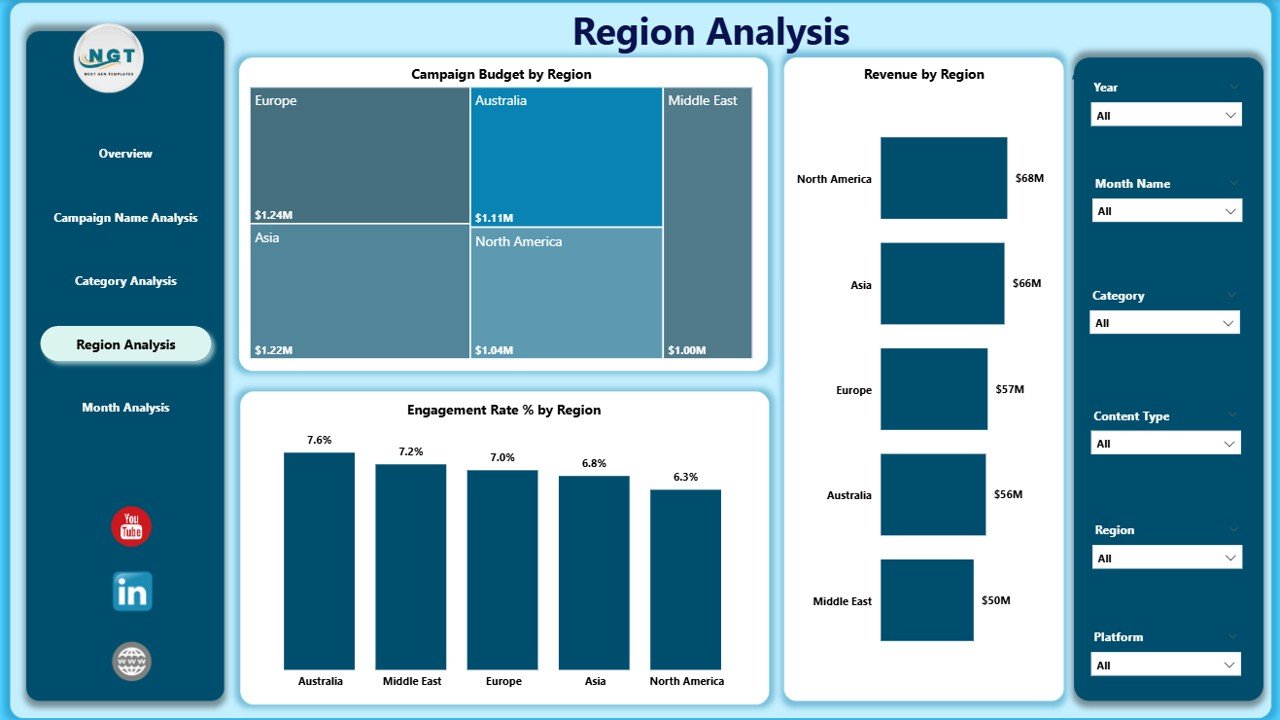
Influencer performance varies by region. Audience behavior changes based on geography, culture, and trends.
Charts Available:
-
Campaign Budget by Region
-
Revenue by Region
-
Engagement Rate % by Region
Key Insights You Can Get
-
Regions with high engagement
-
Regions with low ROI
-
Budget concentration by geography
Therefore, you can expand in profitable regions and optimize spending in weaker markets.
Click to Purchases Influencer Marketing Dashboard in Power BI
5️⃣ Month Analysis – How Does Performance Change Over Time?
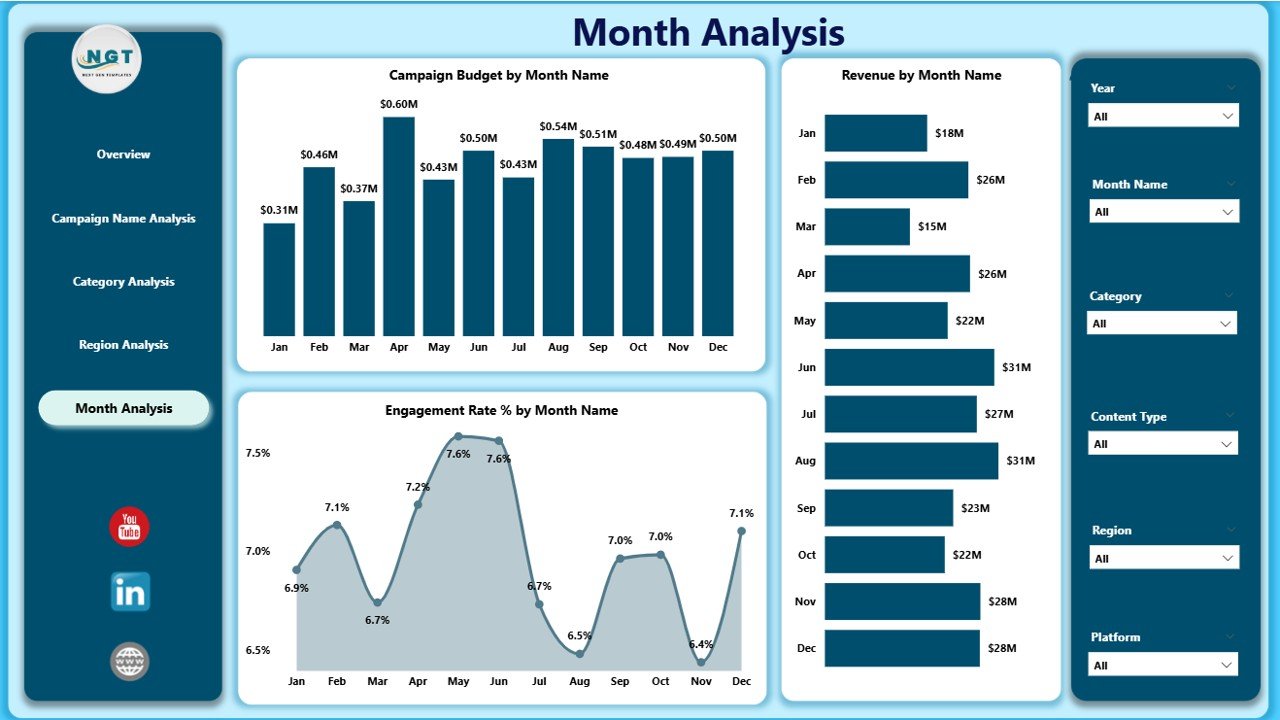
Campaign success often depends on timing. Festivals, product launches, and seasonal trends influence engagement.
Charts Available:
-
Campaign Budget by Month
-
Revenue by Month
-
Engagement Rate % by Month
Why Month Analysis Is Important
-
You identify seasonal spikes
-
You monitor campaign growth trends
-
You forecast future performance
As a result, you plan campaigns more strategically.
Advantages of Influencer Marketing Dashboard in Power BI
Now let us explore the major benefits.
1. Centralized Performance Tracking
You no longer switch between spreadsheets. Instead, you track everything in one interactive dashboard.
2. Real-Time Insights
Power BI refreshes data quickly. Therefore, you always see updated performance metrics.
3. Better Budget Control
You monitor campaign spending closely. Consequently, you prevent overspending.
4. Clear ROI Measurement
You compare budget with revenue easily. Thus, you calculate return on investment accurately.
5. Faster Decision-Making
You view interactive visuals instantly. As a result, you reduce reporting time.
6. Improved Strategy Planning
You analyze category, region, and campaign trends. Therefore, you plan future campaigns confidently.
Click to Purchases Influencer Marketing Dashboard in Power BI
Best Practices for Influencer Marketing Dashboard in Power BI
If you want maximum value, follow these best practices.
1. Define Clear KPIs
Before building the dashboard:
-
Set engagement benchmarks
-
Define target cost per conversion
-
Establish ROI expectations
Clear KPIs improve clarity.
2. Clean Your Data Regularly
Accurate data ensures accurate insights. Therefore:
-
Remove duplicates
-
Standardize platform names
-
Validate revenue entries
Clean data strengthens dashboard reliability.
3. Use Consistent Naming Conventions
Keep campaign names structured. For example:
-
Campaign_Q1_Instagram
-
Campaign_Festival_TikTok
Consistent naming improves filtering and analysis.
4. Monitor Engagement Along With Revenue
High revenue with low engagement signals future risk. Therefore, track both metrics together.
5. Review Dashboard Monthly
Schedule monthly performance reviews. Discuss trends with the marketing team. Adjust budgets accordingly.
How Does This Dashboard Improve ROI?
Let us break this down.
-
You identify top-performing campaigns quickly.
-
You stop low-return campaigns early.
-
You shift budget toward high-engagement categories.
-
You expand in profitable regions.
Consequently, you maximize revenue and minimize waste.
How Can Marketing Managers Use This Dashboard Effectively?
Marketing managers can:
-
Present visual reports to leadership
-
Justify budget increases
-
Track influencer performance transparently
-
Align campaign goals with revenue targets
Therefore, the dashboard strengthens communication and strategy alignment.
Common Mistakes to Avoid
Even with a dashboard, some mistakes occur.
-
Ignoring data refresh schedules
-
Focusing only on revenue
-
Overlooking cost per conversion
-
Not filtering by campaign
Avoid these errors to gain full value.
Conclusion: Why Should You Use an Influencer Marketing Dashboard in Power BI?
Influencer marketing continues to grow rapidly. However, without structured analytics, brands lose clarity. They waste budget. They miss opportunities.
An Influencer Marketing Dashboard in Power BI solves these challenges. It provides:
-
Real-time campaign insights
-
Clear ROI tracking
-
Budget visibility
-
Engagement analysis
-
Region and category performance breakdown
Therefore, if you want to improve influencer performance and increase marketing efficiency, this dashboard offers the perfect solution.
Frequently Asked Questions (FAQs)
1. What KPIs should I include in an Influencer Marketing Dashboard?
You should include:
-
Engagement Rate %
-
Campaign Budget
-
Revenue
-
Cost Per Conversion
-
ROI
-
Click-Through Rate
These KPIs give a complete performance picture.
2. How often should I update the dashboard?
You should update it weekly or monthly, depending on campaign frequency. Regular updates ensure accurate decisions.
3. Can small businesses use this dashboard?
Yes. Small businesses can use it to track limited campaigns effectively. In fact, it helps control budget better.
4. Why is Cost Per Conversion important?
Cost per conversion shows how much you spend to gain one customer. Therefore, it directly impacts profitability.
5. Can I customize this dashboard?
Yes. You can add new KPIs, filters, or visualizations based on your business goals.
Visit our YouTube channel to learn step-by-step video tutorials