In today’s digital world, cyber threats grow every single day. Hackers target systems. Data breaches increase. Compliance rules change frequently. Therefore, organizations must track security performance continuously. However, many IT teams still rely on scattered Excel sheets and manual reports. As a result, they miss critical risks and react too late.So, how can you monitor IT security audits, compliance levels, and risk indicators in one powerful system?You need an IT Security Auditing KPI Dashboard in Power BI.This ready-to-use dashboard helps you track key security KPIs, compare targets versus actual performance, and analyze trends across months and years. Moreover, it provides visual indicators that instantly show whether your security goals meet expectations.
Click to buy IT Security Auditing KPI Dashboard in Power BI
What Is an IT Security Auditing KPI Dashboard in Power BI?
An IT Security Auditing KPI Dashboard in Power BI is an interactive reporting solution that tracks security performance metrics in real time. It connects to structured Excel data and transforms raw numbers into meaningful insights.
Instead of reviewing static reports, decision-makers can:
- Monitor KPI performance month-to-date (MTD) and year-to-date (YTD)
- Compare current year performance with previous year data
- Identify missed targets quickly
- Drill through KPI definitions and formulas
- Analyze trends visually
Therefore, this dashboard improves transparency, accountability, and proactive risk management.
Why Does Every Organization Need an IT Security Auditing Dashboard?
Cybersecurity threats evolve constantly. Meanwhile, regulatory pressure increases. Therefore, organizations must measure performance consistently.
Without a dashboard:
- Teams struggle to track compliance gaps.
- Leaders lack visibility into audit performance.
- Security managers react instead of preventing issues.
However, with a KPI dashboard:
- You see risk indicators instantly.
- You track trends clearly.
- You improve audit efficiency.
- You strengthen governance.
As a result, your IT department becomes more strategic and proactive.
Key Features of IT Security Auditing KPI Dashboard in Power BI
This dashboard contains three interactive pages inside the Power BI Desktop application. Each page serves a specific purpose. Let us break them down clearly.
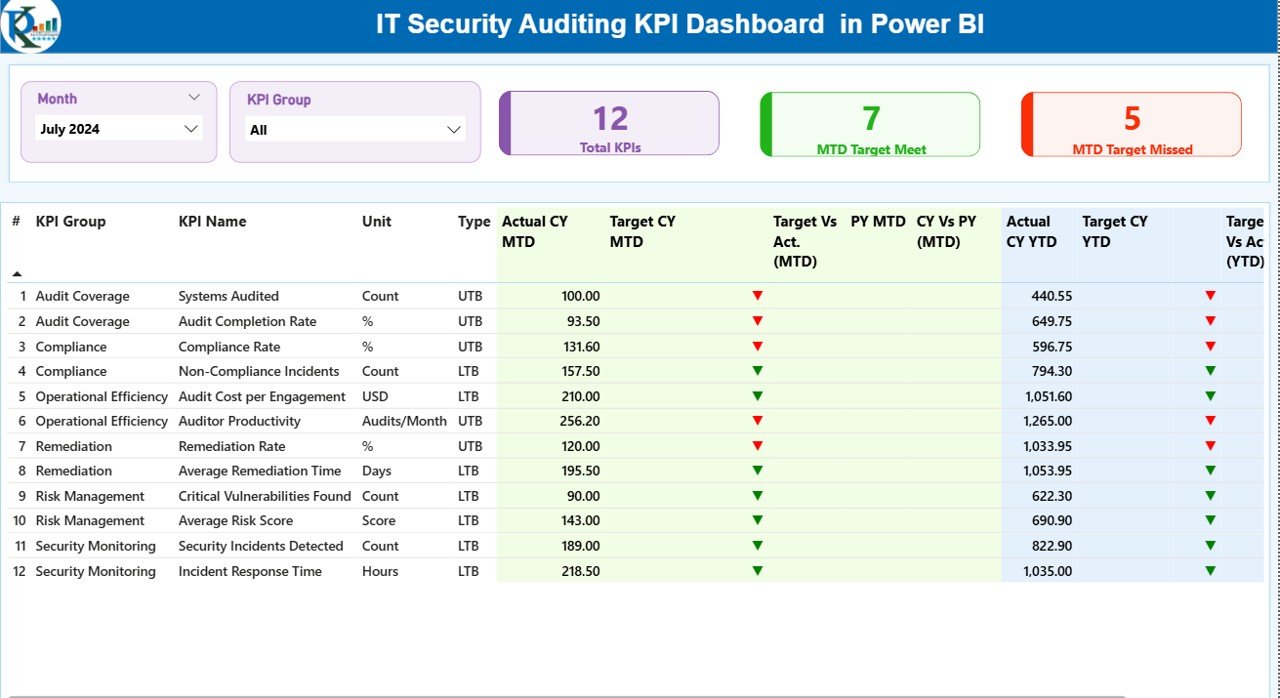
Summary Page – The Control Center
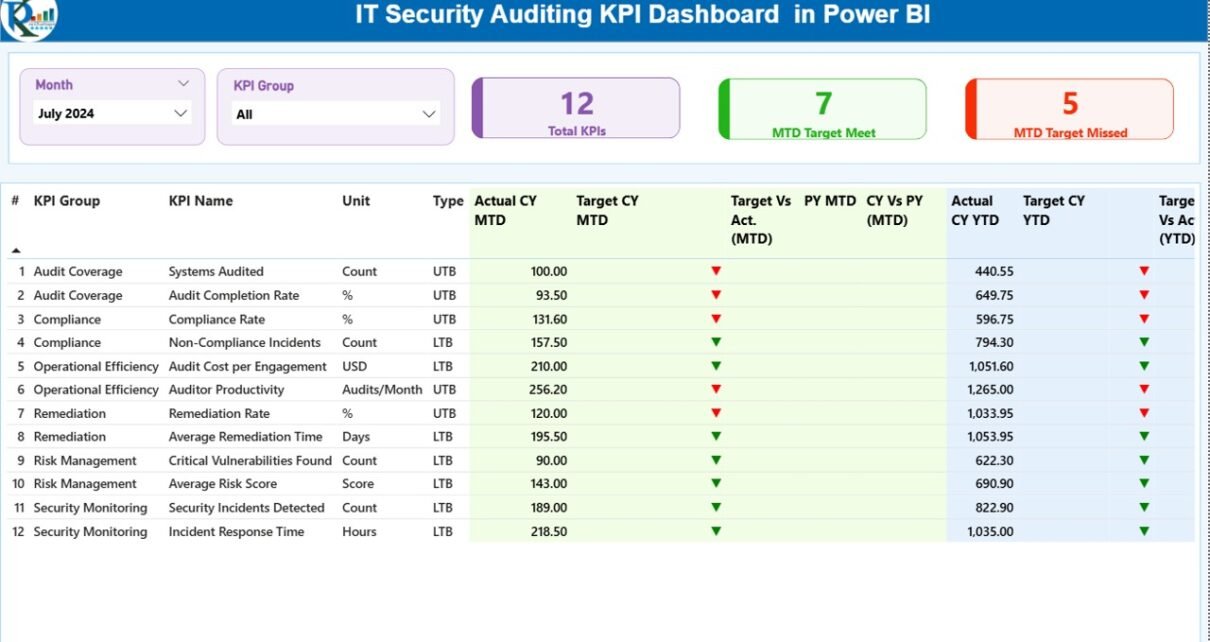
The Summary Page acts as the main control panel. It displays high-level KPI performance instantly.
What Do You See at the Top?
- Month Slicer
- KPI Group Slicer
These slicers allow users to filter data dynamically. Therefore, users can focus on a specific period or KPI category easily.
KPI Cards at a Glance
This page shows three powerful cards:
- Total KPIs Count
- MTD Target Meet Count
- MTD Target Missed Count
These cards immediately show overall performance health. Consequently, managers identify whether most KPIs stay on track.
Detailed KPI Table Breakdown
Below the cards, the dashboard shows a structured KPI table with the following columns:
- KPI Number
- KPI Group
- KPI Name
- Unit
- Type (LTB – Lower the Better / UTB – Upper the Better)
- Actual CY MTD
- Target CY MTD
- MTD Status Icon (▲ Green / ▼ Red)
- Target vs Actual (MTD %)
- PY MTD
- CY vs PY (MTD %)
- Actual CY YTD
- Target CY YTD
- YTD Status Icon
- Target vs Actual (YTD %)
- PY YTD
- CY vs PY (YTD %)
How Do These Calculations Work?
For example:
- Target vs Actual (MTD) = Actual MTD / Target MTD
- CY vs PY (MTD) = Current Year MTD / Previous Year MTD
- Target vs Actual (YTD) = Actual YTD / Target YTD
Therefore, the dashboard provides clear performance comparisons.
Moreover, visual icons instantly indicate whether performance exceeds or misses targets.
Click to buy IT Security Auditing KPI Dashboard in Power BI
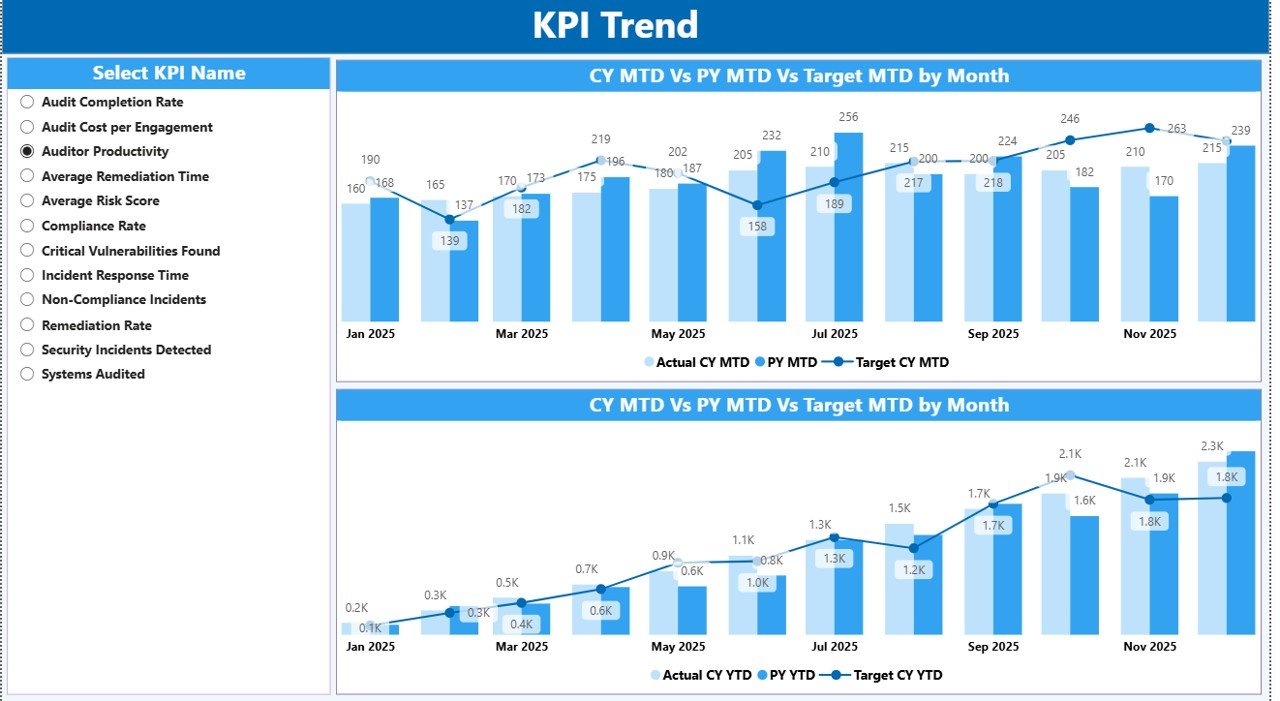
KPI Trend Page – Performance Over Time
While the summary shows current status, the Trend Page shows performance movement.
This page includes:
- Two combo charts:
MTD Actual vs Target vs Previous Year
YTD Actual vs Target vs Previous Year
- KPI Name Slicer (left side)
Therefore, users can select any KPI and analyze performance trends across time.
For example:
If “Incident Response Time” increases over months, the trend chart highlights it clearly. Consequently, managers can investigate root causes quickly.
Click to buy IT Security Auditing KPI Dashboard in Power BI
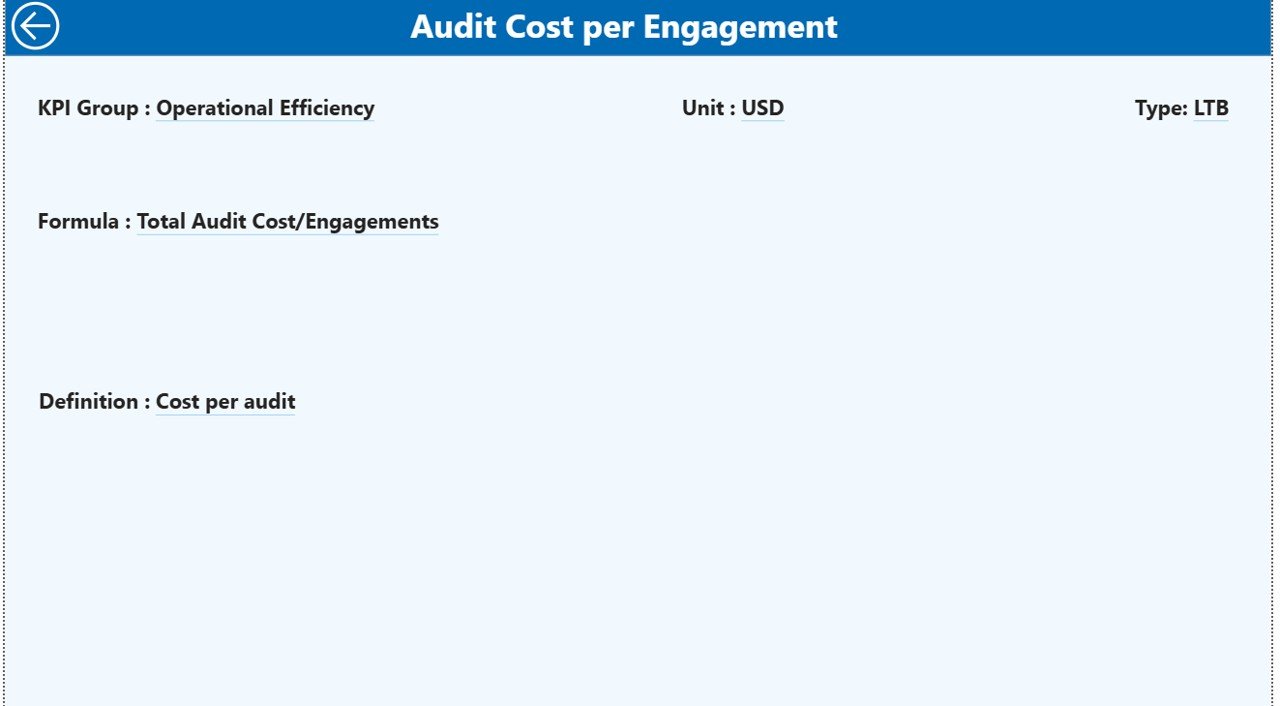
KPI Definition Page – Drill-Through Intelligence
This hidden page provides detailed KPI explanations.
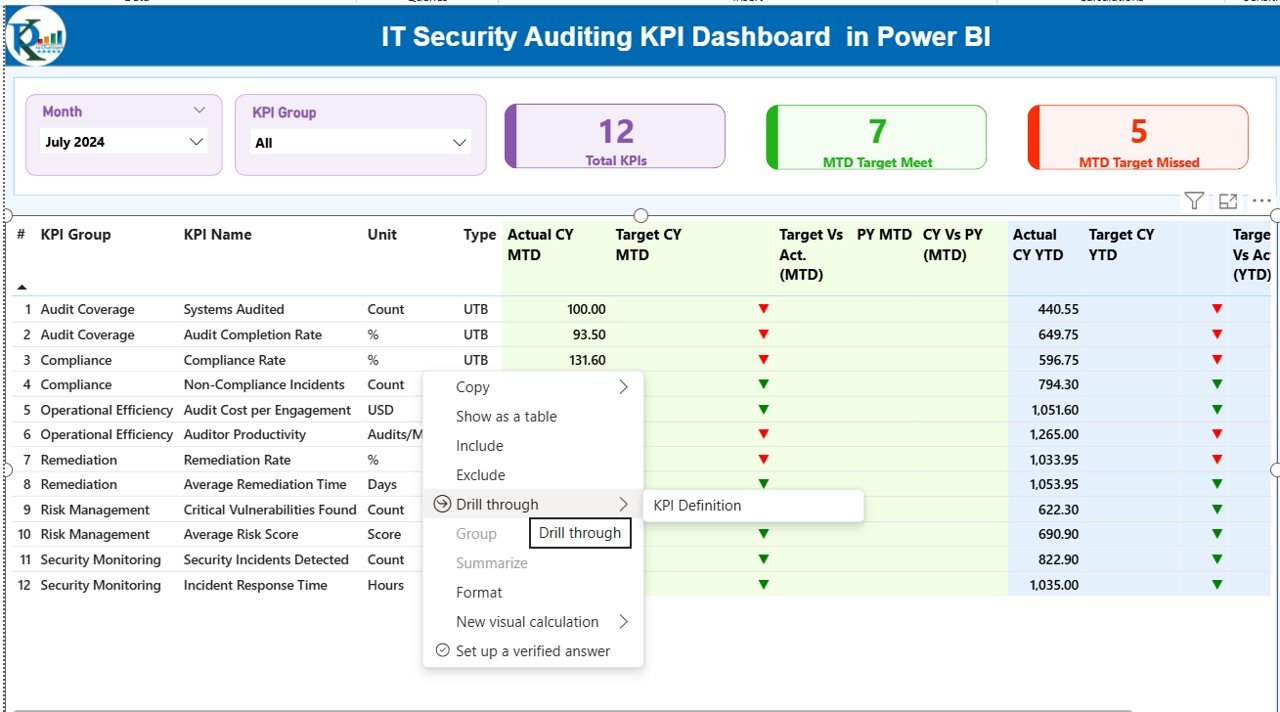
From the Summary Page, users can drill through and see:
- KPI Number
- KPI Group
- KPI Name
- Unit
- Formula
- Definition
- KPI Type (LTB or UTB)
Therefore, the dashboard does not only show numbers. It also explains logic behind each KPI.
Additionally, users can return to the main page easily by clicking the back button.
Click to buy IT Security Auditing KPI Dashboard in Power BI
How Does the Excel Data Structure Work?
The dashboard uses an Excel file as its data source. You only need to update three worksheets.
Input_Actual Sheet
In this sheet, you enter:
- KPI Name
- Month (first date of month)
- MTD number
- YTD number
Therefore, this sheet captures real performance.
Click to buy IT Security Auditing KPI Dashboard in Power BI
Input_Target Sheet
Here, you enter:
- KPI Name
- Month
- MTD Target
- YTD Target
Consequently, the dashboard compares actual numbers with targets automatically.
KPI Definition Sheet
In this sheet, you fill:
- KPI Number
- KPI Group
- KPI Name
- Unit
- Formula
- Definition
- Type (LTB or UTB)
Therefore, this sheet standardizes KPI documentation.
What KPIs Can You Track in an IT Security Auditing Dashboard?
You can track various audit and security KPIs such as:
- Number of Security Incidents
- Mean Time to Detect (MTTD)
- Mean Time to Respond (MTTR)
- Patch Compliance Rate
- Vulnerability Remediation Rate
- Audit Findings Closed
- Open Risk Items
- Phishing Simulation Failure Rate
- Access Review Completion Rate
- Compliance Score %
For example, if Patch Compliance Rate reaches 95% against a 90% target, the dashboard shows a green indicator instantly.
Advantages of IT Security Auditing KPI Dashboard in Power BI
Let us now explore the benefits clearly.
Real-Time Visibility
You see performance instantly. Therefore, you do not wait for manual reports.
Better Decision-Making
You compare trends across months and years. Consequently, you act based on data.
Improved Compliance Tracking
You monitor audit performance continuously. As a result, you reduce regulatory risk.
Faster Target Monitoring
You see green and red icons immediately. Therefore, you prioritize issues quickly.
Clear Documentation
You drill into KPI formulas and definitions easily. Thus, teams maintain clarity.
Historical Comparison
You compare current year vs previous year data. Therefore, you measure improvement effectively.
How Does This Dashboard Improve IT Governance?
Strong governance requires measurable performance. However, many organizations focus only on incident response.
Instead, this dashboard helps you:
- Monitor proactive controls
- Measure compliance levels
- Track audit progress
- Evaluate risk trends
- Improve accountability
Therefore, leadership gains structured oversight of security performance.
Best Practices for the IT Security Auditing KPI Dashboard
To maximize results, follow these best practices:
Define Clear KPIs
Choose measurable KPIs aligned with security strategy.
Update Data Monthly
Maintain consistency by updating actual and target data monthly.
Classify KPIs Correctly
Use LTB and UTB logic correctly. For example:
- Lower Incident Rate = Better
- Higher Compliance Rate = Better
Review Trends Quarterly
Analyze MTD and YTD trends quarterly to detect patterns.
Train Your Team
Ensure stakeholders understand how to interpret dashboard visuals.
Align with Compliance Standards
Map KPIs with ISO 27001, NIST, or SOC 2 requirements.
How Can Leadership Use This Dashboard Effectively?
Leadership teams can:
- Review monthly audit performance
- Identify underperforming KPI groups
- Allocate resources to risk areas
- Improve budgeting decisions
- Strengthen cybersecurity roadmap
Therefore, the dashboard supports both operational and strategic decisions.
How Does Power BI Enhance Security KPI Analysis?
Power BI adds strong visualization power:
- Interactive slicers
- Drill-through pages
- Conditional formatting
- Dynamic comparisons
- Clean visual layouts
As a result, complex audit data becomes easy to understand.
Who Can Benefit from This Dashboard?
This dashboard benefits:
- IT Security Managers
- Internal Audit Teams
- Compliance Officers
- CIOs and CTOs
- Risk Management Teams
- Managed Security Service Providers
Therefore, any organization that handles sensitive data can use it.
How to Implement the IT Security Auditing KPI Dashboard?
Follow these steps:
- Prepare KPI definitions.
- Fill Excel data sheets.
- Connect Excel file to Power BI.
- Refresh data monthly.
- Review performance with stakeholders.
- Improve KPIs based on insights.
Therefore, implementation remains simple and structured.
Conclusion
Cybersecurity never slows down. Risks evolve daily. Therefore, organizations must track security performance consistently and clearly.
The IT Security Auditing KPI Dashboard in Power BI transforms complex audit data into clear insights. It helps teams monitor MTD and YTD performance, compare historical trends, and identify missed targets instantly.
Moreover, it strengthens governance, improves compliance, and enhances accountability. Therefore, if you want better visibility, faster decisions, and stronger security control, this dashboard becomes an essential tool.
Frequently Asked Questions (FAQs)
What is the purpose of an IT Security Auditing KPI Dashboard?
It helps organizations monitor security performance, track compliance metrics, and compare targets versus actual results in real time.
What does LTB and UTB mean?
LTB means “Lower the Better.” For example, fewer incidents indicate better performance.
UTB means “Upper the Better.” For example, higher compliance rate shows better performance.
How often should I update the dashboard?
You should update the dashboard monthly. However, some organizations update it weekly for critical KPIs.
Can I customize the KPIs?
Yes. You can define your own KPIs in the KPI Definition sheet based on your security framework.
Does this dashboard support year-over-year comparison?
Yes. It compares Current Year vs Previous Year for both MTD and YTD values.
Who should use this dashboard?
Security managers, compliance teams, auditors, and IT leaders should use it regularly.
Visit our YouTube channel to learn step-by-step video tutorials
Watch the step-by-step video tutorial:
Click to buy IT Security Auditing KPI Dashboard in Power BI