Market research drives every successful business decision. Companies that understand customer needs, pricing sensitivity, satisfaction levels, and regional trends always stay ahead of competitors. However, raw survey data in Excel sheets often feels confusing and time-consuming to analyze. Therefore, businesses need a structured and visual solution.
That is exactly where a Market Research Dashboard in Excel becomes essential.
In this detailed guide, you will learn what a Market Research Dashboard in Excel is, why it matters, how it works, its page structure, key features, advantages, best practices, and frequently asked questions. Moreover, this article explains how a ready-to-use Excel dashboard converts survey data into clear insights that support confident and faster decisions.
Click to Purchases Market Research Dashboard in Excel
What Is a Market Research Dashboard in Excel?
A Market Research Dashboard in Excel is an interactive and visual reporting tool that consolidates survey and research data into charts, KPIs, and summary cards. Instead of scrolling through thousands of rows, decision-makers view customer feedback, satisfaction scores, price sensitivity, and survey costs in one place.
Moreover, this dashboard uses slicers, charts, and summary cards to help users filter data by industry, product, country, customer segment, and month. As a result, teams understand trends quickly and act confidently.
Because Excel remains widely used, this dashboard works without advanced tools or expensive software. Therefore, analysts, marketers, and business owners prefer it.
Why Do Businesses Need a Market Research Dashboard in Excel?
Market research produces large volumes of data. However, data alone does not deliver value. Insights drive value.
Here is why businesses rely on a Market Research Dashboard in Excel:
-
It converts survey responses into visual insights
-
It highlights customer satisfaction and loyalty trends
-
It tracks price sensitivity across products and regions
-
It monitors survey costs and response time
-
It supports data-driven marketing and product decisions
Additionally, Excel dashboards allow teams to update data easily without rebuilding reports. Consequently, insights stay current.
How Does a Market Research Dashboard in Excel Work?
A Market Research Dashboard in Excel works by connecting structured survey data to pivot tables, charts, and slicers. Users update the data sheet, and the dashboard refreshes automatically.
Core Components of the Dashboard
-
Data Sheet – Stores raw survey and research data
-
Support Sheet – Contains helper tables, calculations, and mappings
-
Dashboard Pages – Show KPIs, charts, and slicers
Because of this structure, the dashboard remains clean, flexible, and scalable.
Key Features of the Market Research Dashboard in Excel
This ready-to-use Market Research Dashboard in Excel includes carefully designed features that simplify analysis and storytelling.
Page Navigator
The Page Navigator, located on the left side, allows users to switch between analytical pages easily. Therefore, users move from overview to detailed analysis without confusion.
Interactive Slicers
Each dashboard page includes right-side slicers. These slicers filter data by industry, product, country, customer segment, survey channel, and month. As a result, users explore insights dynamically.
KPI Cards and Visual Charts
The dashboard uses KPI cards and charts to highlight performance metrics clearly. Consequently, decision-makers identify trends within seconds.
Dashboard Structure: 5 Powerful Analytical Pages
This Market Research Dashboard in Excel includes 5 structured analytical pages, each designed for a specific perspective.
What Insights Does the Overview Page Provide?

The Overview Page serves as the main summary page of the dashboard. It gives a high-level view of customer feedback and survey performance.
Overview Page Features
-
Right-side slicers for quick filtering
-
Four KPI-driven charts
Charts on the Overview Page
-
Net Promoter Score by Customer Segment
Shows customer loyalty across different segments. -
Price Sensitivity Score by Survey Channel
Reveals how pricing perception changes by channel. -
Customer Satisfaction Score by Region
Highlights satisfaction levels across regions. -
Survey Cost by Product
Tracks the cost of conducting surveys for each product.
Because of this structure, leaders quickly understand overall market sentiment.
How Does Industry Analysis Improve Market Understanding?
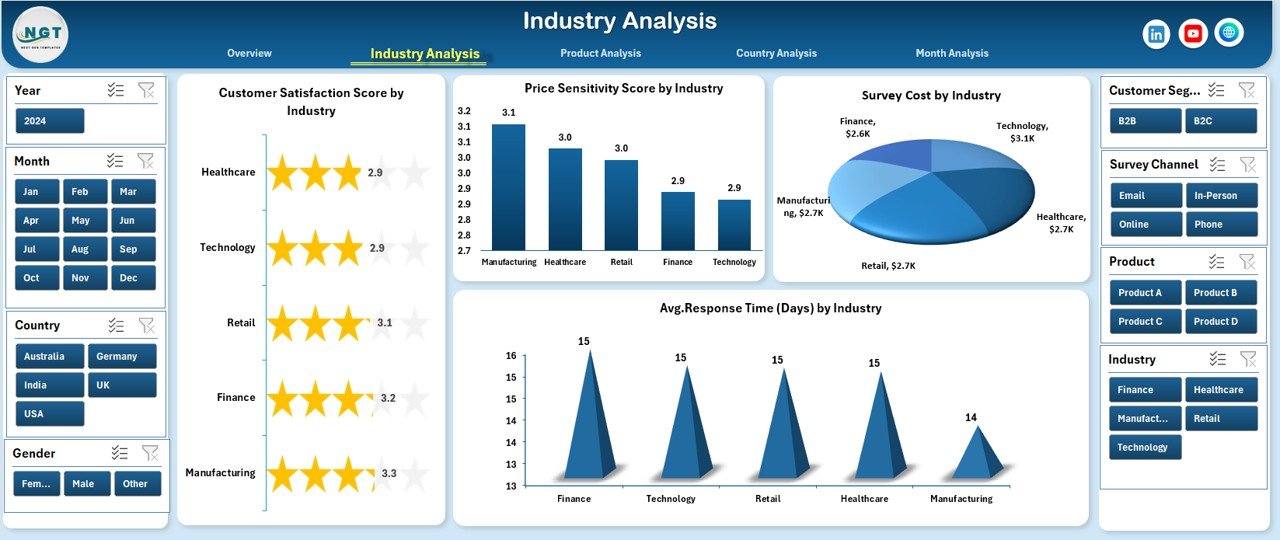
The Industry Analysis Page focuses on performance comparisons across industries. Therefore, it helps businesses identify strong and weak industry segments.
Industry Analysis Page Features
-
Right-side slicers for industry-specific filtering
-
Four comparative charts
Charts on the Industry Analysis Page
-
Customer Satisfaction Score by Industry
-
Price Sensitivity Score by Industry
-
Survey Cost by Industry
-
Average Response Time by Industry
As a result, companies optimize strategies for industries that show low satisfaction or high costs.
Why Is Product Analysis Important in Market Research?
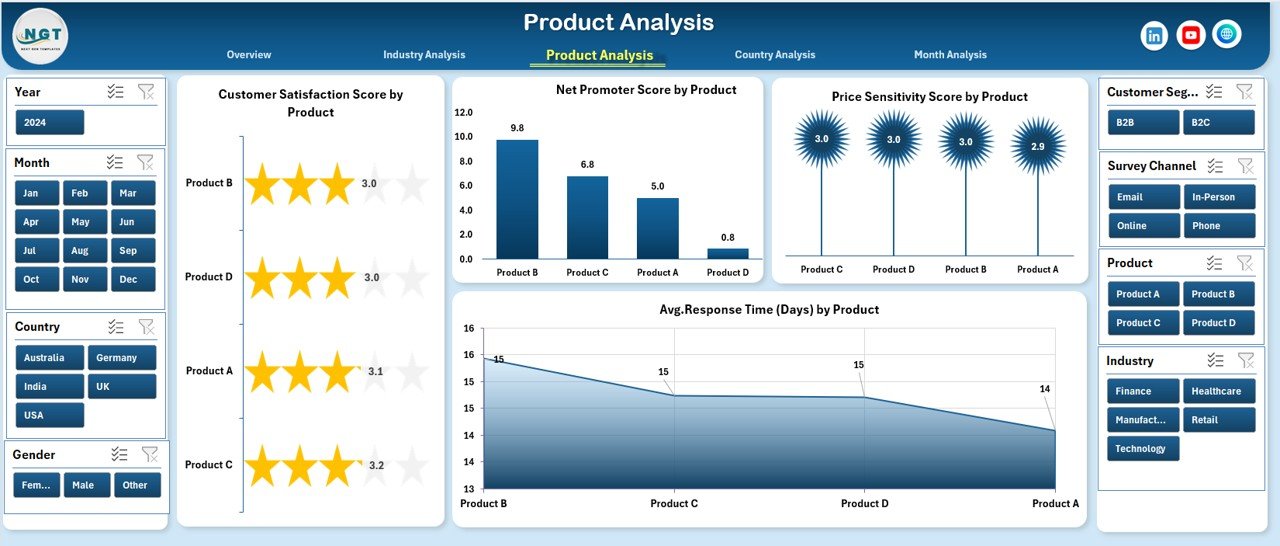
Products drive revenue. Therefore, understanding customer perception at the product level becomes critical.
The Product Analysis Page reveals how customers feel about individual products.
Product Analysis Page Features
-
Right-side slicers for focused product analysis
-
Four detailed charts
Charts on the Product Analysis Page
-
Customer Satisfaction Score by Product
-
Net Promoter Score by Product
-
Price Sensitivity Score by Product
-
Average Response Time by Product
-
Click to Purchases Market Research Dashboard in Excel
With these insights, teams improve product features, pricing strategies, and customer experience.
How Does Country Analysis Support Global Strategy?
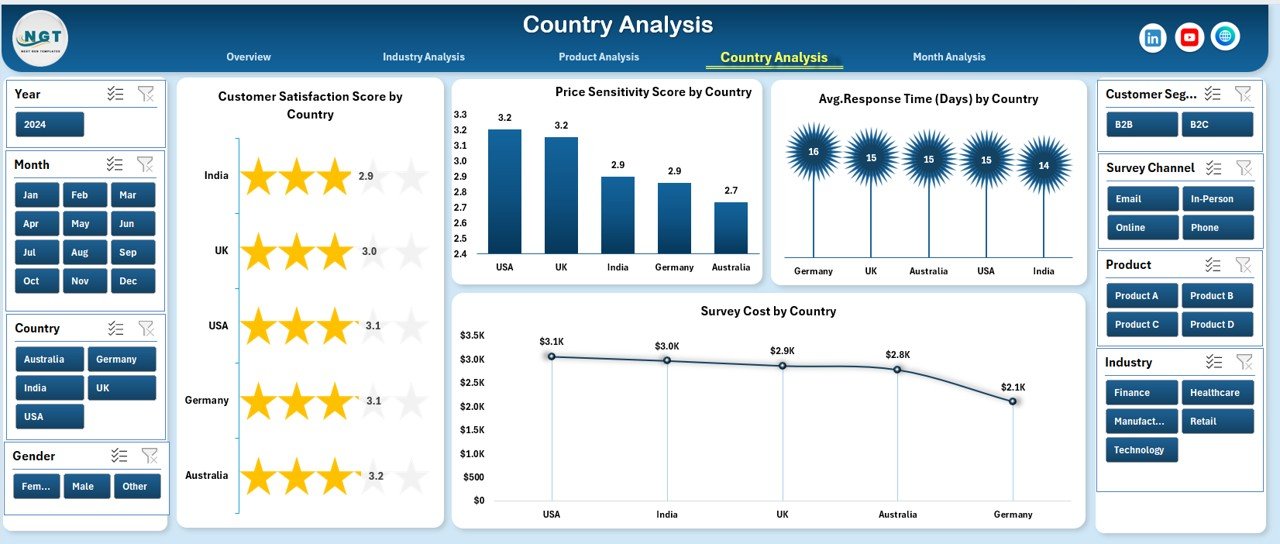
Businesses operating across regions must understand geographical differences. The Country Analysis Page provides that clarity.
Country Analysis Page Features
-
Right-side slicers for country selection
-
Four location-based charts
Charts on the Country Analysis Page
-
Customer Satisfaction Score by Country
-
Price Sensitivity Score by Country
-
Average Response Time by Country
-
Survey Cost by Country
Consequently, global teams align marketing and pricing strategies region-wise.
What Trends Does the Month Analysis Page Reveal?

Trends over time shape strategic decisions. The Month Analysis Page tracks monthly movement in key metrics.
Month Analysis Page Features
-
Right-side slicers for time filtering
-
Three trend charts
Charts on the Month Analysis Page
-
Price Sensitivity Score by Month
-
Average Response Time by Month
-
Survey Cost by Month
Because of these visuals, businesses spot seasonal trends and adjust campaigns proactively.
What Data Is Required for the Market Research Dashboard in Excel?
A well-structured Data Sheet powers the entire dashboard.
Typical Columns in the Data Sheet
-
Survey Date
-
Month
-
Customer Segment
-
Industry
-
Product
-
Country
-
Region
-
Survey Channel
-
Customer Satisfaction Score
-
Net Promoter Score
-
Price Sensitivity Score
-
Survey Cost
-
Response Time
Additionally, a Support Sheet stores helper calculations, mappings, and KPI thresholds.
Advantages of Market Research Dashboard in Excel
A Market Research Dashboard in Excel delivers multiple business advantages.
Key Advantages
-
📊 Clear visualization of survey data
-
⚡ Faster decision-making
-
💰 Cost-effective reporting solution
-
🔄 Easy data refresh and updates
-
🎯 Focused insights by slicers
-
📈 Better tracking of satisfaction and loyalty
Because of these benefits, organizations improve both strategy and execution.
Click to Purchases Market Research Dashboard in Excel
Who Should Use a Market Research Dashboard in Excel?
This dashboard supports a wide range of professionals.
Ideal Users
-
Market research analysts
-
Marketing managers
-
Product managers
-
Business owners
-
Strategy consultants
-
Customer experience teams
Moreover, startups and enterprises benefit equally because Excel scales easily.
How Does This Dashboard Improve Decision-Making?
This dashboard transforms raw feedback into actionable insights. Therefore, teams identify what works and what needs improvement.
Decision Areas Supported
-
Pricing strategy optimization
-
Product improvement planning
-
Regional marketing focus
-
Customer loyalty initiatives
-
Survey budget management
As a result, leaders rely on facts instead of assumptions.
Best Practices for the Market Research Dashboard in Excel
Following best practices ensures accuracy and long-term usability.
Best Practices
-
Keep the data sheet clean and structured
-
Use consistent scoring scales across surveys
-
Refresh data regularly
-
Avoid manual chart edits
-
Use slicers instead of filters
-
Validate KPI calculations frequently
Because of these practices, dashboards remain reliable and insightful.
Common Challenges and How to Overcome Them
Even powerful dashboards face challenges. However, simple solutions exist.
Common Challenges
-
Inconsistent survey formats
-
Missing or duplicate data
-
Overloaded visuals
-
Slow performance with large datasets
Practical Solutions
-
Standardize survey templates
-
Use data validation rules
-
Limit visuals to meaningful KPIs
-
Optimize pivot tables
Therefore, dashboards stay efficient and accurate.
Why Excel Remains a Strong Choice for Market Research Dashboards
Excel continues to dominate analytics tools because it balances power and simplicity.
Click to Purchases Market Research Dashboard in Excel
Reasons Excel Works Well
-
Widely available and familiar
-
Strong charting and pivot features
-
Easy integration with surveys
-
Flexible customization options
As a result, teams avoid expensive BI tools without sacrificing insights.
Final Thoughts: Is a Market Research Dashboard in Excel Worth It?
Absolutely.
A Market Research Dashboard in Excel simplifies complex survey data and delivers clear, actionable insights. It helps businesses understand customers, optimize pricing, control survey costs, and track satisfaction trends—all from one file.
Moreover, its ready-to-use structure saves time, improves clarity, and supports smarter decisions. Therefore, any organization serious about market insights should use this dashboard.
Frequently Asked Questions (FAQs)
What is a Market Research Dashboard in Excel used for?
It analyzes survey and customer feedback data using charts, KPIs, and slicers to support better decisions.
Can beginners use this Excel dashboard?
Yes. The dashboard uses simple Excel features and intuitive navigation.
How often should data be updated?
Ideally, update data weekly or monthly depending on survey frequency.
Does this dashboard support multiple countries and products?
Yes. It includes country, product, industry, and month-wise analysis.
Can I customize the dashboard?
Yes. You can add new KPIs, charts, or slicers based on business needs.
Is Excel better than BI tools for market research?
Excel works best for small to mid-scale research due to flexibility and low cost.
Visit our YouTube channel to learn step-by-step video tutorials