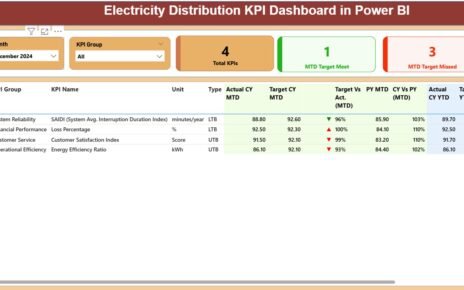
In today’s energy-driven economy, electricity distribution companies rely on timely insights to manage operations, track efficiency, and ensure service reliability.
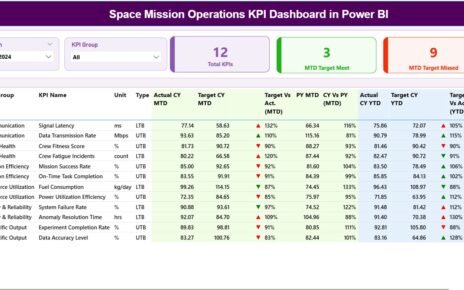
Space missions are among the most complex undertakings of humankind. From launching satellites and monitoring spacecraft to analyzing mission performance
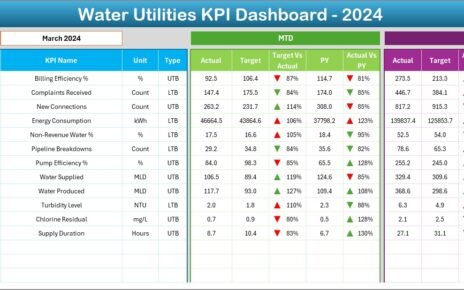
Managing a water utility system is not simple. You track water production, distribution losses, customer complaints, revenue, maintenance tasks, water