Strategic partnerships drive growth. However, many businesses still track alliances using scattered Excel files, email reports, and manual summaries. As a result, leaders struggle to measure partner performance, revenue contribution, contract value, and customer satisfaction clearly.
So, how can you monitor all partner activities in one structured system?
The answer is simple.
You need a Partner Alliances Dashboard in Excel.
Click to Purchases Partner Alliances Dashboard in Excel
This ready-to-use Excel dashboard helps you track revenue, leads, contract value, active alliances, and satisfaction scores in one interactive file. Moreover, it allows you to analyze performance by partner type, partnership tier, industry, region, and month — all using Pivot Tables and Pivot Charts.
In this detailed guide, you will learn:
-
What a Partner Alliances Dashboard in Excel is
-
Why businesses need it
-
A complete explanation of all 5 dashboard pages
-
What data you should track
-
Advantages of Partner Alliances Dashboard in Excel
-
Best Practices for the Partner Alliances Dashboard
-
Frequently Asked Questions with Answers
Let us explore everything step by step.
What Is a Partner Alliances Dashboard in Excel?
A Partner Alliances Dashboard in Excel is a structured performance tracking system that helps organizations monitor strategic partnerships in a clear and visual way.
Instead of reviewing raw data, you get:
-
KPI Cards
-
Dynamic Pivot Charts
-
Slicers for filtering
-
Automated summaries
-
Multi-page analysis
Because Excel supports Pivot Tables, you can build powerful analytics without complex tools. Therefore, teams can update data in the Data Sheet, and the dashboard automatically reflects changes.
As a result, decision-makers gain real-time insights without spending hours preparing reports.
Why Do Businesses Need a Partner Alliances Dashboard?
Strategic alliances influence revenue, market expansion, and customer growth. However, if you do not measure them properly, you lose control over performance.
Businesses need this dashboard because:
-
Partnerships generate significant revenue.
-
Account managers require clear performance visibility.
-
Leaders must identify high-performing partner types.
-
Companies want to monitor satisfaction levels.
-
Teams need monthly growth analysis.
Moreover, without structured tracking, you cannot compare partnership tiers or industries effectively. Therefore, this dashboard ensures complete transparency.
Structure of the Partner Alliances Dashboard in Excel
This dashboard contains 5 interactive analytical pages along with Support and Data Sheets. Additionally, a Page Navigator on the left side allows easy movement across all pages.
Let us understand each page in detail.
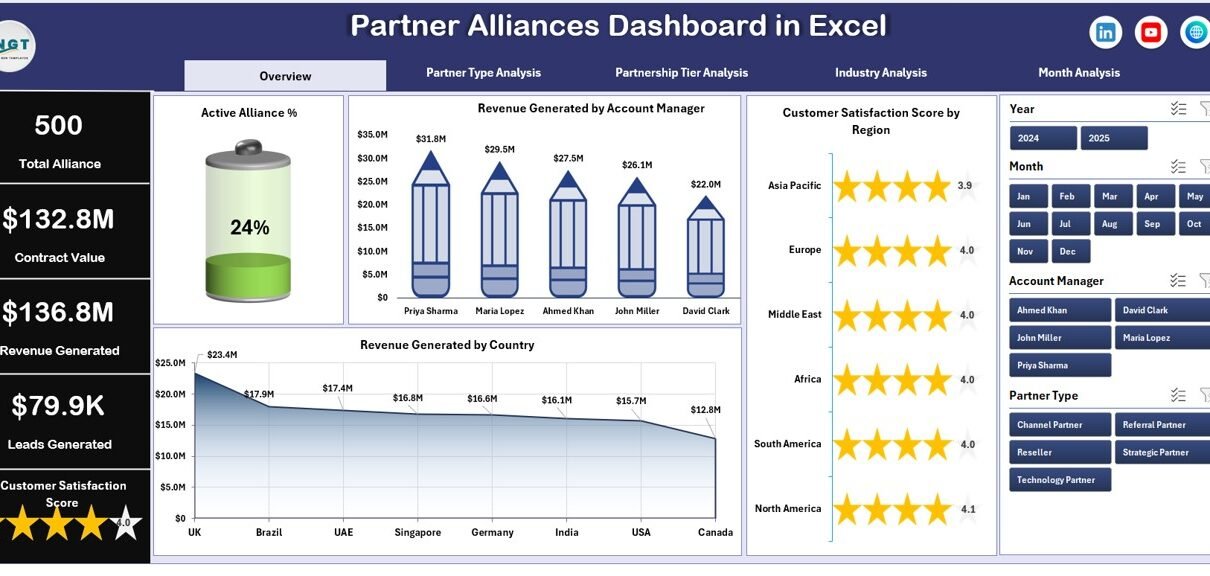
1️⃣ Overview Page – What Does It Show?
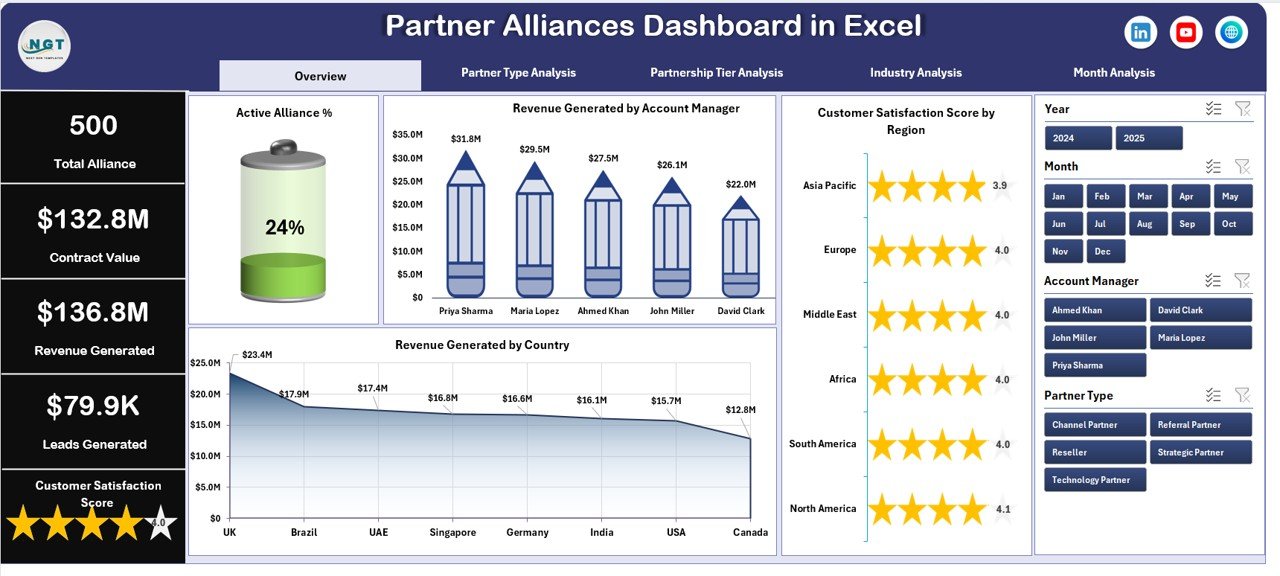
The Overview Page acts as the command center of the dashboard.
On the right side, you will find slicers (filters). These allow you to filter data by:
-
Month
-
Region
-
Account Manager
-
Partner Type
-
Industry
KPI Cards on Overview Page
The dashboard includes 4 KPI cards, such as:
-
Active Alliance %
-
Total Revenue Generated
-
Average Customer Satisfaction Score
-
Total Contract Value
These cards provide instant insights. Therefore, executives can understand performance within seconds.
Charts on Overview Page
The page includes 4 Pivot Charts:
-
Active Alliance %
Shows percentage of active partnerships. -
Revenue Generated by Account Manager
Helps evaluate manager performance. -
Customer Satisfaction Score by Region
Identifies high-performing regions. -
Revenue Generated by Country
Shows geographical revenue contribution.
As a result, leadership teams can quickly spot trends and gaps.
2️⃣ Partner Type Analysis – Which Partner Type Performs Best?
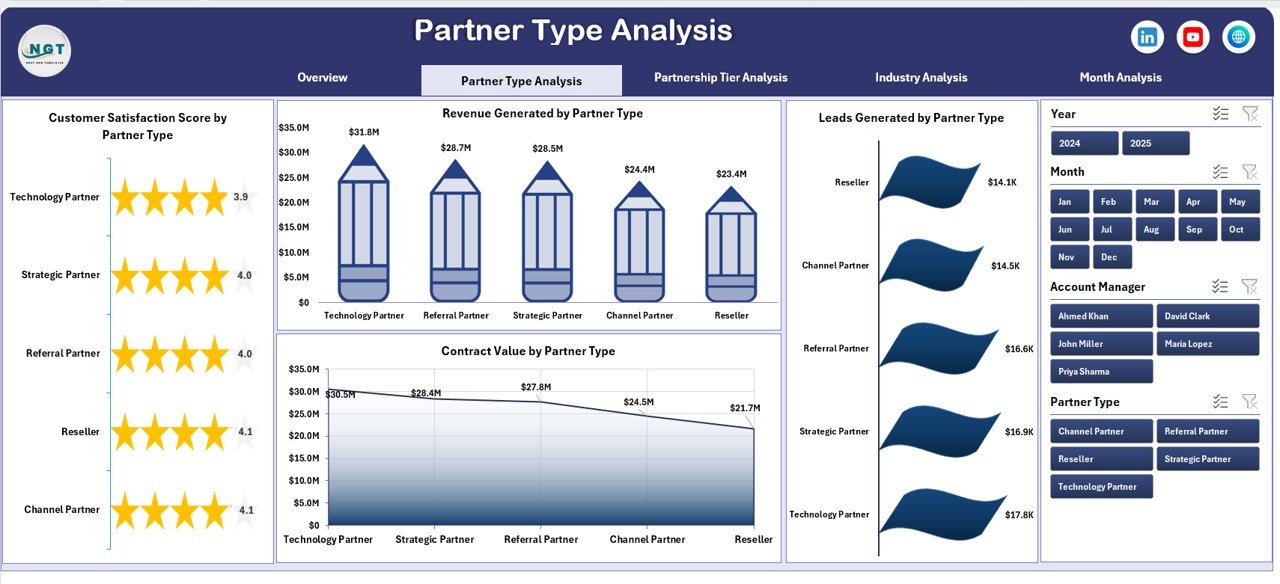
Not all partner types deliver equal value. Therefore, this page analyzes performance by partner category.
On the right side, slicers allow dynamic filtering.
Charts on Partner Type Analysis
-
Revenue Generated by Partner Type
-
Customer Satisfaction Score by Partner Type
-
Leads Generated by Partner Type
-
Contract Value by Partner Type
Because of this breakdown, you can identify:
-
Resellers generating high revenue
-
Technology partners driving leads
-
Strategic partners with strong contract values
Consequently, businesses can adjust partner strategies accordingly.
3️⃣ Partnership Tier Analysis – How Do Tiers Impact Revenue?
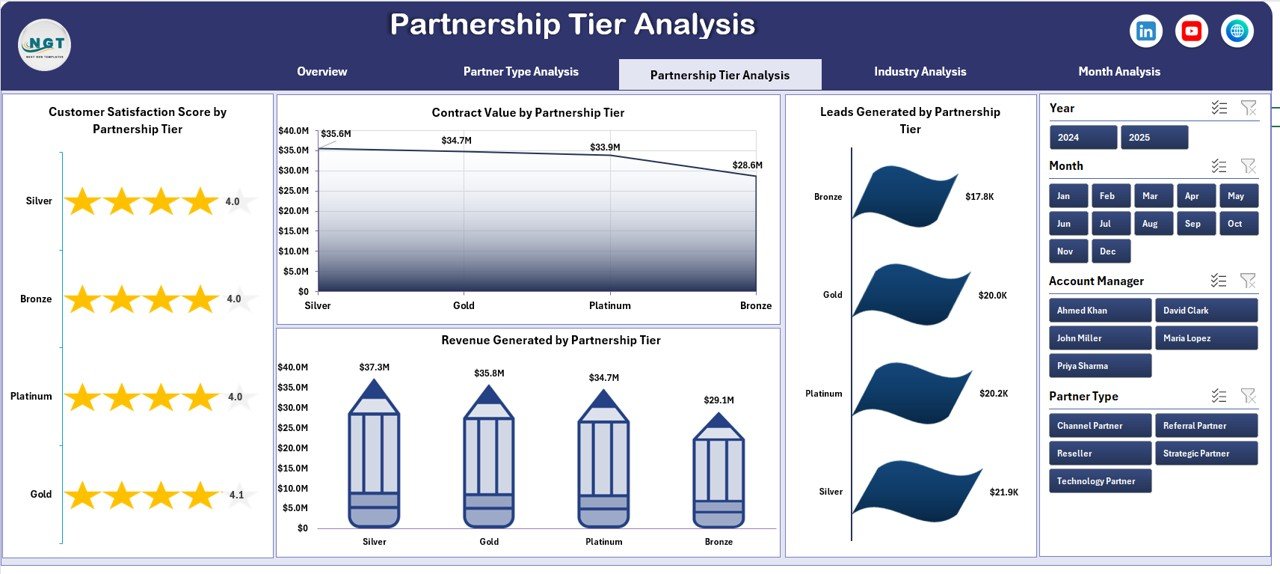
Most companies classify partners into tiers such as:
-
Platinum
-
Gold
-
Silver
-
Bronze
However, leaders often fail to analyze performance by tier. Therefore, this page solves that problem.
Charts on Partnership Tier Analysis
-
Revenue Generated by Partnership Tier
-
Customer Satisfaction Score by Partnership Tier
-
Leads Generated by Partnership Tier
-
Contract Value by Partnership Tier
This page helps you:
-
Reward top-tier partners
-
Improve low-tier performance
-
Design better incentive plans
As a result, you create a balanced partner ecosystem.
Click to Purchases Partner Alliances Dashboard in Excel
4️⃣ Industry Analysis – Which Industry Drives Growth?
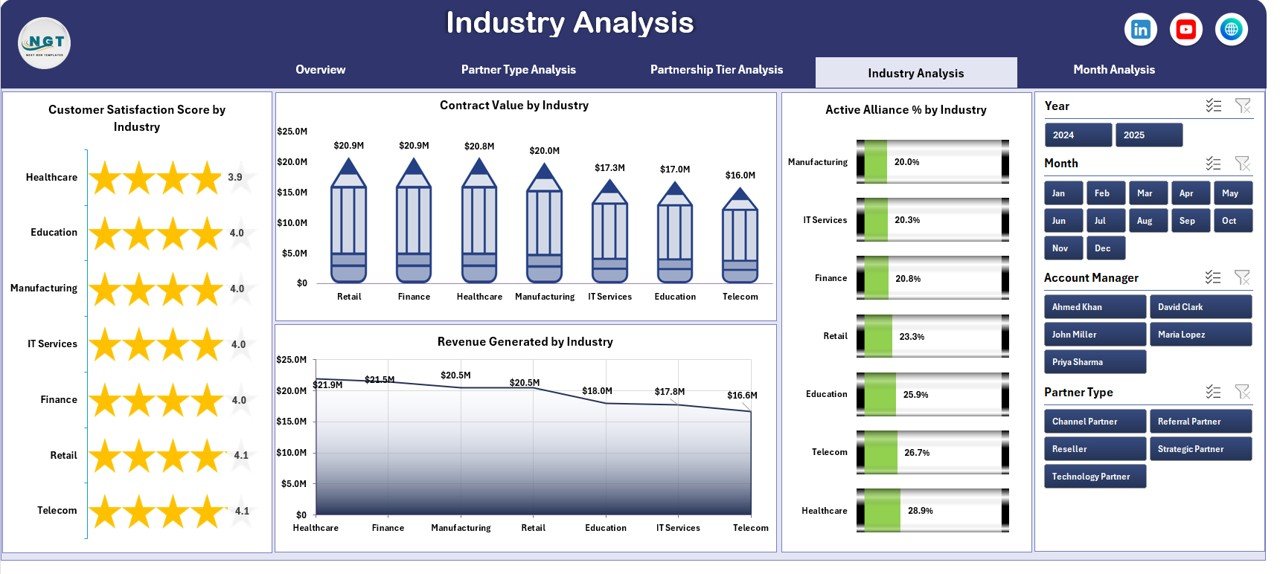
Different industries generate different levels of revenue and engagement. Therefore, this page focuses on industry-based performance.
Charts on Industry Analysis
-
Revenue Generated by Industry
-
Customer Satisfaction Score by Industry
-
Contract Value by Industry
-
Active Alliance % by Industry
Because of this analysis, businesses can:
-
Target high-performing industries
-
Improve low-engagement sectors
-
Allocate resources wisely
Thus, you build stronger market positioning.
5️⃣ Month Analysis – How Does Performance Change Over Time?
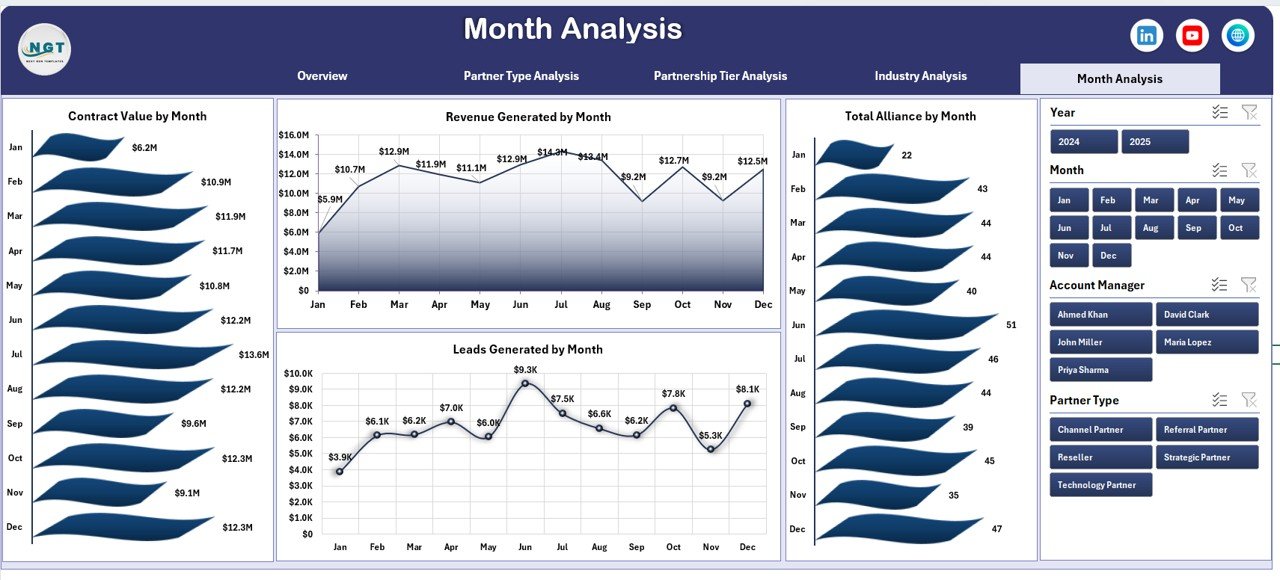
Growth trends matter. Therefore, this page tracks monthly performance.
Charts on Month Analysis
-
Revenue Generated by Month
-
Total Alliances by Month
-
Contract Value by Month
-
Leads Generated by Month
With this page, you can:
-
Identify seasonal growth
-
Monitor campaign impact
-
Evaluate monthly targets
As a result, you maintain steady growth tracking.
What Data Should You Capture in the Data Sheet?
The Data Sheet acts as the foundation of the dashboard. You must structure it properly.
Important Columns in Data Sheet:
-
Date
-
Month
-
Year
-
Partner Name
-
Partner Type
-
Partnership Tier
-
Industry
-
Country
-
Region
-
Account Manager
-
Revenue Generated
-
Contract Value
-
Leads Generated
-
Customer Satisfaction Score
-
Alliance Status (Active/Inactive)
Once you update this sheet, Pivot Tables refresh automatically.
Support Sheet – Why Is It Important?
The Support Sheet stores:
-
Master lists
-
Drop-down values
-
KPI definitions
-
Calculation formulas
Because of this structure, the dashboard remains clean and organized.
Advantages of Partner Alliances Dashboard in Excel
Now let us explore the key advantages.
1️⃣ Improves Decision-Making
Leaders make faster decisions because the dashboard shows visual insights instantly.
2️⃣ Saves Reporting Time
Instead of preparing monthly reports manually, you refresh Pivot Tables in seconds.
3️⃣ Enhances Transparency
Everyone sees the same numbers. Therefore, accountability improves.
4️⃣ Tracks Revenue Clearly
You identify which partners generate maximum revenue.
5️⃣ Improves Partner Management
You reward high-performing partners and support low-performing ones.
6️⃣ Supports Growth Strategy
You analyze industries, tiers, and regions effectively.
Best Practices for the Partner Alliances Dashboard
Click to Purchases Partner Alliances Dashboard in Excel
To maximize results, follow these best practices.
1️⃣ Keep Data Clean
Remove duplicates and errors before updating the Data Sheet.
2️⃣ Update Data Monthly
Regular updates ensure accurate reports.
3️⃣ Use Consistent Naming
Avoid spelling variations in partner names.
4️⃣ Protect Formula Cells
Lock dashboard formulas to avoid accidental edits.
5️⃣ Use Slicers Properly
Encourage users to filter data instead of editing charts.
6️⃣ Review KPIs Quarterly
Adjust KPIs according to business goals.
How Can You Build This Dashboard Using Pivot Tables?
Follow these steps:
-
Create a structured Data Table.
-
Insert Pivot Tables for each analysis page.
-
Insert Pivot Charts for visual presentation.
-
Add slicers for filtering.
-
Create KPI cards using GETPIVOTDATA formulas.
-
Design a Page Navigator using hyperlinks.
Because Excel offers flexibility, you can customize the layout easily.
Who Can Benefit from Partner Alliances Dashboard in Excel?
This dashboard helps:
-
Business Development Teams
-
Alliance Managers
-
Sales Leaders
-
Strategic Partnership Teams
-
Executives and Directors
-
Channel Sales Managers
Therefore, any organization managing partnerships can use it.
How Does This Dashboard Improve ROI?
When you track:
-
Revenue
-
Contract value
-
Leads
-
Satisfaction
You improve strategy. Consequently, you increase ROI through better partner selection and performance tracking.
Conclusion
Strategic partnerships shape business growth. However, without structured tracking, you lose visibility and control.
The Partner Alliances Dashboard in Excel solves this problem. It centralizes revenue tracking, partner analysis, industry insights, and monthly performance into one powerful system.
Moreover, it simplifies reporting, improves transparency, and supports strategic decisions.
If you want clarity, growth, and control over your alliances, this dashboard becomes your ultimate management tool.
Frequently Asked Questions with Answers
1️⃣ What is a Partner Alliances Dashboard in Excel?
It is an Excel-based performance tracking tool that monitors revenue, leads, contract value, and partner performance using Pivot Tables and charts.
2️⃣ Do I need advanced Excel skills to use this dashboard?
No. You only need basic Excel knowledge to update data and refresh Pivot Tables.
3️⃣ Can I customize the KPIs?
Yes. You can modify KPI cards and Pivot Tables according to your business needs.
4️⃣ How often should I update the data?
You should update data monthly. However, you can update it weekly if required.
5️⃣ Can small businesses use this dashboard?
Yes. Small and medium businesses can use it easily because Excel provides flexibility.
6️⃣ Does this dashboard support multi-country analysis?
Yes. The Country and Region columns allow global performance tracking.
7️⃣ Why should I use Excel instead of complex BI tools?
Excel offers flexibility, low cost, and easy customization. Therefore, many businesses prefer it for partnership tracking.
Visit our YouTube channel to learn step-by-step video tutorials