The petrochemical industry operates in a highly competitive and performance-driven environment. Companies must monitor production efficiency, operational reliability, safety compliance, cost control, and financial performance continuously. However, many organizations still rely on scattered Excel reports and manual analysis. As a result, decision-makers often struggle to identify performance gaps quickly.Therefore, businesses now move toward data-driven performance monitoring systems. One of the most effective solutions is a Petrochemicals KPI Dashboard in Power BI.In this detailed guide, you will learn everything about the Petrochemicals KPI Dashboard in Power BI — including its structure, features, benefits, implementation approach, best practices, and frequently asked questions.
Click to buy Petrochemicals KPI Dashboard in Power BI
What Is a Petrochemicals KPI Dashboard in Power BI?
A Petrochemicals KPI Dashboard in Power BI is a ready-to-use analytical dashboard designed to monitor key performance indicators (KPIs) related to petrochemical operations using interactive visualizations.
Instead of reviewing multiple reports separately, managers can analyze performance metrics from a centralized interface. Consequently, teams gain faster insights, make better decisions, and improve operational outcomes.
Moreover, the dashboard connects with an Excel data source, which makes data entry simple while keeping analysis powerful.
Why Do Petrochemical Companies Need KPI Dashboards?
Petrochemical operations involve complex processes such as refining, chemical conversion, energy management, and safety monitoring. Because of this complexity, performance tracking becomes essential.
Common Challenges Without KPI Dashboards
- Data stored across multiple files
- Delayed reporting cycles
- Lack of real-time insights
- Difficulty comparing targets vs actual performance
- Poor visibility into operational trends
However, when companies implement a Power BI KPI dashboard, they transform raw data into actionable intelligence.
Key Features of the Petrochemicals KPI Dashboard in Power BI
This ready-to-use dashboard contains three interactive pages within the Power BI Desktop application.
Each page serves a specific analytical purpose.
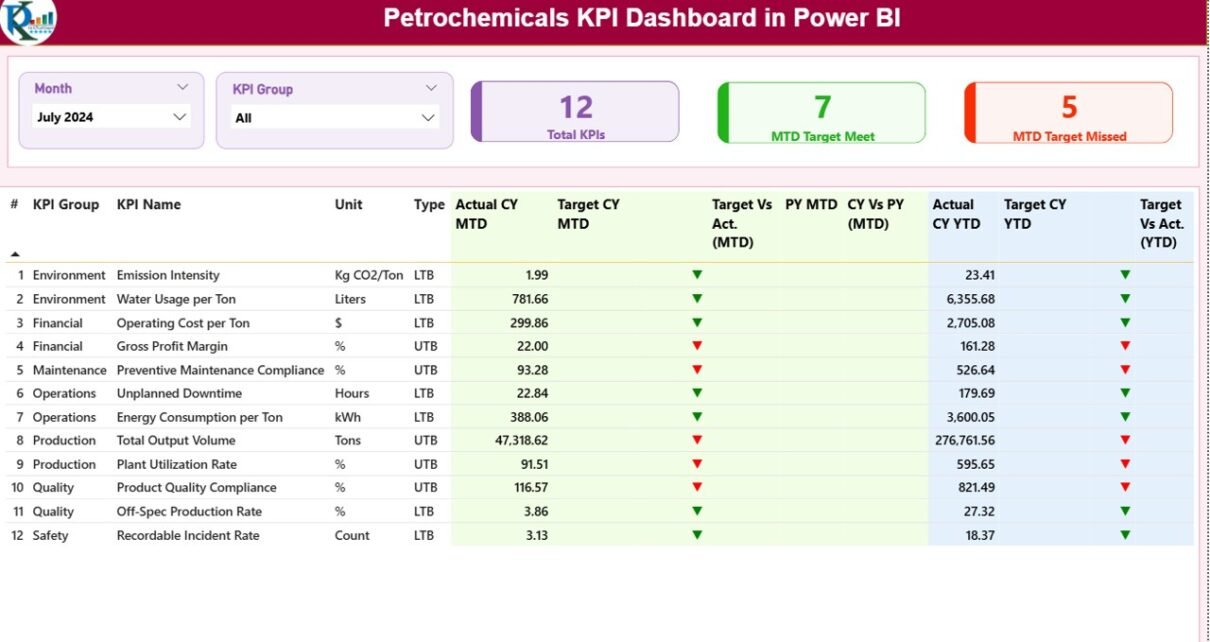
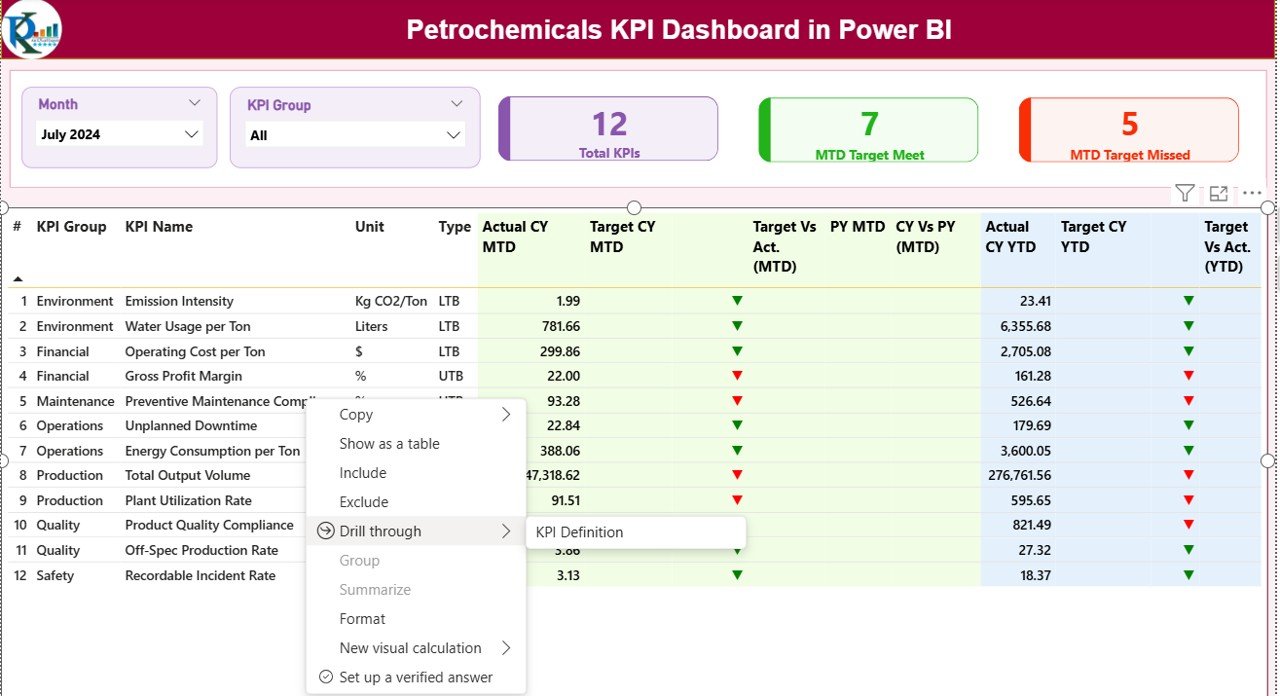
Summary Page – The Central Performance View
The Summary Page acts as the main control center of the dashboard. Users can quickly evaluate overall KPI performance without navigating multiple reports.
Top-Level Controls
At the top of the dashboard, users find:
- Month Slicer – Select reporting month instantly
- KPI Group Slicer – Filter KPIs by category
Because of these slicers, users can analyze performance dynamically.
KPI Performance Cards
The dashboard displays three important KPI cards:
- Total KPI Count
- MTD Target Meet Count
- MTD Target Missed Count
These indicators immediately show organizational performance health.
Detailed KPI Performance Table
Below the summary cards, a detailed performance table provides complete KPI insights.
KPI Information Columns
- KPI Number – Sequential identifier
- KPI Group – Category or department
- KPI Name – Performance metric title
- Unit – Measurement unit
- Type –
- LTB (Lower the Better)
- UTB (Upper the Better)
Month-to-Date (MTD) Performance Metrics
The dashboard displays:
- Actual CY MTD
- Target CY MTD
- Target vs Actual %
- Previous Year MTD
- CY vs PY Comparison %
Additionally, visual indicators improve readability:
- ▲ Green icon → Target achieved
- ▼ Red icon → Target missed
Therefore, users instantly understand performance status without deep analysis.
Year-to-Date (YTD) Performance Metrics
Similarly, the dashboard shows:
- Actual CY YTD
- Target CY YTD
- Target vs Actual (YTD)
- Previous Year YTD
- CY vs PY (YTD)
Because YTD metrics provide long-term visibility, management can track annual performance progress effectively.

Click to buy Petrochemicals KPI Dashboard in Power BI
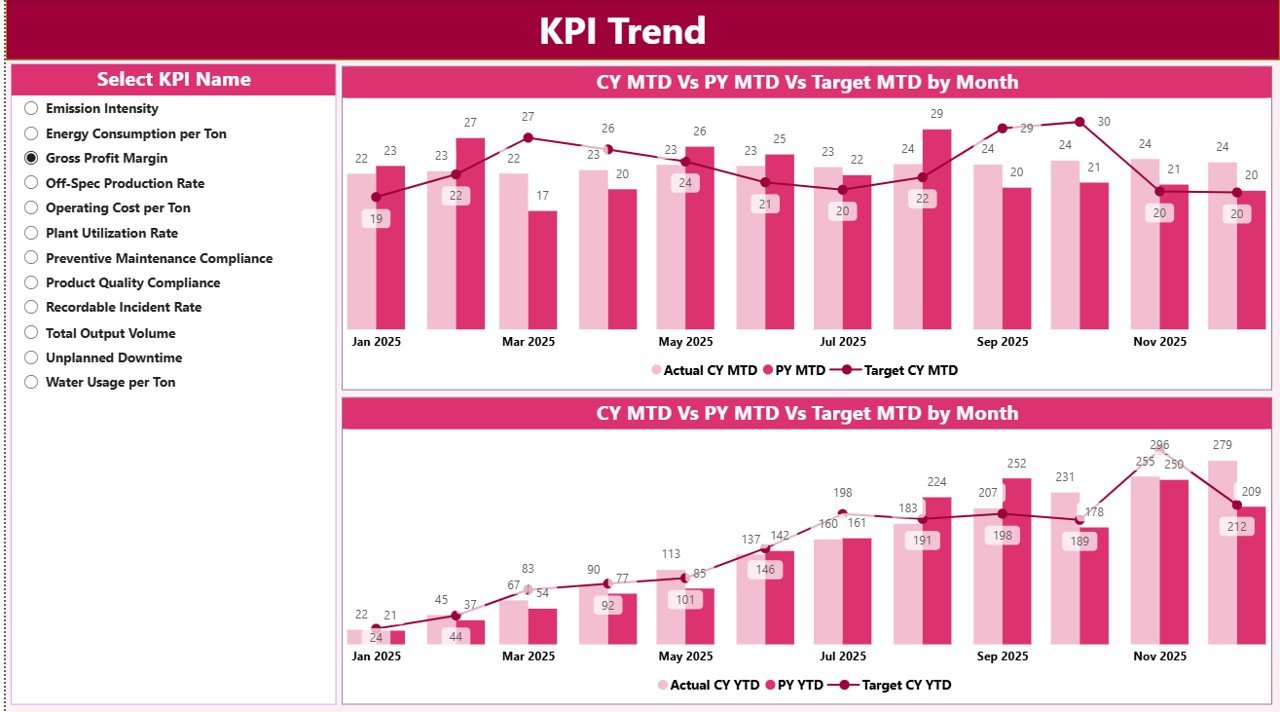
KPI Trend Page – Performance Analysis Over Time
While the summary page shows current status, the KPI Trend Page explains performance patterns.
Key Visualizations
The page includes:
- Two Combo Charts:
- MTD Trend Analysis
- YTD Trend Analysis
Each chart compares:
- Current Year Actuals
- Previous Year Performance
- Target Values
KPI Selection Slicer
Users can select any KPI using the slicer on the left side. As a result, charts update automatically.
This feature helps managers:
- Identify seasonal trends
- Detect performance decline early
- Evaluate improvement initiatives
Click to buy Petrochemicals KPI Dashboard in Power BI
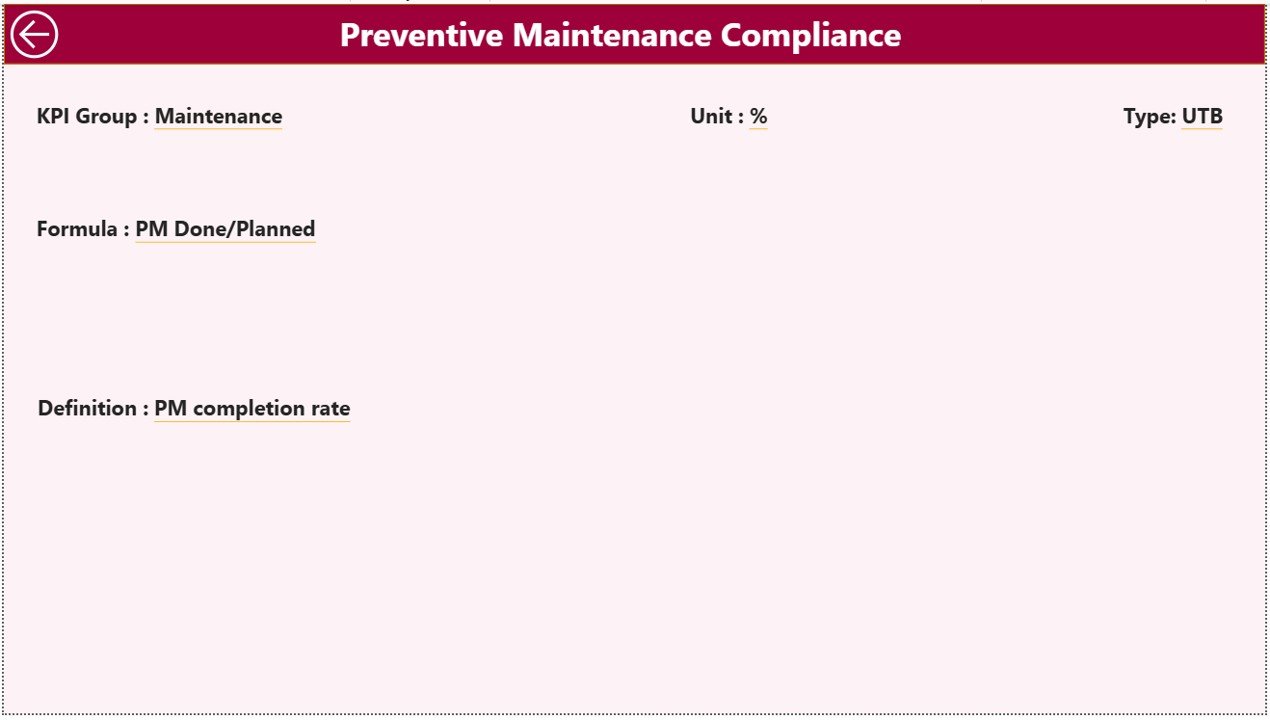
KPI Definition Page – Drill-Through Insights
The dashboard also includes a hidden KPI Definition Page.
Users can drill through from the Summary Page to view:
- KPI Formula
- KPI Definition
- Measurement logic
Since this page remains hidden, the dashboard stays clean while still providing deep analytical details when needed.
A back button allows users to return easily to the main page.
Click to buy Petrochemicals KPI Dashboard in Power BI
Excel Data Source Structure
The dashboard connects to an Excel file that contains structured data input sheets.
This design makes the system easy to maintain.
Input_Actual Sheet
Users enter:
- KPI Name
- Month (first date of month)
- MTD Actual Values
- YTD Actual Values
Because data entry stays simple, non-technical users can update data easily.
Click to buy Petrochemicals KPI Dashboard in Power BI
Input_Target Sheet
Here users input:
- KPI Name
- Month
- MTD Target
- YTD Target
Targets allow automatic performance comparison.
KPI Definition Sheet
This sheet contains master KPI information:
- KPI Number
- KPI Group
- KPI Name
- Unit
- Formula
- Definition
- Type (LTB or UTB)
Therefore, Power BI maintains standardized KPI logic across reports.
How Does the Dashboard Improve Petrochemical Operations?
The dashboard converts operational data into decision-making intelligence.
Key Improvements Include:
- Faster performance monitoring
- Better operational visibility
- Data-driven decision making
- Reduced reporting effort
- Improved accountability
As a result, leadership teams respond to issues proactively instead of reactively.
Advantages of Petrochemicals KPI Dashboard in Power BI
Centralized Performance Monitoring
All KPIs appear in one dashboard, which eliminates scattered reports.
Real-Time Analysis
Users update Excel data and instantly view refreshed analytics.
Visual Decision Support
Icons, charts, and comparisons simplify interpretation.
Historical Comparison
Year-over-year analysis highlights growth or decline.
Improved Productivity
Teams spend less time creating reports and more time improving performance.
Scalable Design
Organizations can add new KPIs easily.
What KPIs Can Be Tracked in Petrochemical Industry?
Organizations can track various KPI categories.
Operational KPIs
- Production Efficiency
- Plant Utilization
- Downtime Rate
- Yield Percentage
Safety KPIs
- Incident Rate
- Lost Time Injury Frequency
- Safety Compliance Score
Financial KPIs
- Cost per Ton
- Revenue per Unit
- Operating Margin
Maintenance KPIs
- Equipment Availability
- Maintenance Compliance
- Mean Time Between Failures
Because Power BI handles large datasets efficiently, companies can track hundreds of KPIs simultaneously.
How to Implement the Petrochemicals KPI Dashboard?
Step 1: Define KPIs
Identify operational and strategic metrics aligned with business goals.
Step 2: Prepare Excel Data
Populate Actual, Target, and KPI Definition sheets.
Step 3: Connect Power BI
Load Excel data into Power BI Desktop.
Step 4: Validate Data
Ensure KPI formulas and units remain consistent.
Step 5: Publish Dashboard
Share reports securely across the organization.
Best Practices for the Petrochemicals KPI Dashboard in Power BI
Standardize KPI Definitions
Ensure every department follows identical KPI logic.
Update Data Regularly
Schedule monthly or weekly updates.
Use Meaningful KPI Groups
Group KPIs by operations, safety, finance, or maintenance.
Focus on Actionable Metrics
Track KPIs that drive decisions, not vanity metrics.
Maintain Data Accuracy
Validate Excel entries before refreshing Power BI.
Train Users
Educate managers on interpreting dashboard visuals.
Why Choose Power BI for KPI Dashboards?
Power BI offers several advantages compared to traditional reporting tools.
Key Benefits
- Interactive visuals
- Automatic filtering
- Drill-through capability
- Strong Excel integration
- Scalable analytics
- Secure sharing
Therefore, Power BI becomes an ideal platform for industrial analytics.
Future of KPI Monitoring in Petrochemical Industry
Digital transformation continues to reshape industrial analytics.
In the future, organizations will combine KPI dashboards with:
- IoT sensors
- Predictive analytics
- AI-based forecasting
- Automated alerts
Consequently, dashboards will evolve from reporting tools into intelligent decision systems.
Conclusion
The Petrochemicals KPI Dashboard in Power BI provides a powerful solution for monitoring operational performance, tracking targets, and improving decision-making.
By combining structured Excel data with interactive Power BI visuals, organizations gain clear performance visibility. Moreover, managers identify issues faster, compare trends efficiently, and align operations with strategic goals.
As industries become more data-driven, KPI dashboards will no longer remain optional—they will become essential tools for operational excellence.
Frequently Asked Questions (FAQs)
What is a KPI dashboard in Power BI?
A KPI dashboard in Power BI is an interactive report that visualizes performance metrics using charts, tables, and indicators to support decision-making.
Why is a KPI dashboard important for petrochemical companies?
It helps monitor production, safety, financial, and operational performance in one centralized system.
Can beginners use this dashboard?
Yes. Since data entry happens in Excel, users only need basic Excel knowledge.
How often should data be updated?
Most organizations update KPI data monthly, although weekly updates also work effectively.
What does LTB and UTB mean?
- LTB: Lower value indicates better performance.
- UTB: Higher value indicates better performance.
Can we customize KPIs?
Yes. Organizations can add or modify KPIs based on operational requirements.
Does Power BI automatically refresh visuals?
Yes. Once users update Excel data and refresh Power BI, visuals update automatically.
Is this dashboard suitable for large organizations?
Absolutely. Power BI handles large datasets efficiently, making it ideal for enterprise environments.
Visit our YouTube channel to learn step-by-step video tutorials
Watch the step-by-step video tutorial:
Click to buy Petrochemicals KPI Dashboard in Power BI