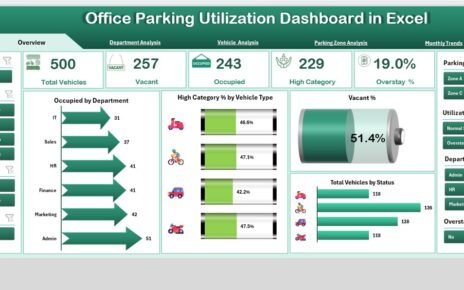
In today’s fast-paced corporate environment, every square foot of office space matters, including parking areas. With increasing numbers of employees,
Managing IT hardware replacements is a critical task for businesses of all sizes. Ensuring that hardware is replaced on time
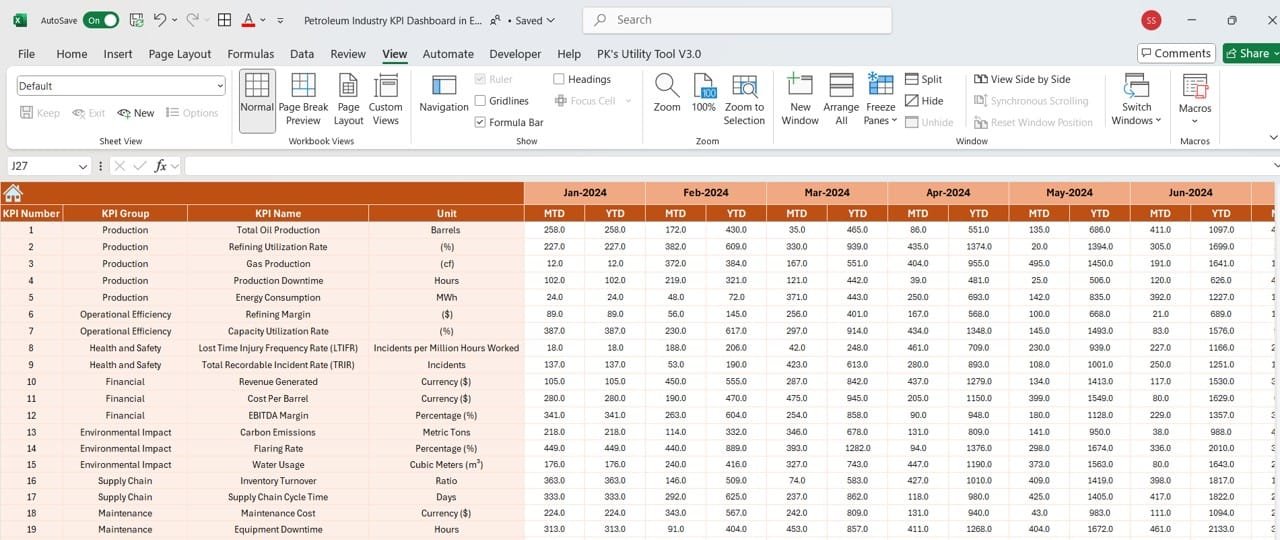
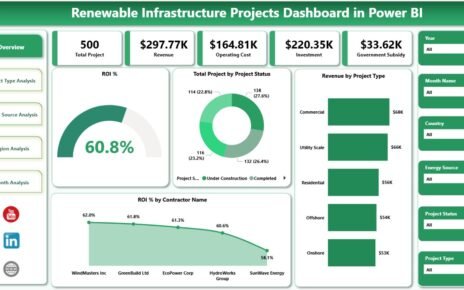
In today’s fast-changing energy world, renewable infrastructure projects continue to grow rapidly. Governments invest heavily. Private investors fund large solar