Ports play a crucial role in global trade and logistics. Every day, ports handle thousands of vessels, cargo shipments, fuel operations, and logistics activities. Therefore, port authorities and operations teams must monitor performance continuously. However, many organizations still rely on manual reports, scattered spreadsheets, and disconnected systems. As a result, managers often struggle to track operational efficiency, vessel movement, fuel consumption, and cargo handling performance.
Therefore, many port authorities now use data-driven dashboards to monitor port operations in real time. One powerful and practical solution is the Port Operations Dashboard in Excel.
The Port Operations Dashboard in Excel is a ready-to-use analytical tool that helps port managers monitor operations, analyze vessel activity, track cargo performance, and measure operational efficiency through interactive charts and KPI indicators. Instead of reviewing multiple reports, decision-makers can quickly view all operational insights in a single dashboard.
In this detailed guide, you will learn:
-
What a Port Operations Dashboard in Excel is
-
Why ports need operational dashboards
-
Key features of this dashboard template
-
How the dashboard works
-
Advantages of using the dashboard
-
Best practices for managing port operations with dashboards
-
Frequently asked questions about port operations dashboards
Let’s explore everything step by step.
What Is a Port Operations Dashboard in Excel?
A Port Operations Dashboard in Excel is an interactive analytics tool designed to monitor and analyze port activities using structured data and visual charts. The dashboard transforms raw operational data into meaningful insights so that managers can make better operational decisions.
Port operations involve multiple activities such as:
-
Vessel arrivals and departures
-
Cargo handling operations
-
Fuel consumption tracking
-
Throughput monitoring
-
Delay and turnaround analysis
Therefore, a dashboard helps managers monitor these metrics in a structured and visual format.
Instead of reviewing multiple spreadsheets, the Excel dashboard presents all key metrics through:
-
KPI cards
-
Pivot charts
-
Filters and slicers
-
Interactive analysis pages
As a result, operations teams can easily monitor performance and identify operational issues quickly.
Why Do Ports Need an Operations Dashboard?
Port operations generate a large amount of data every day. For example, vessels arrive from different regions, cargo types vary across shipments, and operational teams work across multiple shifts.
However, without a centralized monitoring system, analyzing this information becomes difficult.
A Port Operations Dashboard helps solve this problem.
Key reasons ports need dashboards:
📊 Centralized data monitoring
Managers can track all port activities in one place.
⚡ Faster decision making
Visual charts allow teams to identify operational issues quickly.
🚢 Better vessel management
Ports can analyze vessel types and movement patterns.
⛽ Fuel consumption tracking
Managers can monitor fuel usage across different operations.
📦 Cargo performance insights
Teams can track cargo handling efficiency and throughput.
Because of these benefits, many port authorities and logistics companies rely on dashboards for operational monitoring.
Key Features of the Port Operations Dashboard in Excel
This Excel template provides a structured and interactive environment to analyze port operations effectively.
The dashboard includes a page navigator located on the left side, which allows users to switch between analytical pages easily.
The template includes five interactive dashboard pages.
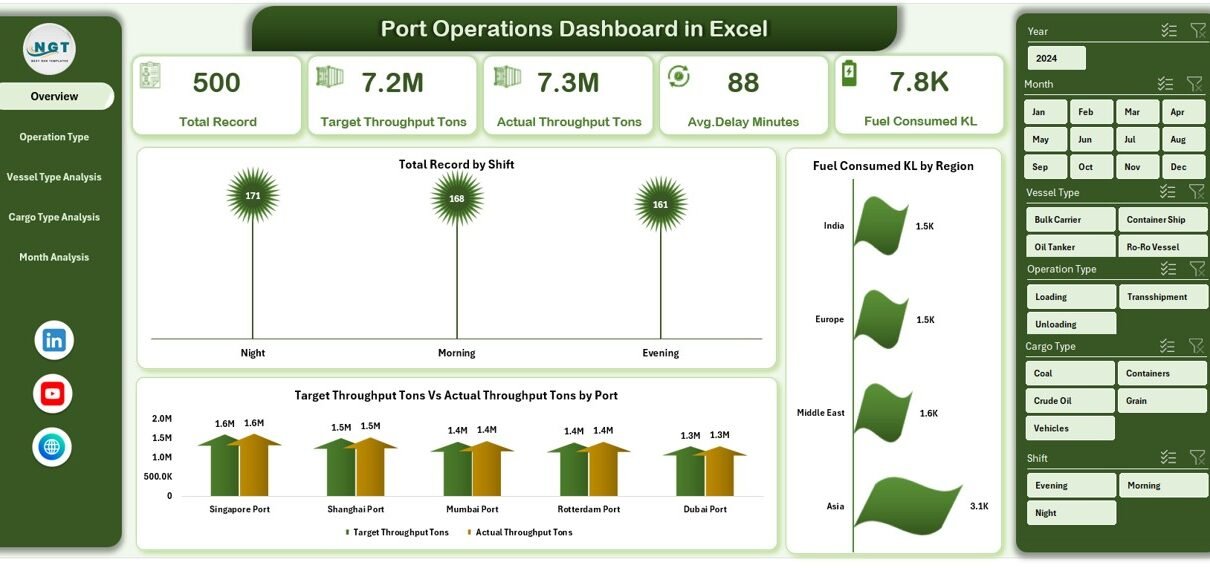
Overview Page – What Insights Can You See Instantly?
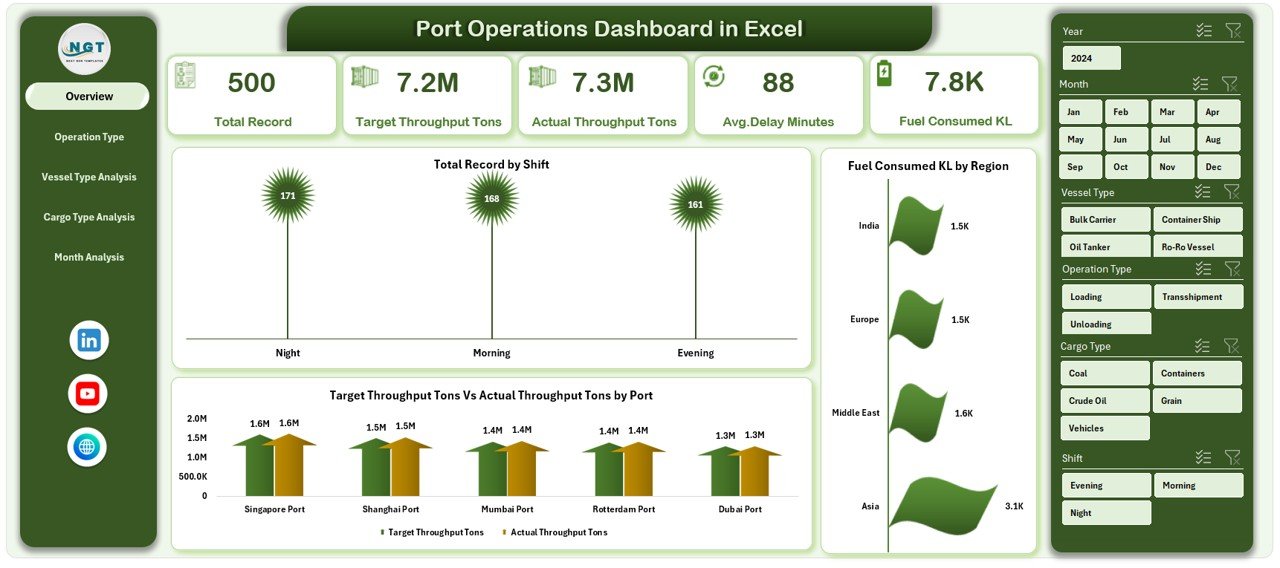
The Overview Page acts as the main dashboard interface.
This page provides a quick summary of overall port performance.
Key components of the Overview Page
📊 Interactive slicer on the right side
Users can filter the dashboard data dynamically.
📈 Four KPI cards
These cards highlight important operational metrics.
Examples include:
-
Total operational records
-
Total throughput
-
Fuel consumption
-
Average operational delay
Charts available on this page
📊 Total Record by Shift
This chart shows operational activity based on working shifts.
Managers can quickly identify which shift handles the most operations.
⛽ Fuel Consumed (KL) by Region
This chart tracks fuel consumption across different operational regions.
It helps managers identify fuel-intensive operations.
🚢 Target Throughput vs Actual Throughput (Tons) by Port
This chart compares planned throughput with actual performance.
Therefore, managers can quickly detect operational gaps.
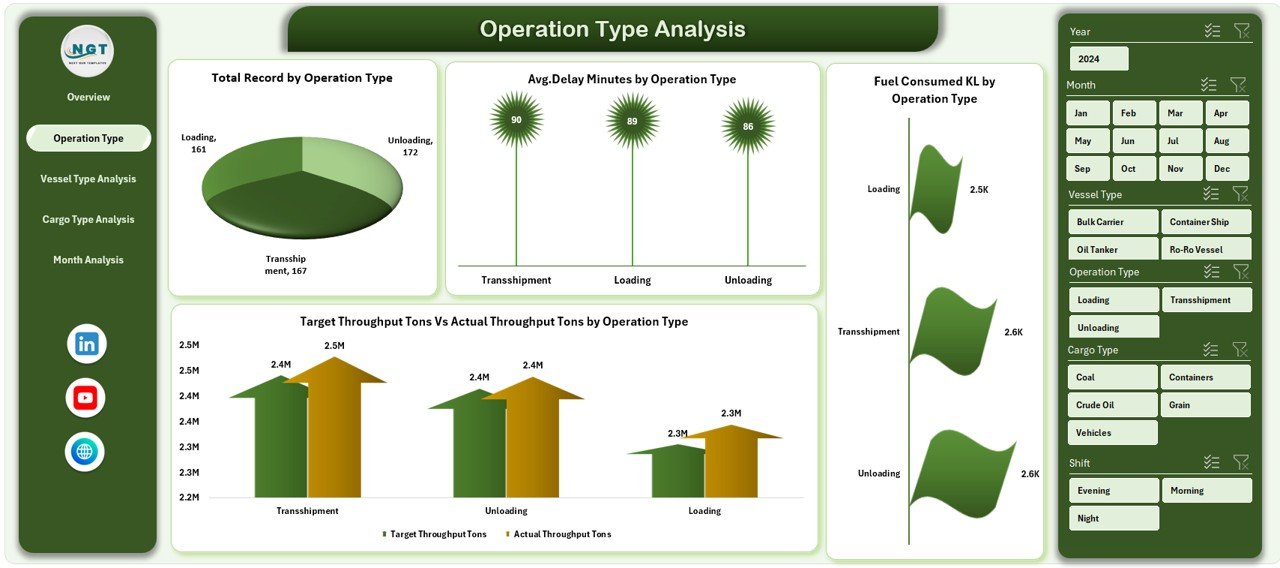
Operation Type Analysis – How Do Different Operations Perform?
Ports perform several types of operations such as:
-
Cargo loading
-
Cargo unloading
-
Vessel docking
-
Maintenance operations
The Operation Type Analysis page provides a deeper analysis of these operational activities.
Charts available on this page
📊 Total Record by Operating Type
This chart shows how frequently each type of operation occurs.
⛽ Fuel Consumed (KL) by Operating Type
Managers can analyze which operations consume the most fuel.
📈 Target Throughput vs Actual Throughput by Operating Type
This chart helps evaluate operational efficiency across different processes.
⏱ Average Delay Minutes by Operating Type
This metric highlights operational delays for each operation type.
As a result, managers can identify bottlenecks and improve operational efficiency.
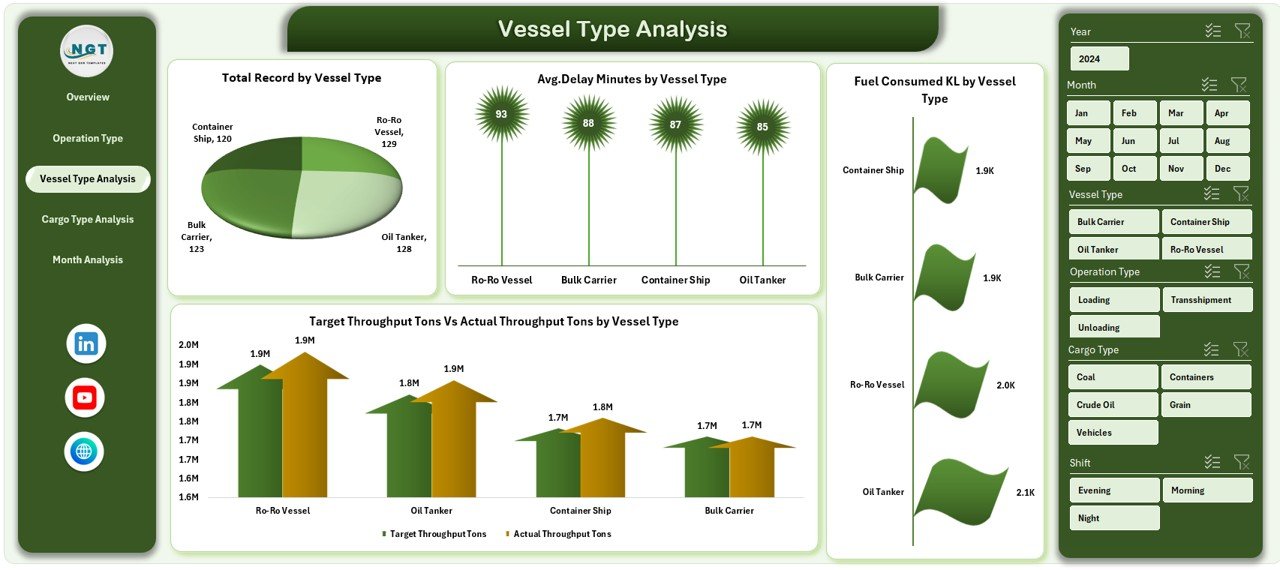
Vessel Type Analysis – How Do Different Vessel Types Impact Operations?
Ports handle many types of vessels such as:
-
Container ships
-
Bulk carriers
-
Tankers
-
Cargo ships
Each vessel type requires different operational resources.
Therefore, analyzing vessel performance becomes extremely important.
Charts available on this page
🚢 Total Record by Vessel Type
This chart shows how many vessels of each type visit the port.
⛽ Fuel Consumed by Vessel Type
Managers can monitor fuel consumption across vessel categories.
📊 Target Throughput vs Actual Throughput by Vessel Type
This chart helps identify which vessel types meet throughput targets.
⏱ Average Delay Minutes by Vessel Type
Managers can evaluate which vessel types experience the most delays.
Because of this analysis, port managers can optimize berth allocation and operational planning.
Cargo Type Analysis – How Does Cargo Impact Port Performance?
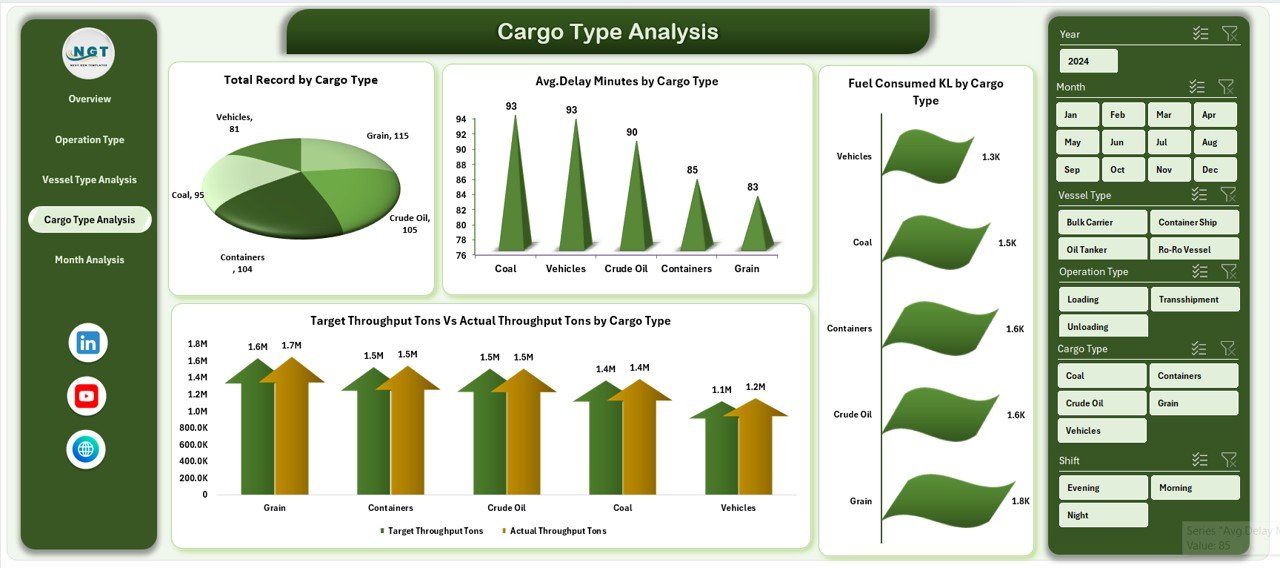
Cargo handling plays a major role in port operations.
Different cargo types require different handling processes, equipment, and storage conditions.
Examples of cargo types include:
-
Container cargo
-
Liquid cargo
-
Bulk cargo
-
Breakbulk cargo
The Cargo Type Analysis page helps managers evaluate cargo handling efficiency.
Charts available on this page
📦 Total Record by Cargo Type
This chart shows how frequently each cargo type gets processed.
⛽ Fuel Consumed by Cargo Type
Managers can analyze fuel usage across cargo categories.
📈 Target Throughput vs Actual Throughput by Cargo Type
This chart highlights cargo handling performance.
⏱ Average Delay Minutes by Cargo Type
This metric helps identify cargo categories that cause operational delays.
Because of these insights, port authorities can improve cargo handling processes.
Month Analysis – What Seasonal Trends Affect Port Operations?
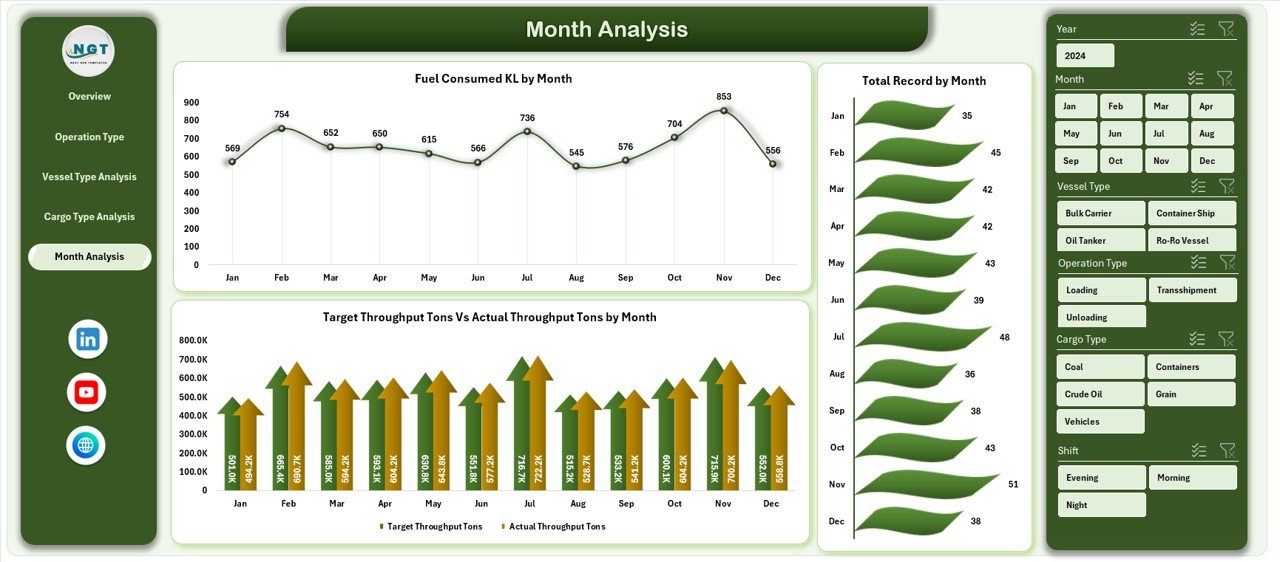
Port operations often fluctuate depending on seasonal trade activity.
Therefore, analyzing performance by month helps identify trends.
The Month Analysis page provides time-based operational insights.
Charts available on this page
📊 Total Record by Month
This chart shows monthly operational activity.
⛽ Fuel Consumed by Month
Managers can track fuel usage trends over time.
📈 Target Throughput vs Actual Throughput by Month
This chart highlights performance trends throughout the year.
As a result, managers can forecast operational demand and plan resources accordingly.
Advantages of the Port Operations Dashboard in Excel
Using a Port Operations Dashboard in Excel provides several operational and strategic advantages.
📊 Centralized Performance Monitoring
The dashboard displays all operational metrics in one place.
⚡ Faster Decision Making
Managers can instantly identify operational issues using visual charts.
🚢 Improved Vessel Management
The dashboard helps analyze vessel movement and performance.
📦 Better Cargo Handling Insights
Teams can evaluate cargo handling efficiency and throughput.
⛽ Fuel Consumption Monitoring
Managers can track fuel usage and identify cost-saving opportunities.
📈 Data-Driven Strategy
Port authorities can make strategic decisions based on data insights.
Opportunities for Improvement in Port Operations Dashboards
Although dashboards improve operational visibility, organizations can still enhance their dashboards further.
Potential improvement areas include:
-
Integrating real-time port monitoring systems
-
Connecting dashboards with port management software
-
Adding predictive analytics for cargo forecasting
-
Including automated alerts for operational delays
-
Expanding dashboards to include financial and revenue metrics
These improvements can make the dashboard even more powerful.
Best Practices for the Port Operations Dashboard
To get the maximum benefit from the dashboard, organizations should follow several best practices.
Maintain Accurate Data
Ensure the data sheet updates regularly and remains error-free.
Standardize Data Entry
Use consistent formats for vessel types, cargo types, and operational categories.
Use Pivot Tables for Analysis
Pivot tables allow flexible and interactive analysis.
Monitor KPIs Regularly
Review key performance indicators frequently to identify operational issues.
Train Operational Teams
Ensure staff understand how to interpret dashboard insights.
Following these best practices ensures better operational decision-making.
Conclusion
Port operations involve complex logistics, vessel coordination, cargo handling, and resource management. Therefore, monitoring operational performance becomes extremely important for port authorities and logistics companies.
The Port Operations Dashboard in Excel provides a structured and interactive solution for monitoring port performance. It transforms raw operational data into meaningful insights through visual charts and analytical pages.
With features such as shift analysis, vessel analysis, cargo performance monitoring, throughput tracking, and delay analysis, this dashboard helps managers improve operational efficiency and decision-making.
As global trade continues to grow, ports must adopt data-driven analytics tools to remain competitive. Therefore, implementing a Port Operations Dashboard in Excel can significantly improve operational visibility, efficiency, and strategic planning.
Frequently Asked Questions (FAQs)
What is a Port Operations Dashboard?
A Port Operations Dashboard is a data visualization tool that helps monitor vessel movements, cargo handling, fuel usage, and operational efficiency.
Why should ports use dashboards?
Dashboards provide centralized monitoring, faster insights, and improved operational decision-making.
Can Excel handle port operations dashboards effectively?
Yes. Excel supports pivot tables, slicers, charts, and formulas that allow organizations to create powerful dashboards.
What KPIs should a port operations dashboard include?
Important KPIs include:
-
Throughput performance
-
Vessel turnaround time
-
Fuel consumption
-
Operational delays
-
Cargo handling volume
Who can use a Port Operations Dashboard?
Many professionals can benefit from it, including:
-
Port authorities
-
Logistics managers
-
Shipping companies
-
Marine operations teams
-
Data analysts
Visit our YouTube channel to learn step-by-step video tutorials