Managing property portfolios requires constant tracking of performance metrics, tenant satisfaction, operating costs, and long-term investment returns. In today’s competitive real estate and property management industry, relying on scattered spreadsheets or manual reports is not enough. Business leaders need clear, visual, and dynamic tools that provide instant insights. That is where a Property Management KPI Dashboard in Power BI comes into play.
This article explains what a Property Management KPI Dashboard is, why it is essential, how it works in Power BI, and how you can benefit from it. We will also explore its key features, advantages, best practices, and some of the most frequently asked questions.
Click to Purchases Property Management KPI Dashboard in Power BI
What Is a Property Management KPI Dashboard in Power BI?
A Property Management KPI Dashboard in Power BI is a centralized reporting tool designed to track, analyze, and visualize the most important key performance indicators (KPIs) for property management operations.
Instead of navigating through multiple Excel sheets or static reports, managers can monitor everything in one interactive Power BI dashboard. This includes rent collection efficiency, occupancy rates, maintenance costs, tenant satisfaction, and portfolio growth.
Power BI connects to your Excel files, databases, or property management software and presents the data in an easy-to-understand format. Managers can slice and filter the information to focus on specific months, KPI groups, or individual properties.
Why Do Property Managers Need KPI Dashboards?
Property managers deal with several challenges every day:
-
Tracking multiple properties with different tenants.
-
Monitoring income vs. expenses across portfolios.
-
Identifying underperforming assets.
-
Ensuring tenant satisfaction.
-
Keeping up with financial targets.
Without a structured dashboard, property managers risk missing critical trends or delays in responding to performance issues. A Power BI KPI Dashboard simplifies this process by consolidating all important numbers and presenting them with charts, cards, and drill-through pages.
Key Features of the Property Management KPI Dashboard in Power BI
The Property Management KPI Dashboard we have designed includes three main pages in Power BI and is supported by an Excel data source. Let’s explore each page in detail.
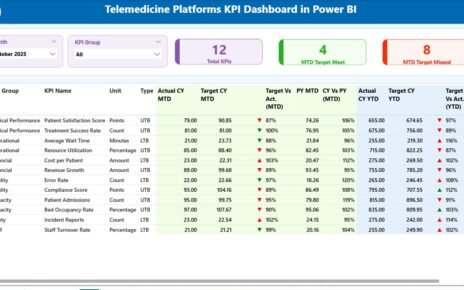
Summary Page

This is the main page of the dashboard and provides a quick overview of all KPIs.
-
Slicers at the top: Users can filter data by Month and KPI Group.
Cards:
- Total KPI count.
- MTD (Month to Date) Target Met count.
- MTD Target Missed count.
Detailed KPI Table: Displays key information for each metric, such as:
- KPI Number
- KPI Group
- KPI Name
- Unit of measurement
- KPI Type (LTB: Lower the Better, UTB: Upper the Better)
- Actual CY MTD vs. Target CY MTD
- Icons (▲ or ▼ with colors) to indicate KPI status
- Target vs. Actual % (MTD)
- Previous Year MTD for comparison
- Current vs. Previous Year % (MTD)
- YTD Actual vs. Target values
- YTD Icons and % comparison
This table helps users instantly see which KPIs are performing well and which ones need attention.
Click to Purchases Property Management KPI Dashboard in Power BI
KPI Trend Page

This page allows a deeper analysis of trends.
-
Combo Charts: Show Actual numbers of Current Year, Previous Year, and Targets for both MTD and YTD.
-
KPI Name Slicer: Allows filtering by a specific KPI to view detailed trends.
This page is useful for identifying seasonal changes, growth patterns, and long-term improvements.
KPI Definition Page

This is a hidden drill-through page that provides detailed definitions and formulas for each KPI.
-
Displays KPI Number, Group, Unit, Formula, and Type.
-
Helps users understand how each KPI is calculated.
-
Includes a back button to return to the main page.
This feature ensures transparency, as every team member can understand what each KPI means and how it impacts performance.
Excel Data Structure for the Dashboard
The backend of this dashboard uses a structured Excel file with three worksheets:
-
Input_Actual Sheet
-
Enter the actual numbers for each KPI by Month.
-
Includes both MTD and YTD values.
-
-
Input_Target Sheet
-
Enter the target numbers for each KPI by Month.
-
Includes both MTD and YTD targets.
-
-
KPI Definition Sheet
-
Define KPI Number, Group, Name, Unit, Formula, Definition, and Type (LTB or UTB).
-
This simple structure makes it easy to maintain the dashboard, even for users with basic Excel knowledge.
Advantages of Property Management KPI Dashboard in Power BI
Using this dashboard brings several benefits for property managers and stakeholders:
-
Centralized Reporting: Combines all KPIs in one place.
-
Real-Time Insights: Automatic updates when Excel data is refreshed.
-
Better Decision Making: Quickly identify underperforming KPIs.
-
Improved Tenant Satisfaction: Monitor occupancy and service response times.
-
Transparency: Clearly defined KPIs and formulas.
-
Visual Indicators: Red/green icons make it easy to spot problems.
-
Time Savings: Reduces manual report preparation.
What KPIs Can Be Tracked in the Dashboard?
Here are some examples of KPIs that property managers often include:
-
Occupancy Rate (%)
-
Tenant Retention Rate (%)
-
Rental Income Collected (USD)
-
Operating Expenses (USD)
-
Net Operating Income (NOI)
-
Maintenance Cost per Property (USD)
-
Average Days to Resolve Complaints
-
Rent Collection Efficiency (%)
-
Utility Costs (USD)
-
Capital Expenditure (CapEx)
These KPIs can be customized according to the property portfolio.
Best Practices for the Property Management KPI Dashboard
To get the most out of your Power BI dashboard, follow these best practices:
-
Define Clear KPIs: Make sure every KPI has a formula and definition.
-
Keep Data Clean: Ensure Excel sheets have no missing or duplicate values.
-
Use Consistent Units: Always use the same measurement units across KPIs.
-
Leverage Drill-Through Pages: Provide users with access to detailed KPI definitions.
-
Update Regularly: Refresh actual and target numbers monthly.
-
Keep Design Simple: Avoid clutter; focus on the most relevant KPIs.
-
Use Slicers Effectively: Allow filtering by month, property, or KPI group.
How Does This Dashboard Support Decision-Making?
This dashboard helps managers in several ways:
-
Performance Monitoring: Quickly check if KPIs are on track.
-
Trend Analysis: Identify seasonal trends or long-term changes.
-
Benchmarking: Compare current performance with the previous year.
-
Goal Alignment: Ensure actual performance matches organizational targets.
-
Operational Efficiency: Highlight cost overruns or delays.
-
Strategic Planning: Support decisions for portfolio expansion or tenant engagement.
Opportunities for Improvement
While the Property Management KPI Dashboard in Power BI is powerful, there are always areas for enhancement:
-
Automation: Connect directly with property management software instead of manual Excel updates.
-
Mobile Optimization: Make dashboards accessible on smartphones.
-
Advanced Forecasting: Use Power BI’s AI features for predictive analysis.
-
Integration with Financial Systems: Link with ERP or accounting systems for real-time updates.
-
Tenant Feedback Integration: Add survey results for tenant satisfaction.
Conclusion
The Property Management KPI Dashboard in Power BI transforms the way property managers track and analyze performance. By combining interactive visuals, drill-through definitions, and clear comparisons, it saves time and improves decision-making.
With well-defined KPIs, managers can enhance tenant satisfaction, reduce operating costs, and maximize return on investment. Whether you manage a single building or an extensive portfolio, this dashboard provides the insights you need to succeed.
Frequently Asked Questions (FAQs)
1. What is the purpose of a Property Management KPI Dashboard?
It provides a centralized view of property performance metrics, helping managers track income, expenses, occupancy, and tenant satisfaction.
2. Can I customize the KPIs in the dashboard?
Yes. You can edit the KPI Definition sheet in Excel and adjust the Power BI visuals accordingly.
3. Do I need advanced Power BI skills to use this dashboard?
No. Once set up, the dashboard is user-friendly. Basic knowledge of slicers and filters is enough to navigate it.
4. How often should I update the data?
It is recommended to update the Actual and Target data monthly for accurate insights.
5. Can this dashboard be integrated with property management software?
Yes. You can connect Power BI directly to databases or APIs from property management systems to automate updates.
6. What makes Power BI better than Excel for dashboards?
Excel provides data storage and simple charts, but Power BI offers dynamic visuals, drill-through options, and interactive filtering that enhance decision-making.
Visit our YouTube channel to learn step-by-step video tutorials
Click to Purchases Property Management KPI Da
Watch the step-by-step video tutorial:
shboard in Power BI