Managing real estate development projects is a complex task that requires continuous tracking of costs, timelines, and performance. Without proper monitoring, delays, cost overruns, and inefficiencies can significantly impact profits. That is why many companies now rely on Real Estate Development KPI Dashboards in Excel to keep everything transparent and measurable.
This article will guide you through the structure, features, benefits, best practices, and practical applications of a Real Estate Development KPI Dashboard. By the end, you will see why this tool is an essential part of decision-making in real estate development projects.
Click to Purchase Real Estate Development KPI Dashboard in Excel
What Is a Real Estate Development KPI Dashboard?
A Real Estate Development KPI Dashboard is an Excel-based reporting tool designed to measure, monitor, and analyze the performance of real estate projects. It allows project managers, developers, and investors to track key performance indicators (KPIs) such as cost, timelines, sales, profitability, and occupancy rates.
Unlike traditional spreadsheets, this dashboard is dynamic and interactive. With a single click, users can filter data by month, project, or department, and instantly see MTD (Month-to-Date) and YTD (Year-to-Date) performance against targets.
Why Do You Need a KPI Dashboard in Real Estate Development?
Real estate development involves multiple moving parts—land acquisition, design, permits, construction, marketing, and sales. Each stage has measurable performance indicators that need to be tracked carefully.
Here’s why a KPI dashboard in Excel makes a difference:
✅ Centralized Tracking – All KPIs are available in one place.
✅ Transparency – Teams can see progress against targets and previous year benchmarks.
✅ Decision-Making – Visuals highlight risks, delays, and performance gaps.
✅ Time-Saving – Automates reporting that otherwise takes hours.
✅ Scalability – Works for both small and large-scale projects.
Key Features of the Real Estate Development KPI Dashboard in Excel
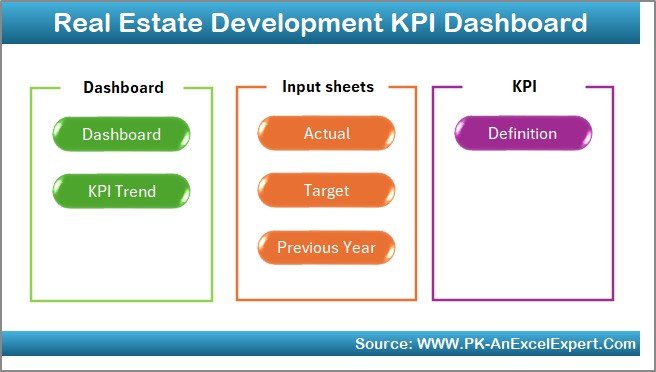
This prebuilt template consists of 7 worksheet tabs, each with a unique purpose. Let’s explore them one by one.
1. Home Sheet
-
Acts as the index page of the dashboard.
-
Provides navigation buttons to quickly move between different sheets.
-
Saves time by making the template more user-friendly.
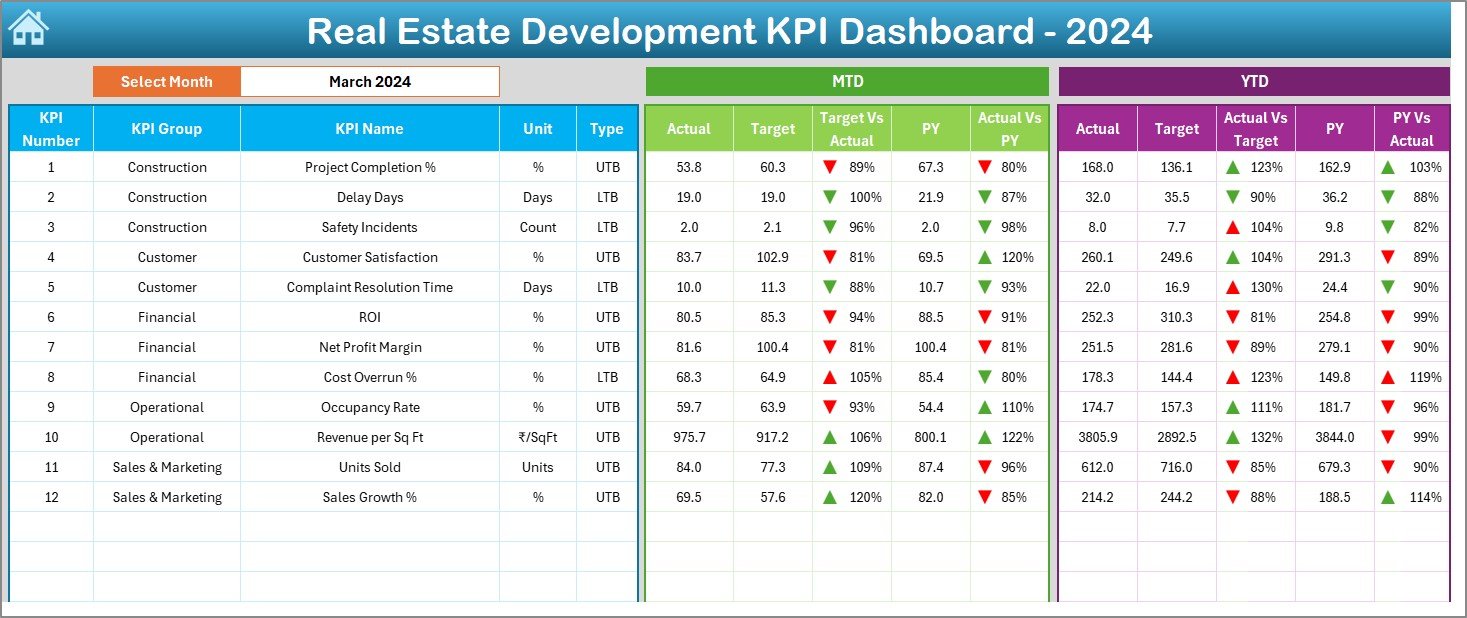
2. Dashboard Sheet
-
The main sheet where all KPIs are displayed.
-
Users can select the Month from a drop-down (cell D3).
-
Shows MTD Actual, Target, and Previous Year (PY) values.
-
Includes Target vs Actual and PY vs Actual comparisons with conditional formatting arrows (up/down).
-
Displays YTD performance side by side for deeper insights.
This sheet is ideal for high-level reviews during management meetings.
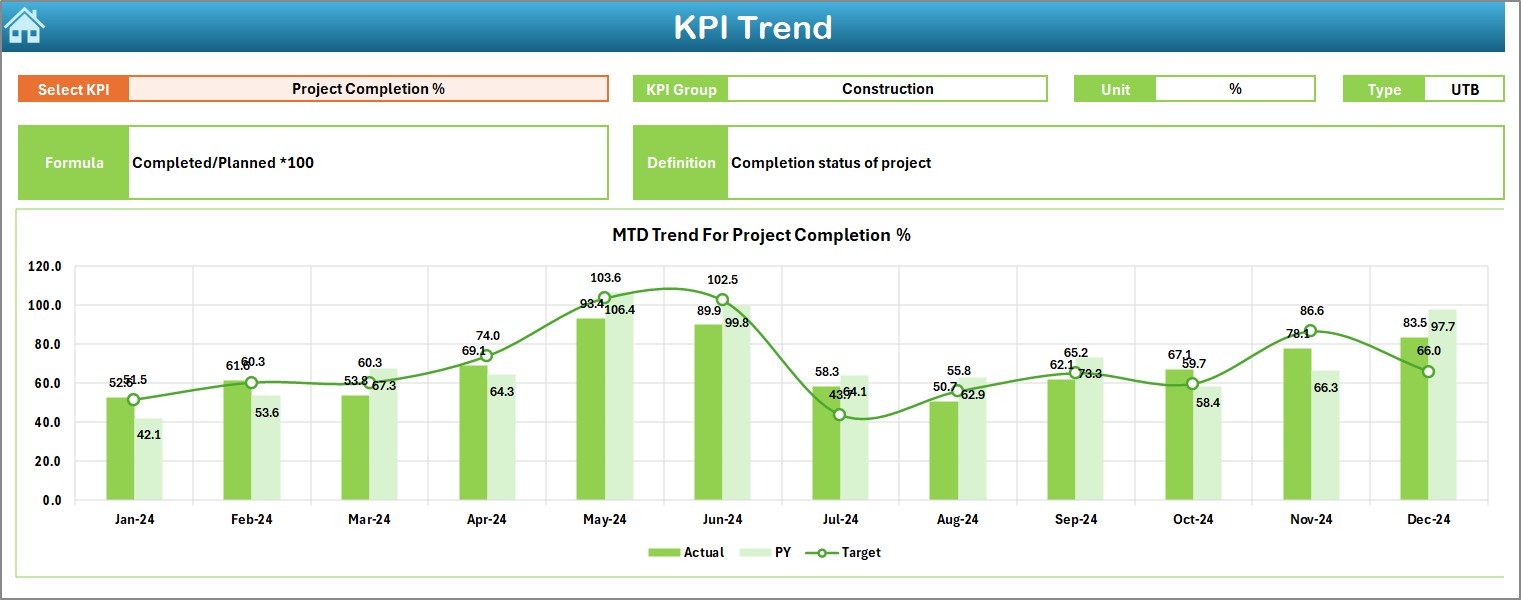
3. KPI Trend Sheet
-
Lets you select a KPI name from the drop-down (cell C3).
-
Displays the KPI group, unit, formula, and definition.
-
Identifies whether the KPI is Upper the Better (UTB) or Lower the Better (LTB).
-
Provides trend charts for both MTD and YTD, comparing Actual, Target, and PY values.
This sheet helps in identifying long-term trends instead of just focusing on monthly fluctuations.
4. Actual Numbers Input Sheet
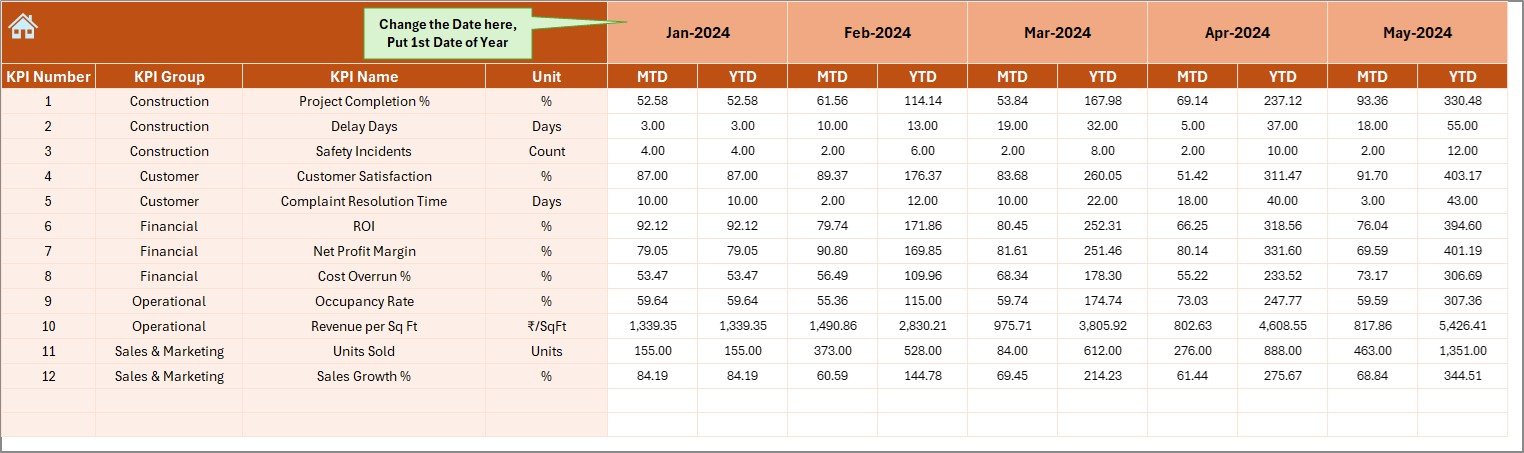
-
The sheet where actual project performance data is entered.
-
Supports both MTD and YTD numbers.
-
Month selection is available at cell E1.
-
Keeps data structured and ensures consistency in reporting.
5. Target Sheet

-
Used to set monthly and yearly targets for each KPI.
-
Targets can be entered for both MTD and YTD.
-
Provides a benchmark for performance measurement.
6. Previous Year Numbers Sheet

-
Stores historical data for comparison.
-
Helps identify growth, efficiency, or decline against the last year.
-
Supports both MTD and YTD structures.
7. KPI Definition Sheet
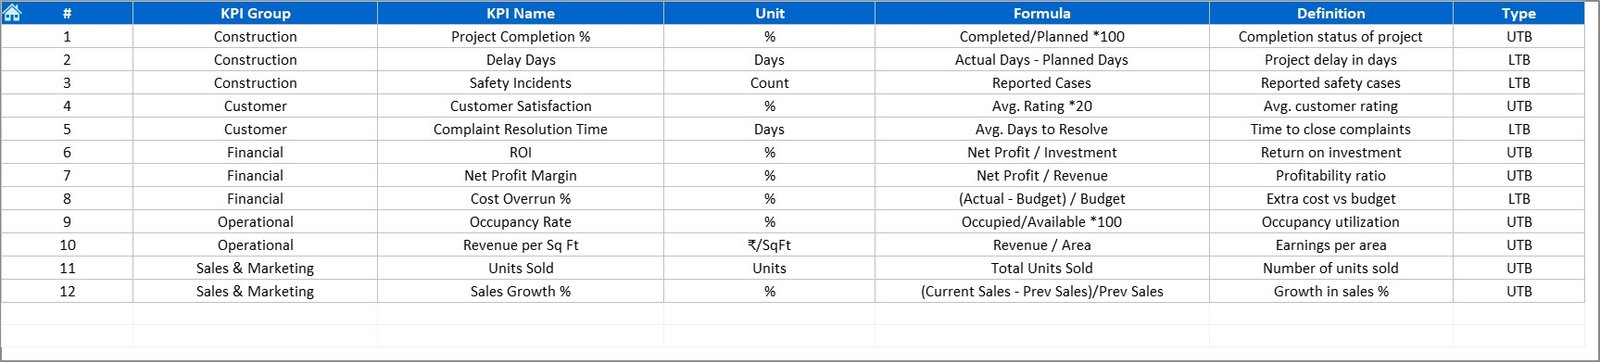
-
A master reference sheet.
-
Includes KPI Name, Group, Unit, Formula, and Definition.
-
Ensures every stakeholder understands how KPIs are measured.
-
Reduces confusion and standardizes performance tracking.
Examples of Real Estate Development KPIs
Here are some KPIs you can track with this dashboard:
-
Project Completion % – Progress made compared to total project plan.
-
Cost Variance % – Difference between actual and planned costs.
-
Sales Conversion Rate – Number of units sold vs inquiries.
-
Occupancy Rate – Percentage of units leased or occupied.
-
Net Profit Margin – Profitability after deducting expenses.
-
Customer Satisfaction Rating – Based on surveys and feedback.
Advantages of Using a Real Estate Development KPI Dashboard
-
📊 Better Performance Tracking – Compare actual performance with targets easily.
-
🕒 Saves Time – Reduces manual reporting efforts.
-
📈 Improves Accuracy – Automated calculations minimize errors.
-
👥 Enhances Collaboration – All departments access the same dashboard.
-
💰 Increases Profitability – Identifies bottlenecks before they impact financials.
Opportunities for Improvement in Real Estate KPI Tracking
Even with a strong dashboard, improvements are always possible:
🔄 Automating Data Input – Linking with databases or ERP systems.
📱 Mobile-Friendly Dashboards – So teams can track KPIs on the go.
🛠 Adding Predictive Analytics – Forecasting project completion and costs.
🌍 Sustainability KPIs – Tracking eco-friendly materials and green certifications.
Best Practices for the Real Estate Development KPI Dashboard
To get the maximum benefit, follow these best practices:
✅ Define clear KPI ownership – Assign responsibility for each metric.
✅ Keep KPIs limited and relevant – Avoid overwhelming stakeholders.
✅ Update actual numbers regularly – Monthly inputs ensure accuracy.
✅ Use conditional formatting – Red/green arrows for instant visibility.
✅ Review PY comparisons – Learn from past trends.
✅ Combine with visual dashboards – Pivot charts make insights more engaging.
How This Dashboard Supports Decision-Making
With this dashboard in place, decision-makers can:
-
Track budget adherence and minimize overspending.
-
Identify delayed projects and allocate resources quickly.
-
Forecast sales performance based on current trends.
-
Benchmark current year vs previous year for realistic growth planning.
-
Build investor confidence through transparent reporting.
Conclusion
A Real Estate Development KPI Dashboard in Excel is more than just a spreadsheet. It is a powerful decision-making tool that saves time, reduces errors, and ensures better project outcomes. With structured sheets for actuals, targets, trends, and definitions, this dashboard provides a complete view of performance across all stages of real estate development.
By adopting this dashboard, companies can improve efficiency, reduce risks, and achieve consistent growth in an increasingly competitive market.
Click to Purchase Real Estate Development KPI Dashboard in Excel
Frequently Asked Questions (FAQs)
1. What is the purpose of a Real Estate Development KPI Dashboard?
It helps track and analyze project performance across costs, sales, timelines, and customer satisfaction in a structured and transparent way.
2. How often should the dashboard be updated?
You should update it at least monthly with actual performance data for accuracy and timely decision-making.
3. Can I customize the KPIs in the dashboard?
Yes, you can add, remove, or modify KPIs in the KPI Definition sheet to match your business needs.
4. What software do I need to use this dashboard?
The dashboard is fully functional in Microsoft Excel. No additional software is required.
5. Who can benefit from this dashboard?
Real estate developers, project managers, financial analysts, and investors can all benefit from using this dashboard.
6. Can I use this dashboard for multiple projects?
Yes, you can input data for different projects and track them individually or collectively.
Visit our YouTube channel to learn step-by-step video tutorials
Click to Purchase Real Estate Development KPI Dashboard in Excel
Watch the step-by-step video tutorial: