In today’s fast-paced world, businesses are constantly on the lookout for ways to streamline their recruitment and hiring processes. One powerful tool to achieve this goal is the Recruitment and Hiring Dashboard in Power BI. This ready-to-use dashboard simplifies complex hiring data and provides valuable insights into your hiring efforts. By consolidating various data points and metrics in one place, it enables recruitment teams and HR professionals to make data-driven decisions that improve the quality of hires, optimize hiring costs, and boost organizational efficiency.
Click to Purchases Recruitment and Hiring Dashboard in Power BI
Introduction to Recruitment and Hiring Dashboard in Power BI
The Recruitment and Hiring Dashboard in Power BI integrates data from multiple sources and presents it in an easily understandable format. It captures information from an Excel file, transforming it into visually engaging and insightful reports. The dashboard is designed to track the recruitment process from start to finish, offering analytics on candidates, source effectiveness, departmental hiring trends, and more.
The dashboard’s interactive features allow users to drill down into specific areas of interest, helping them better understand the recruitment process and make informed decisions. With Power BI’s visualization capabilities, the dashboard turns raw data into actionable insights, making it an indispensable tool for any HR department.
Key Features of the Recruitment and Hiring Dashboard in Power BI
The Recruitment and Hiring Dashboard is composed of five distinct pages in the Power BI desktop application. Each page serves a unique purpose and helps users analyze various aspects of the recruitment process.
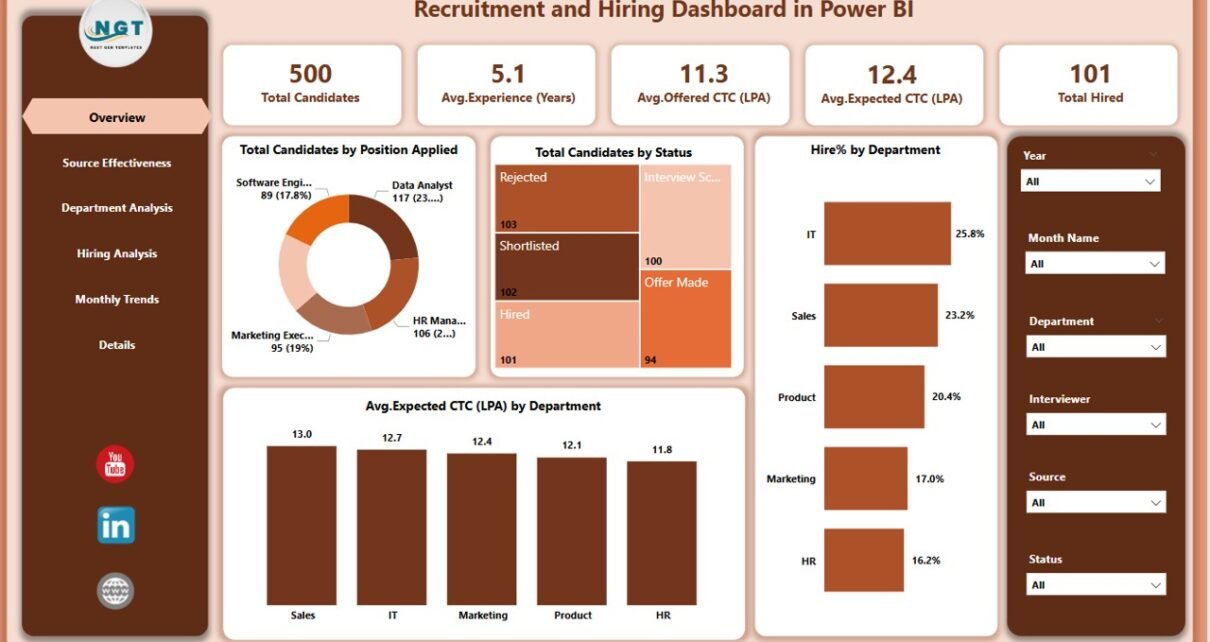
Overview Page
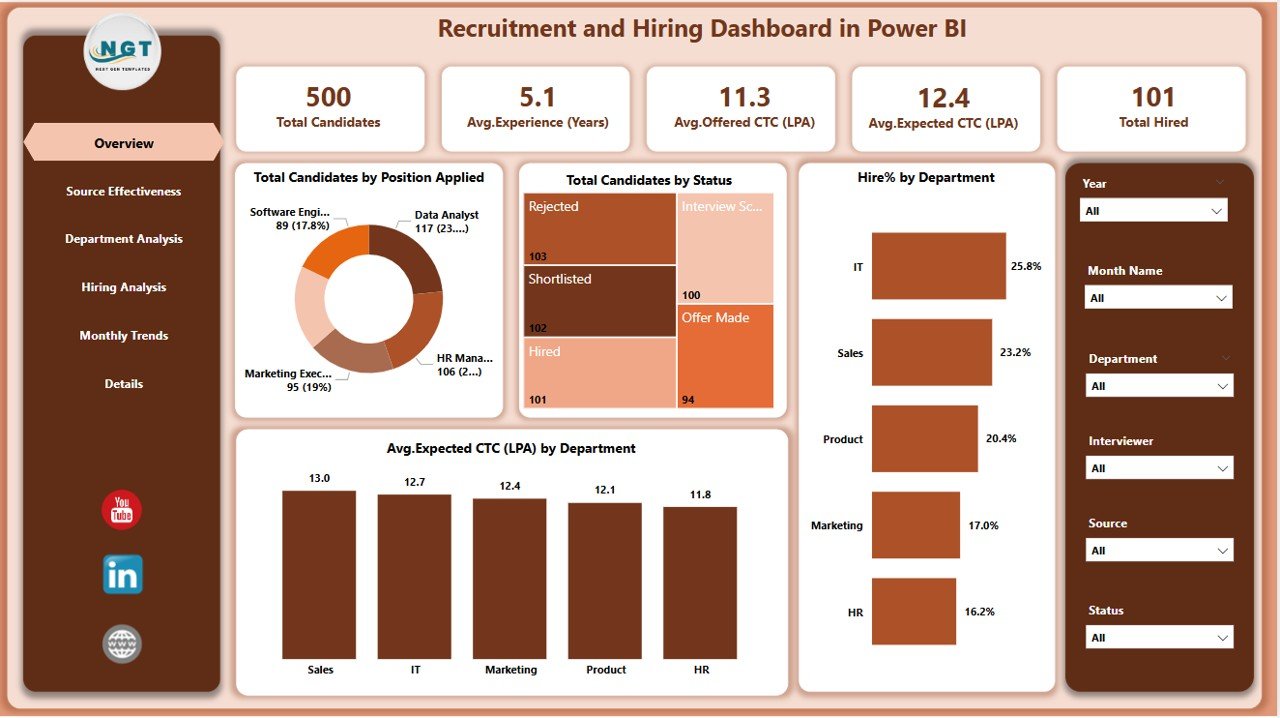
The Overview Page is the central hub of the dashboard, providing a high-level summary of the recruitment efforts. This page features:
-
6 slicers: Users can filter the data by specific criteria such as department, hiring stage, position applied, and more.
-
5 cards: These cards display key metrics such as the total number of candidates, the number of candidates hired, and other high-level recruitment statistics.
4 charts: The charts visualize important trends, including:
- Total Candidates by Position Applied
- Total Candidates by Status (e.g., shortlisted, interview stage, hired)
- Hire Percentage by Department
- Average Expected CTC (Cost to Company) (LPA) by Department
Source Effectiveness Page
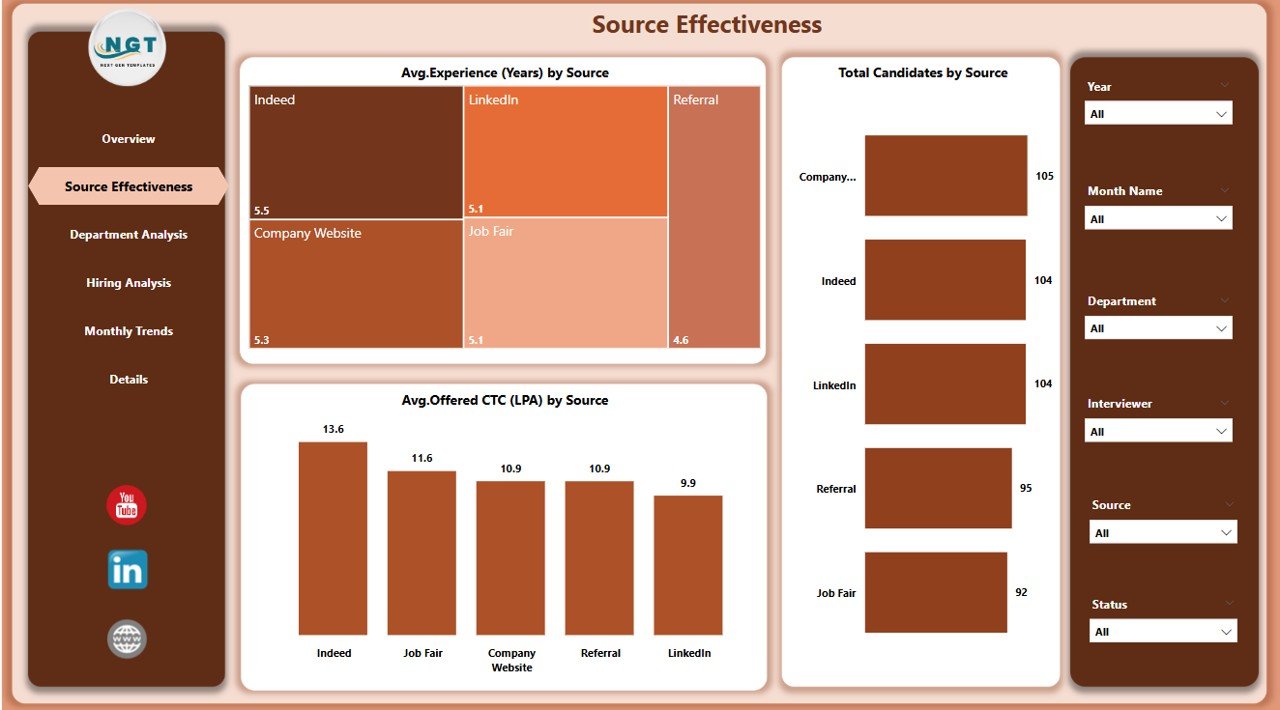
The Source Effectiveness Page focuses on the performance of various recruitment channels or sources. Here, HR professionals can assess the effectiveness of their recruitment campaigns by analyzing:
-
6 slicers for better data segmentation.
3 charts:
- Average Experience (Years) by Source: Understanding the average experience of candidates sourced from different channels (job boards, social media, referrals, etc.).
- Total Candidates by Source: Displays how many candidates were sourced from each channel.
- Average Offered CTC (LPA) by Source: Helps gauge the compensation expectations from candidates sourced through various platforms.
Click to Purchases Recruitment and Hiring Dashboard in Power BI
Department Analysis Page
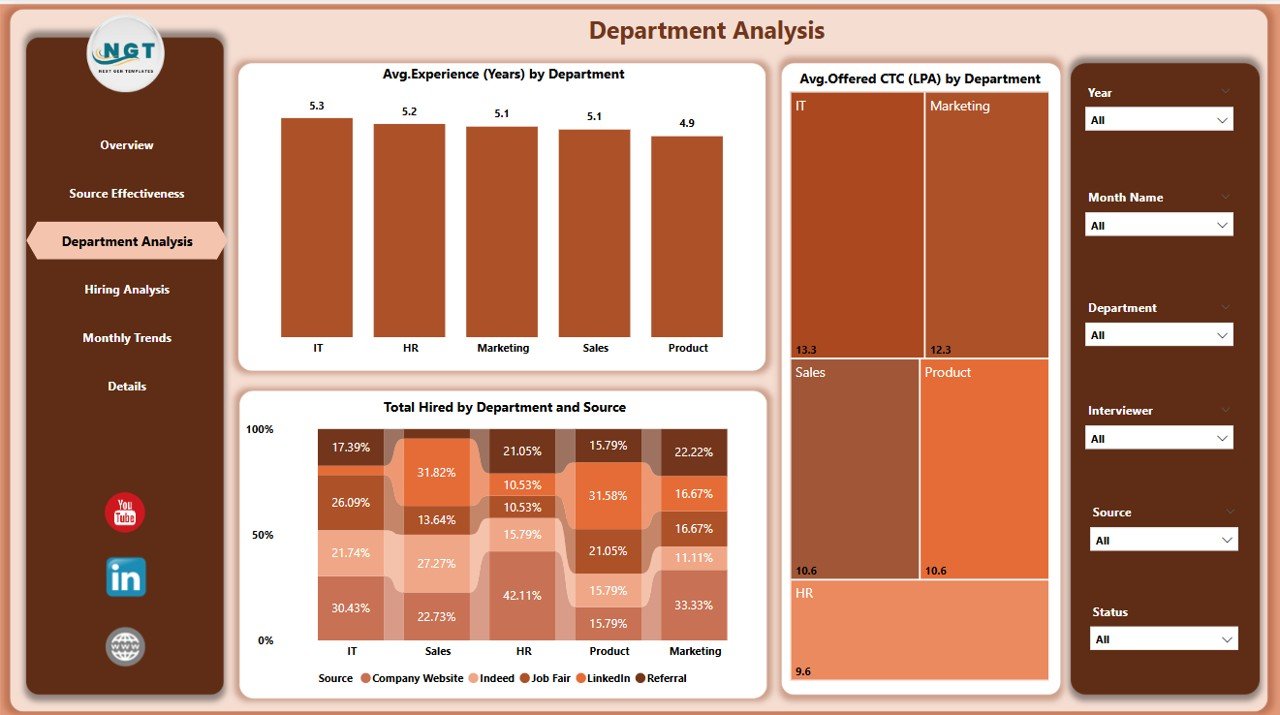
The Department Analysis Page allows users to break down hiring data by different departments. Key insights include:
-
6 slicers to filter the data by department or position.
3 charts:
- Average Experience (Years) by Department: Reveals the average experience level of candidates hired by each department.
- Average Offered CTC (LPA) by Department: Provides insight into the compensation offered to candidates per department.
- Total Hired by Department and Source: Tracks the total number of hires per department and the source of those candidates.
Hiring Analysis Page
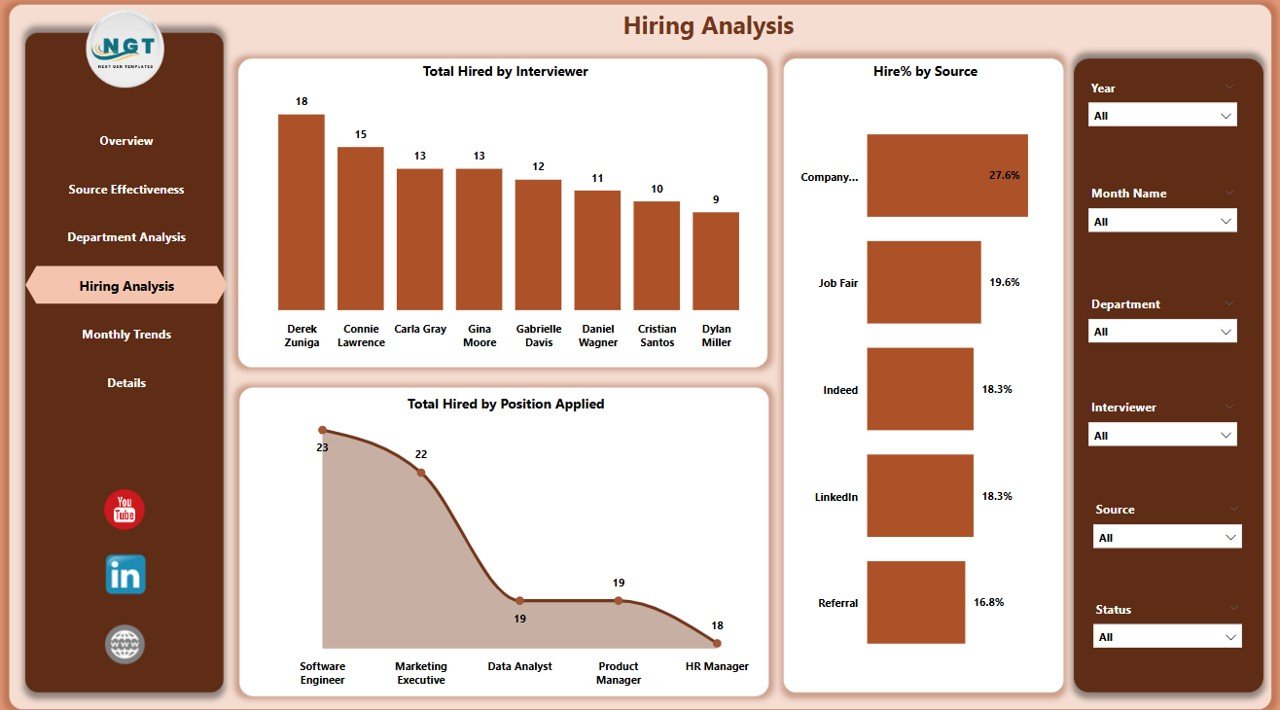
The Hiring Analysis Page zooms in on the detailed hiring process, helping teams understand how many candidates are being hired and their profiles. It includes:
-
6 slicers for filtering by position, department, status, and other factors.
3 charts:
- Average Experience (Years) by Department: Gives HR teams a quick overview of the experience levels of candidates hired across various departments.
- Average Offered CTC (LPA) by Department: Similar to the earlier chart but focuses on actual hires rather than just candidates.
- Total Hired by Department and Source: Helps track which departments are hiring the most and which sources are providing the most candidates.
Monthly Trends Page
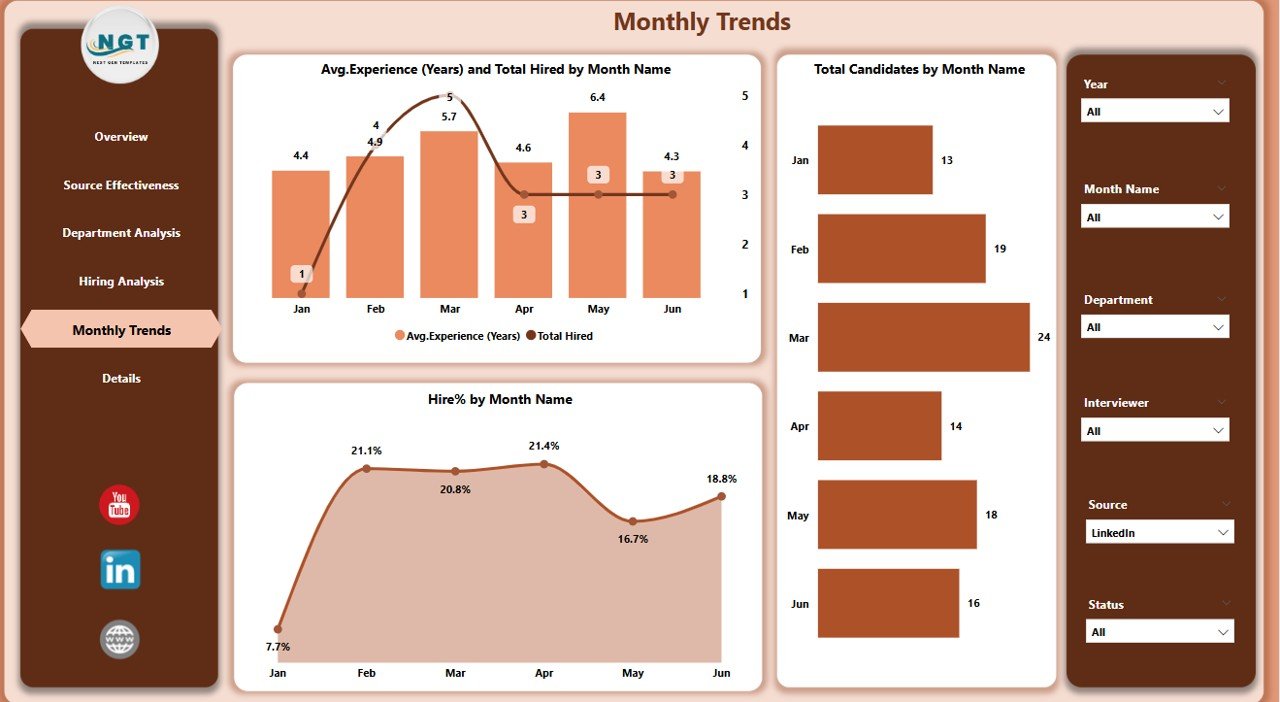
The Monthly Trends Page provides insights into recruitment trends over time, helping teams understand seasonal hiring patterns and forecast future needs. It features:
-
6 slicers for filtering data by specific time periods or hiring categories.
2 charts:
- Average Experience (Years) and Total Hired by Month: Tracks the experience level and the total number of hires made each month.
- Total Candidates by Month: Displays the number of candidates that applied during each month.
- Hire Percentage by Month: Measures the hiring success rate over time, giving HR teams insights into recruitment effectiveness.
Advantages of Using the Recruitment and Hiring Dashboard in Power BI
The Recruitment and Hiring Dashboard in Power BI offers several advantages that make it an essential tool for HR departments. Here are the key benefits:
-
Data-Driven Decisions: The dashboard provides real-time insights, helping HR professionals and hiring managers make informed decisions based on data, rather than relying on gut feelings or outdated reports.
-
Time-Saving: Instead of manually compiling and analyzing data, the dashboard automates these tasks, saving time and reducing human error.
-
Increased Transparency: With visualizations and interactive features, everyone in the organization can have access to the same data, promoting transparency and alignment within teams.
-
Improved Source Effectiveness: By analyzing the effectiveness of various recruitment sources, HR teams can optimize their efforts and focus on channels that yield the best candidates.
-
Hiring Forecasting: Monthly trends and departmental data help HR professionals forecast future hiring needs, making it easier to plan and allocate resources accordingly.
-
Enhanced Candidate Experience: By tracking and analyzing the hiring process, businesses can identify areas for improvement, ultimately providing a better experience for candidates.
Best Practices for Using the Recruitment and Hiring Dashboard in Power BI
To fully harness the potential of the Recruitment and Hiring Dashboard, it’s important to follow best practices. Here are some tips for getting the most out of this tool:
-
Regularly Update Your Data: Keep your recruitment data up to date for the most accurate insights. Ensure that data is refreshed regularly to reflect the current state of your hiring process.
-
Use Filters Wisely: Utilize the slicers and filters effectively to drill down into the data. This allows you to identify trends and issues more accurately.
-
Collaborate Across Teams: Make the dashboard available to both HR and hiring managers. This ensures that everyone is on the same page and can collaborate to improve the recruitment process.
-
Track the Right KPIs: Focus on key performance indicators (KPIs) that matter most to your business. These might include hire percentages, average candidate experience, or source effectiveness.
-
Customize the Dashboard: If necessary, adjust the visualizations to suit your organization’s unique needs. Power BI offers flexibility in customizing reports and charts, so don’t hesitate to make changes to fit your goals.
-
Analyze Historical Trends: Use the monthly trends to identify hiring patterns over time. This data can be invaluable when forecasting future hiring needs.
Frequently Asked Questions (FAQs) About Recruitment and Hiring Dashboard in Power BI
1. What is the Recruitment and Hiring Dashboard in Power BI?
The Recruitment and Hiring Dashboard in Power BI is a ready-to-use tool designed to streamline the recruitment process. It helps HR departments track key metrics related to candidates, hiring sources, departmental hiring, and more.
2. How do I use the Recruitment and Hiring Dashboard?
You can use the dashboard by integrating it with your recruitment data, either from an Excel file or other data sources. The dashboard is designed to be interactive, with slicers that allow you to filter and analyze data based on various criteria.
3. What data do I need to integrate with the dashboard?
The dashboard requires recruitment-related data, including candidate information, department details, hiring statuses, and compensation figures. This data can be sourced from an Excel file or your HR management system.
4. Can the dashboard be customized?
Yes, Power BI allows you to customize the dashboard by adding or removing visualizations, changing colors, and adjusting filters to suit your organization’s needs.
5. How often should I update the data in the dashboard?
It’s recommended to update the data regularly—at least weekly or monthly—to ensure the dashboard reflects the most current recruitment information.
Click to Purchases Recruitment and Hiring Dashboard in Power BI
Conclusion
The Recruitment and Hiring Dashboard in Power BI is an invaluable tool for HR departments looking to optimize their recruitment processes. By consolidating various recruitment metrics in one place, it provides insights that drive smarter, more efficient hiring decisions. Whether you’re assessing the effectiveness of your hiring sources, tracking trends over time, or breaking down departmental data, this dashboard simplifies the process and helps you make data-driven decisions that contribute to organizational success.
Visit our YouTube channel to learn step-by-step video tutorials
Click to Purchases Recruitment and Hiring Dashboard in Power BI