Managing procurement operations in a refinery is never simple. Refineries deal with large volumes of raw materials, multiple suppliers, strict quality standards, and tight delivery timelines. Because of this, even a small delay or pricing mismatch can impact production, cost, and profitability.
That is exactly where the Refinery Procurement Dashboard in Excel plays a critical role.
This powerful and ready-to-use dashboard helps refinery teams track procurement performance, analyze costs, monitor supplier efficiency, and improve decision-making using clean and visual data insights.
In this detailed guide, you will learn everything about the Refinery Procurement Dashboard in Excel, including its structure, features, benefits, advantages, best practices, and real-world usage. Moreover, this article explains everything in a simple and easy-to-understand way so that anyone can use it confidently.
Click to Purchases Refinery Procurement Dashboard in Excel
What Is a Refinery Procurement Dashboard in Excel?
A Refinery Procurement Dashboard in Excel is a centralized analytical tool that helps refinery procurement teams track, analyze, and optimize purchasing activities using key metrics and visual reports.
Instead of working with multiple Excel sheets and manual reports, this dashboard brings all procurement data into a single interactive Excel file. As a result, users can quickly understand:
-
Procurement spending trends
-
Supplier performance
-
Department-wise procurement value
-
Invoice status
-
Lead time efficiency
-
Material cost behavior
Moreover, since the dashboard works entirely in Excel, it does not require any advanced BI tools or technical skills.
Why Do Refineries Need a Procurement Dashboard?
Refinery procurement involves high-value transactions, multiple departments, and strict compliance rules. Therefore, managing everything manually increases the risk of:
-
Cost overruns
-
Delayed procurement
-
Supplier inefficiencies
-
Invoice mismatches
-
Poor visibility
However, when refineries use a procurement dashboard, they gain:
-
Better control over spending
-
Improved supplier evaluation
-
Faster decision-making
-
Clear performance visibility
-
Data-driven procurement planning
As a result, the organization saves time, reduces cost, and improves operational efficiency.
Overview of the Refinery Procurement Dashboard in Excel
The Refinery Procurement Dashboard in Excel is a ready-to-use solution designed with simplicity and performance in mind.
It consists of five interactive dashboard pages and one data support sheet, making it easy to maintain and analyze procurement data.
🔹 Key Highlights of the Dashboard
-
Fully Excel-based dashboard
-
User-friendly navigation
-
Dynamic charts and KPIs
-
Department-wise analysis
-
Supplier-wise performance tracking
-
Monthly procurement trends
-
Clean and professional layout
Let’s now explore each section of the dashboard in detail.
Click to Purchases Refinery Procurement Dashboard in Excel
Dashboard Structure and Page-Wise Explanation
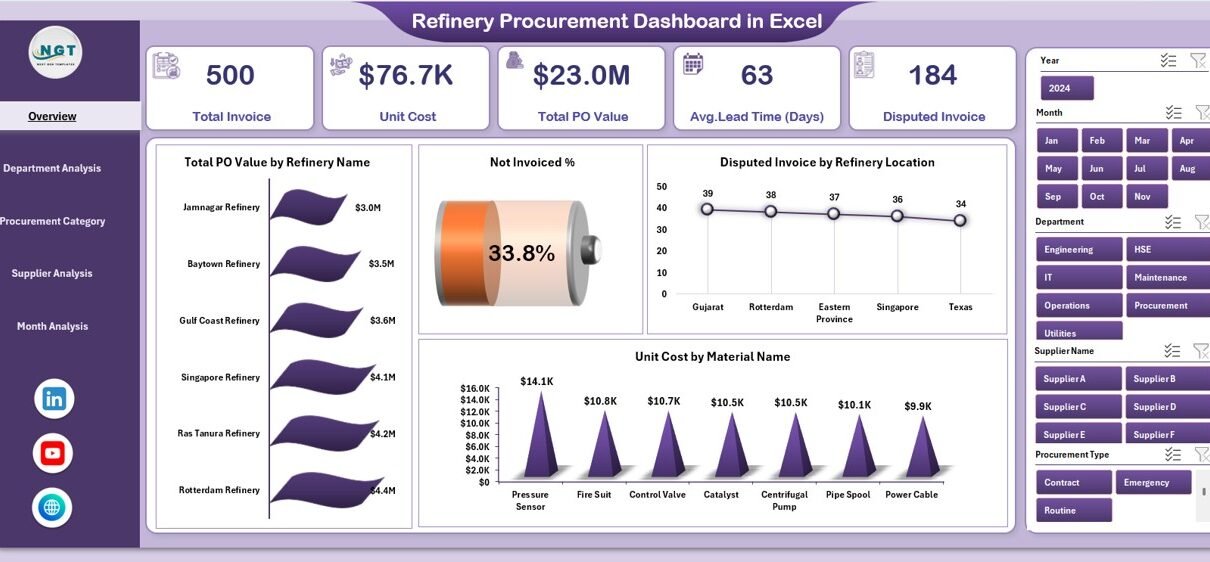
1️⃣ Overview Page – Complete Procurement Summary
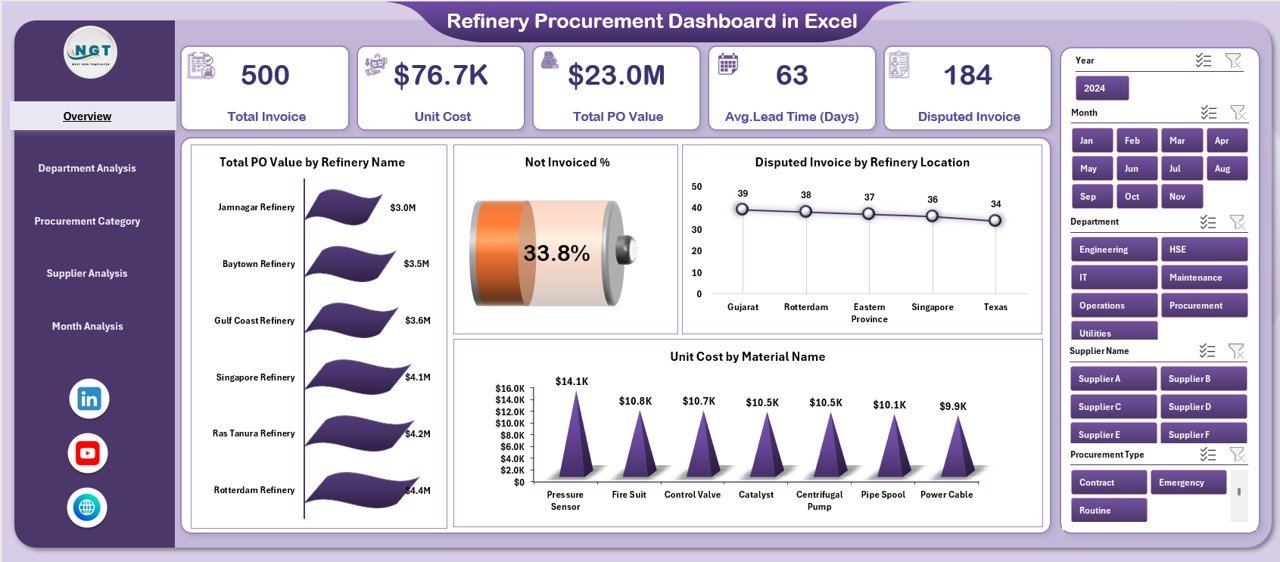
The Overview Page is the main page of the dashboard. It provides a high-level summary of procurement performance across the refinery.
✅ Key Features of the Overview Page
-
Right-side slicer for filtering data
-
Easy navigation using the page navigator
-
Quick summary of procurement performance
-
Visual charts for faster insights
📊 Charts Available on the Overview Page
🔹 Total PO Value by Refinery Name
This chart shows the total purchase order value for each refinery location.
It helps identify:
-
High-spending refineries
-
Procurement concentration
-
Cost distribution across locations
🔹 Not Invoiced Percentage
This chart highlights pending invoices.
As a result, procurement teams can:
-
Track pending payments
-
Reduce invoice delays
-
Improve vendor relationships
🔹 Disputed Invoice by Refinery Location
This visual shows invoice disputes across locations.
Therefore, users can:
-
Identify dispute-prone locations
-
Investigate billing errors
-
Improve vendor coordination
🔹 Unit Cost by Material Name
This chart displays unit cost variations for different materials.
It helps in:
-
Cost comparison
-
Identifying expensive materials
-
Negotiating better rates
2️⃣ Department Analysis Page
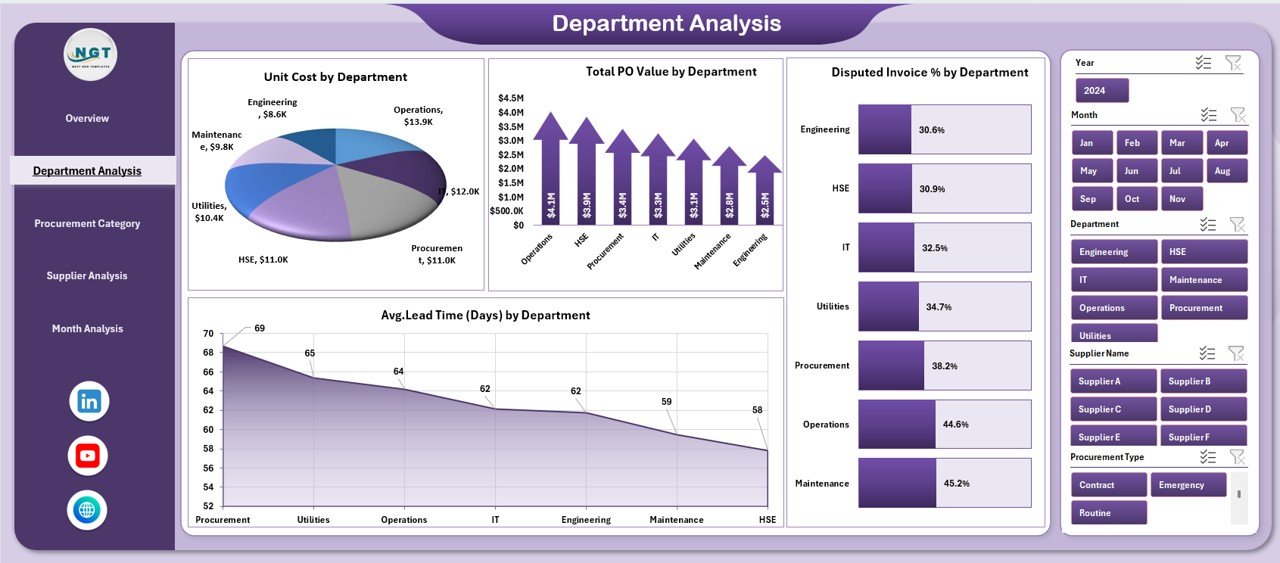
The Department Analysis Page provides deep insights into procurement performance across different departments.
✅ Why This Page Is Important
Different departments have different procurement needs. Therefore, this page helps track:
-
Cost efficiency
-
Department-wise spending
-
Procurement bottlenecks
-
Delivery performance
📊 Charts Available on Department Analysis Page
🔹 Unit Cost by Department
This chart compares the average unit cost across departments.
It helps identify departments with higher procurement costs.
🔹 Total PO Value by Department
This visual highlights how much each department spends on procurement.
As a result, managers can allocate budgets more effectively.
🔹 Disputed Invoice % by Department
This chart shows departments with frequent invoice disputes.
Therefore, teams can focus on process improvement.
🔹 Average Lead Time by Department
This chart tracks procurement lead time.
It helps reduce delays and improve supplier coordination.
Click to Purchases Refinery Procurement Dashboard in Excel
3️⃣ Procurement Category Analysis
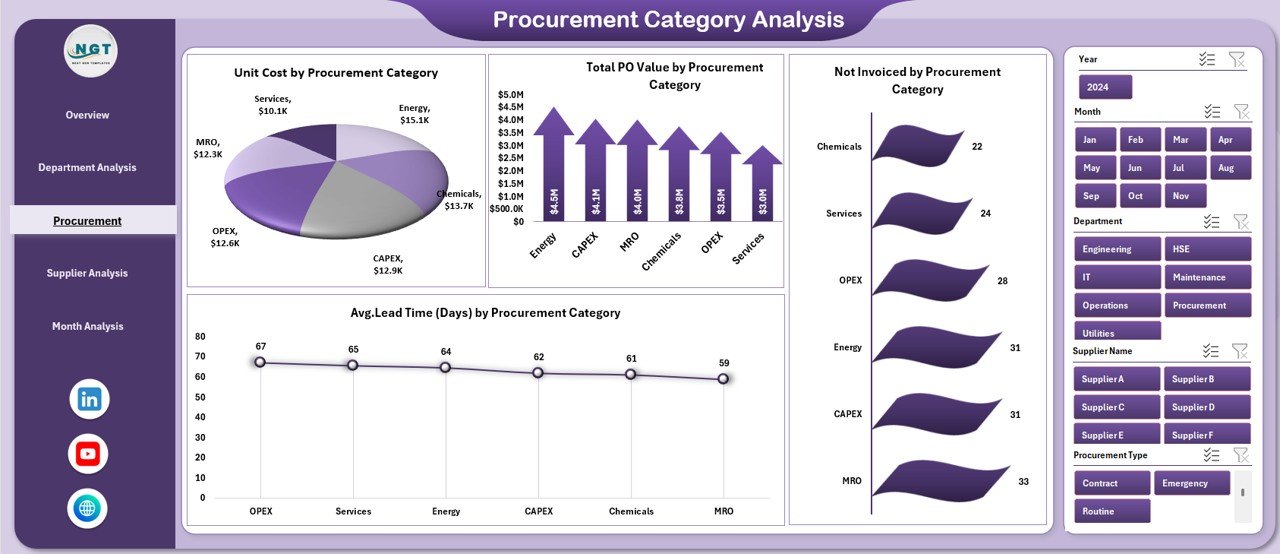
The Procurement Category Analysis Page focuses on analyzing procurement data based on material or service categories.
✅ Why This Page Matters
Procurement categories often consume large budgets. Hence, analyzing them helps in:
-
Cost control
-
Supplier consolidation
-
Contract negotiations
-
Demand planning
📊 Charts Available on This Page
🔹 Unit Cost by Procurement Category
This chart helps identify costly categories and price variations.
🔹 Total PO Value by Procurement Category
It shows which category contributes most to total procurement spend.
🔹 Not Invoiced by Procurement Category
This chart highlights pending invoices by category.
🔹 Average Lead Time by Procurement Category
This visual helps track delivery performance across categories.
4️⃣ Supplier Analysis Page
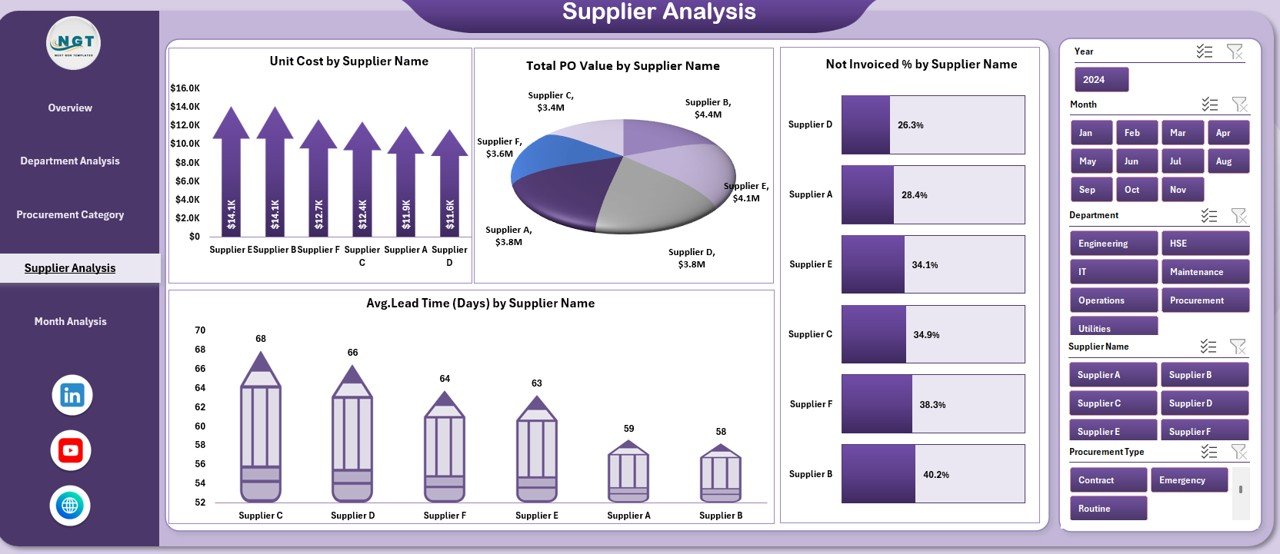
The Supplier Analysis Page plays a vital role in supplier evaluation and relationship management.
✅ Why Supplier Analysis Is Important
Suppliers directly affect:
-
Cost
-
Quality
-
Delivery timelines
-
Production continuity
Therefore, this page helps procurement teams make smarter vendor decisions.
📊 Charts Included
🔹 Unit Cost by Supplier Name
This chart compares unit prices across suppliers.
🔹 Total PO Value by Supplier Name
It highlights top suppliers based on procurement volume.
🔹 Not Invoiced by Supplier Name
This visual helps track suppliers with pending invoices.
🔹 Average Lead Time by Supplier Name
It helps identify suppliers with delivery delays.
5️⃣ Month Analysis Page
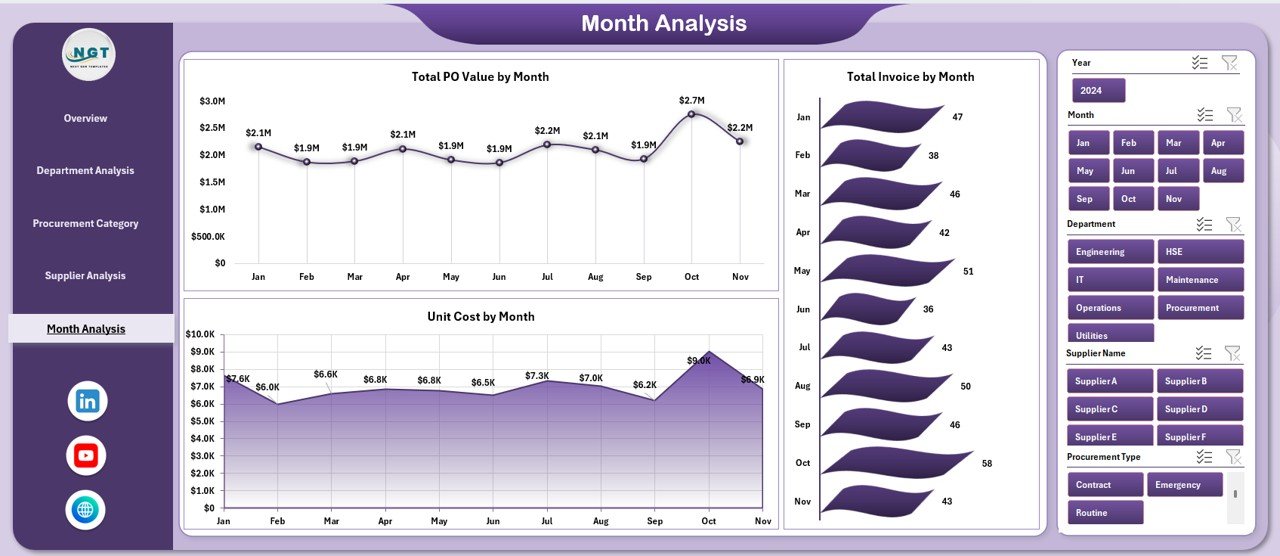
The Month Analysis Page helps track procurement trends over time.
✅ Key Benefits of Monthly Analysis
-
Identifies seasonal trends
-
Tracks monthly spending
-
Monitors invoice trends
-
Helps in forecasting
📊 Charts on Month Analysis Page
🔹 Unit Cost by Month
Tracks monthly fluctuations in unit cost.
🔹 Total PO Value by Month
Shows procurement spending trends.
🔹 Total Invoice by Month
Helps monitor billing cycles and cash flow.
Support Sheet – Data Management Layer
Click to Purchases Refinery Procurement Dashboard in Excel
The Support Sheet acts as the backend of the dashboard.
✅ Purpose of the Support Sheet
-
Stores raw procurement data
-
Supports pivot tables and charts
-
Enables easy data refresh
-
Keeps dashboard dynamic
Users can simply update the data, and the dashboard updates automatically.
Advantages of Refinery Procurement Dashboard in Excel
Using this dashboard offers multiple benefits:
✅ Improves Procurement Visibility
The dashboard shows all procurement metrics in one place.
✅ Enhances Decision-Making
Visual insights help managers make faster and smarter decisions.
✅ Reduces Cost Leakages
Identifies high-cost areas and invoice mismatches.
✅ Improves Supplier Performance
Tracks supplier efficiency and delivery timelines.
✅ Saves Time and Effort
Eliminates manual reporting and calculations.
✅ Easy to Use
No advanced Excel or BI skills required.
✅ Customizable
Users can easily modify charts, fields, and metrics.
Best Practices for Using the Refinery Procurement Dashboard
To get the best results, follow these best practices:
✔ Keep Data Updated
Always update the data sheet regularly to maintain accuracy.
✔ Standardize Procurement Categories
Use consistent naming to avoid reporting errors.
✔ Monitor KPIs Monthly
Review procurement performance every month.
✔ Focus on High-Cost Areas
Analyze departments or suppliers with high spending.
✔ Track Lead Time Closely
Delayed deliveries affect refinery operations.
✔ Use Dashboard in Review Meetings
Present insights during procurement and management meetings.
How This Dashboard Helps Refinery Management
This dashboard helps refinery management in multiple ways:
-
Improves cost transparency
-
Supports strategic sourcing
-
Enhances supplier negotiations
-
Reduces procurement risks
-
Improves budgeting accuracy
-
Enables data-driven decisions
As a result, refineries achieve better operational control and financial performance.
Conclusion
The Refinery Procurement Dashboard in Excel is a powerful, easy-to-use, and highly effective tool for managing procurement operations in refineries.
It transforms raw procurement data into meaningful insights through interactive charts and KPIs. Moreover, it helps procurement teams track costs, monitor suppliers, analyze trends, and improve overall efficiency.
Because the dashboard works entirely in Excel, it remains accessible, flexible, and cost-effective for organizations of all sizes.
If you want better visibility, stronger supplier control, and smarter procurement decisions, this dashboard is the perfect solution.
Frequently Asked Questions (FAQs)
❓ What is a Refinery Procurement Dashboard?
A Refinery Procurement Dashboard is an Excel-based tool that tracks and analyzes procurement performance, supplier data, costs, and invoice status.
❓ Who can use this dashboard?
Procurement managers, finance teams, supply chain managers, and refinery operations teams can use it.
❓ Does this dashboard require Power BI?
No. This dashboard works completely in Microsoft Excel.
❓ Can I customize the dashboard?
Yes. You can easily modify charts, KPIs, and data fields based on your needs.
❓ How often should I update the data?
You should update the data monthly or weekly for accurate reporting.
❓ Does it support multiple refineries?
Yes. The dashboard supports multiple refinery locations and suppliers.
❓ Is this dashboard suitable for large organizations?
Yes. It works well for both small and large refinery operations.
Visit our YouTube channel to learn step-by-step video tutorials