A Refinery Procurement KPI Dashboard in Power BI is a ready-to-use, interactive analytics solution designed to track, measure, and analyze procurement performance inside oil and gas refineries. Instead of managing procurement metrics across scattered Excel files and manual reports, this dashboard brings everything together in one clear, visual, and decision-ready platform.
Because refinery procurement directly affects production continuity, safety, compliance, and cost control, teams must track performance accurately and consistently. Therefore, this Power BI dashboard focuses on MTD (Month-to-Date) and YTD (Year-to-Date) procurement KPIs while comparing Actual vs Target and Current Year vs Previous Year results.
Moreover, since the dashboard uses Excel as its data source, procurement teams can easily update data without technical complexity. As a result, this solution remains flexible, scalable, and easy to maintain for refineries of any size.
Click to buy Refinery Procurement KPI Dashboard in Power BI
Why Do Refineries Need a Procurement KPI Dashboard?
Refineries operate in a highly complex and regulated environment. At the same time, procurement teams manage thousands of materials, vendors, contracts, and timelines. Therefore, without a structured KPI dashboard, several challenges appear quickly.
Common Challenges Without a Dashboard
- Procurement data remains scattered across multiple files
- Manual reporting consumes excessive time
- Decision-making becomes reactive instead of proactive
- Target deviations go unnoticed
- Management lacks a single source of truth
However, when refineries adopt a Procurement KPI Dashboard in Power BI, these problems reduce significantly. As a result, procurement leaders gain instant visibility into performance trends and gaps.
How Does the Refinery Procurement KPI Dashboard in Power BI Work?
This dashboard works by connecting Power BI to a structured Excel data model. Because the structure remains simple and logical, users can update KPIs monthly without advanced technical skills.
Core Workflow
- Enter Actual procurement values in Excel
- Enter Target procurement values in Excel
- Maintain KPI definitions in a dedicated sheet
- Refresh Power BI visuals instantly
- Analyze performance using slicers, icons, and trends
Since Power BI handles calculations and visuals automatically, users focus only on insights and decisions.
What Are the Key Pages in the Refinery Procurement KPI Dashboard?
This ready-to-use dashboard contains three powerful pages, each designed for a specific purpose. Together, they create a complete procurement performance monitoring system.
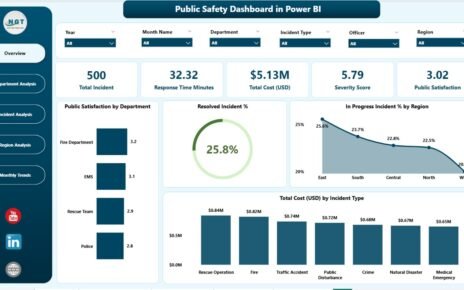
What Does the Summary Page Show?
The Summary Page acts as the main control center of the dashboard. From this page, procurement managers quickly understand overall performance.
Interactive Filters on the Summary Page
- Month slicer to analyze any reporting month
- KPI Group slicer to focus on specific procurement categories
Because these slicers sit at the top, users can instantly switch views without navigating away.
KPI Cards on the Summary Page
The dashboard displays three clear KPI cards:
- Total KPIs Count
- MTD Target Met Count
- MTD Target Missed Count
As a result, management immediately sees how many procurement KPIs perform well and how many need attention.
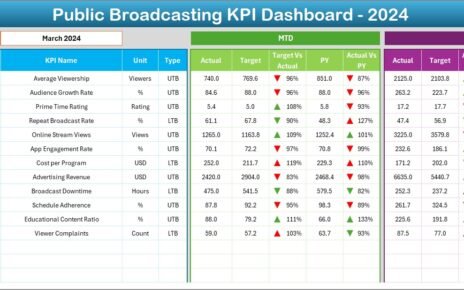
Detailed KPI Table Explained
Below the cards, a detailed KPI table provides complete visibility. Each column serves a specific analytical purpose.
KPI Identification Columns
- KPI Number – Unique sequence number
- KPI Group – Category of the procurement KPI
- KPI Name – Description of the KPI
- Unit – Unit of measurement
- Type – UTB (Upper the Better) or LTB (Lower the Better)
These columns ensure clarity and standardization across teams.
MTD Performance Columns
- Actual CY MTD – Current Year actual MTD value
- Target CY MTD – Current Year target MTD value
- MTD Icon – ▲ green or ▼ red indicator
- Target vs Actual (MTD) – Actual ÷ Target
- PY MTD – Previous Year MTD value
- CY vs PY (MTD) – CY MTD ÷ PY MTD
Because visual icons appear instantly, users identify problem areas without manual calculations.
YTD Performance Columns
- Actual CY YTD – Current Year actual YTD value
- Target CY YTD – Current Year target YTD value
- YTD Icon – ▲ green or ▼ red indicator
- Target vs Actual (YTD) – Actual ÷ Target
- PY YTD – Previous Year YTD value
- CY vs PY (YTD) – CY YTD ÷ PY YTD
Therefore, teams analyze long-term trends while tracking short-term progress.

Click to buy Refinery Procurement KPI Dashboard in Power BI
How Does the KPI Trend Page Help Analysis?
The KPI Trend Page focuses on performance movement over time. Instead of looking at static numbers, users see trends visually.
Visuals Used on the KPI Trend Page
- MTD Combo Chart
- YTD Combo Chart
Each chart compares:
- Current Year Actual
- Previous Year Actual
- Target values
Because these charts use the same scale, users spot growth, decline, and seasonality easily.

Click to buy Refinery Procurement KPI Dashboard in Power BI
KPI Selection Slicer
A slicer on the left allows users to select a specific KPI. As a result, charts update instantly, and analysis becomes focused and precise.
What Is the KPI Definition Page and Why Is It Important?
The KPI Definition Page acts as a reference and governance layer. Although this page remains hidden, users can drill through from the Summary Page when required.
Information Available on the KPI Definition Page
- KPI Number
- KPI Group
- KPI Name
- Unit
- Formula
- Definition
- KPI Type (LTB or UTB)
Because this page explains how each KPI works, misunderstandings reduce, and reporting stays consistent across teams.

Click to buy Refinery Procurement KPI Dashboard in Power BI
How Does Drill-Through Improve Usability?
When users right-click a KPI on the Summary Page and drill through, they reach the KPI Definition Page instantly. After reviewing details, users return using the Back button placed at the top-left corner.
As a result, navigation stays smooth and intuitive.
What Excel Data Structure Supports This Dashboard?
This dashboard uses Excel as its backend. Therefore, updates remain simple, fast, and error-free.
Excel Sheets Used
Input_Actual Sheet
In this sheet, users enter:
- KPI Name
- Month (first date of the month)
- MTD Actual value
- YTD Actual value
Because the structure remains fixed, Power BI reads data correctly every time.

Click to buy Refinery Procurement KPI Dashboard in Power BI
Input_Target Sheet
In this sheet, users enter:
- KPI Name
- Month (first date of the month)
- MTD Target value
- YTD Target value
As a result, comparisons calculate automatically in Power BI.
KPI Definition Sheet
This sheet defines governance and meaning:
- KPI Number
- KPI Group
- KPI Name
- Unit
- Formula
- Definition
- Type (LTB or UTB)
Therefore, this sheet acts as the backbone of the entire dashboard.
Advantages of a Refinery Procurement KPI Dashboard in Power BI
Why Should Refineries Use This Dashboard?
This dashboard delivers measurable and practical benefits across procurement operations.
Key Advantages
- Centralized visibility for all procurement KPIs
- Time savings through automated reporting
- Target tracking with visual indicators
- Trend analysis using MTD and YTD comparisons
- Improved accountability across teams
- Excel-based data entry without technical barriers
As a result, refineries gain better control over procurement performance.
Who Can Use This Dashboard?
This dashboard suits multiple refinery roles:
- Procurement Managers
- Supply Chain Leaders
- Operations Heads
- Finance Teams
- Plant Management
- Strategy and Planning Teams
Because the interface remains intuitive, both technical and non-technical users benefit.
How Does This Dashboard Support Better Decision-Making?
Since the dashboard updates in real time after data refresh, decision-makers always work with current information. Moreover, visual cues such as icons and trend lines reduce analysis time significantly.
Therefore, teams move from data collection to action much faster.
Best Practices for the Refinery Procurement KPI Dashboard in Power BI
How Can You Get Maximum Value from This Dashboard?
To ensure long-term success, follow these best practices.
Maintain Consistent KPI Definitions
Always update the KPI Definition sheet carefully. Consistency ensures accurate reporting.
Update Data Monthly
Enter actual and target values on a fixed schedule. Regular updates keep insights reliable.
Use KPI Groups Effectively
Categorize KPIs logically to improve filtering and analysis.
Monitor Icons Daily
Focus on red ▼ icons first. These indicators highlight urgent issues.
Compare CY vs PY Trends
Use year-over-year comparisons to identify structural improvements or declines.
Limit Manual Changes in Power BI
Update data only in Excel. Avoid altering visuals frequently.
Train Users on Drill-Through
Ensure users understand how to access KPI definitions for clarity.
How Does This Dashboard Improve Procurement Governance?
Governance improves because:
- KPIs follow standardized definitions
- Performance metrics remain transparent
- Accountability becomes measurable
- Management receives consistent reports
Therefore, the dashboard supports compliance, audits, and long-term strategy.
Conclusion: Why the Refinery Procurement KPI Dashboard in Power BI Matters
The Refinery Procurement KPI Dashboard in Power BI transforms raw procurement data into clear, actionable insights. Instead of spending hours compiling reports, teams focus on improving performance.
Because the dashboard combines Excel simplicity with Power BI visualization power, it suits refineries that demand accuracy, speed, and flexibility. Moreover, its structured design ensures long-term usability and scalability.
If refineries aim to control costs, meet targets, and improve procurement efficiency, this dashboard becomes an essential tool.
Frequently Asked Questions (FAQs)
What is a Refinery Procurement KPI Dashboard in Power BI?
It is a ready-to-use Power BI dashboard that tracks procurement KPIs using Excel data.
Can non-technical users update the dashboard?
Yes. Users only update Excel sheets and refresh Power BI.
Does the dashboard support MTD and YTD analysis?
Yes. It includes detailed MTD and YTD comparisons with targets and previous year data.
Can I add new KPIs?
Yes. You can add KPIs by updating the Excel input and definition sheets.
Is this dashboard suitable for large refineries?
Yes. The structure supports scaling and multiple KPI groups.
Does it show visual performance indicators?
Yes. It uses green ▲ and red ▼ icons for instant status tracking.
Can management drill into KPI definitions?
Yes. A hidden drill-through page provides formulas and definitions.
Watch the step-by-step video tutorial:
Visit our YouTube channel to learn step-by-step video tutorials
Click to buy Refinery Procurement KPI Dashboard in Power BI