Managing refinery purchasing operations without clear visibility often leads to cost overruns, delayed approvals, and missed savings opportunities. However, when organizations implement a Refinery Purchasing Dashboard in Power BI, they gain real-time insights, better control, and confident decision-making. Therefore, refinery procurement teams increasingly rely on Power BI dashboards to track performance, optimize spending, and improve supplier negotiations.
In this detailed guide, you will learn everything about the Refinery Purchasing Dashboard in Power BI. Moreover, you will understand its structure, features, advantages, best practices, and real-world use cases. Additionally, this article explains how Power BI transforms complex purchasing data into actionable insights for refinery operations.
Click to Purchases Refinery Purchasing Dashboard in Power BI
What Is a Refinery Purchasing Dashboard in Power BI?
A Refinery Purchasing Dashboard in Power BI is a centralized and interactive analytics solution designed to monitor procurement performance across refinery operations. Instead of relying on scattered spreadsheets and static reports, this dashboard consolidates all purchasing KPIs into one dynamic visual platform.
As a result, procurement managers, buyers, finance teams, and leadership can analyze budgets, baseline costs, negotiated savings, and high-priority purchases instantly. Furthermore, Power BI allows users to slice and filter data by category, refinery plant, requesting department, buyer, and time period.
Because Power BI supports real-time visuals, advanced calculations, and interactive filters, this dashboard delivers clarity, speed, and accuracy for refinery purchasing management.
Why Do Refineries Need a Purchasing Dashboard?
Refinery purchasing involves high-value contracts, strict timelines, and multiple stakeholders. Therefore, even small inefficiencies can create significant financial impact. Without a structured dashboard, teams struggle to track savings, control budgets, and prioritize urgent requests.
However, a Refinery Purchasing Dashboard in Power BI solves these challenges by offering:
-
Centralized procurement visibility
-
Real-time performance tracking
-
Clear cost and savings analysis
-
Faster decision-making
As a result, refineries gain transparency, accountability, and operational efficiency across procurement activities.
Key Features of Refinery Purchasing Dashboard in Power BI
This professionally designed dashboard includes five powerful pages, each focusing on a critical purchasing dimension. Moreover, every page includes slicers (filters) that allow users to drill down into specific data instantly.
Overview Page: How Does the Overview Dashboard Help Decision-Makers?
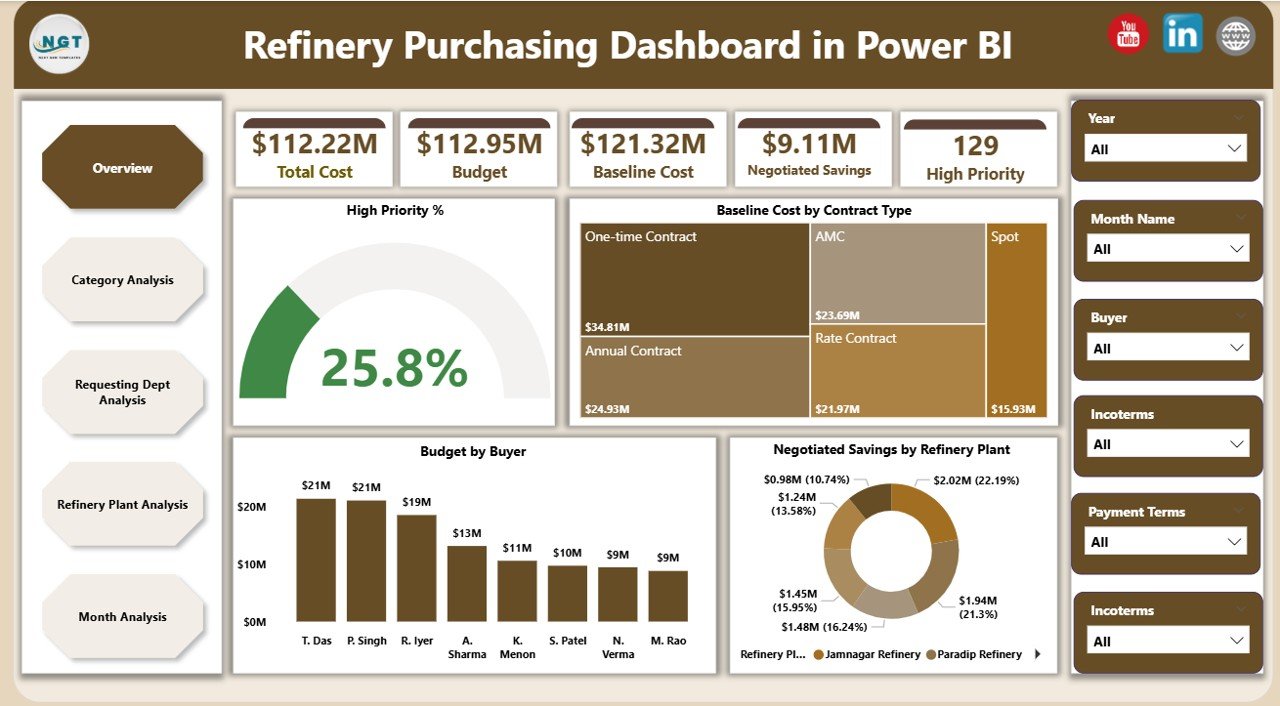
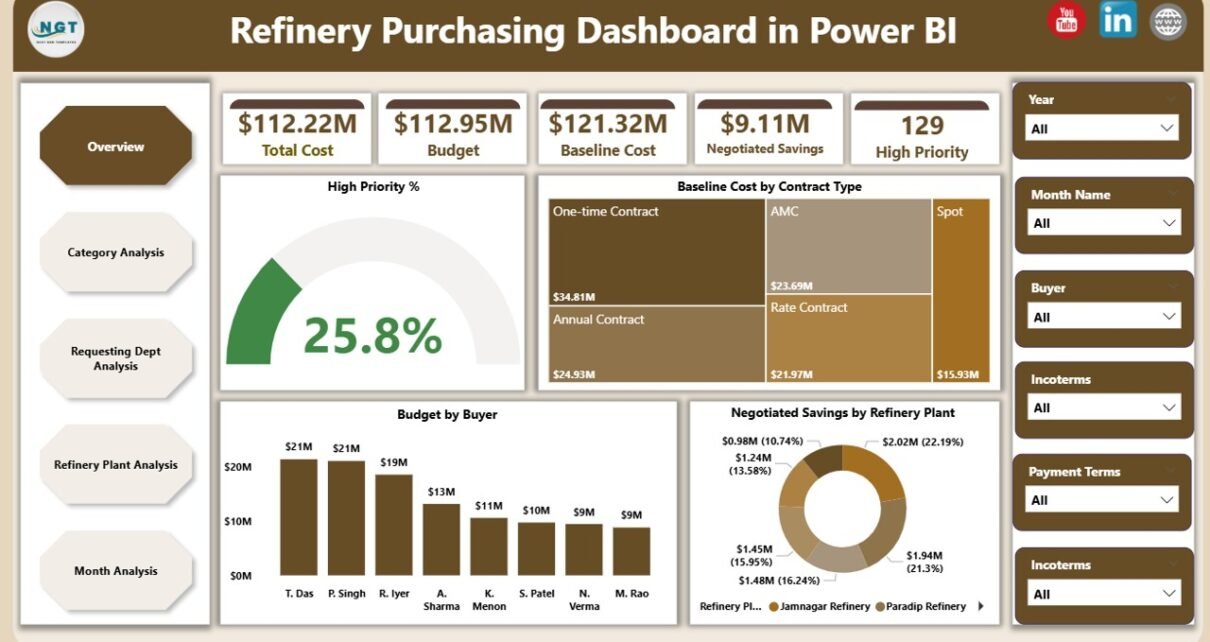
The Overview Page acts as the command center of the dashboard. Therefore, it provides a quick snapshot of overall purchasing performance.
Key Elements of the Overview Page
KPI Cards
-
High Priority %
-
Baseline Cost
-
Total Budget
-
Negotiated Savings
Charts Included
-
📊 High Priority % – Shows the percentage of urgent or critical purchase requests
-
📊 Baseline Cost by Contract Type – Compares cost distribution across contract categories
-
📊 Budget by Buyer – Displays purchasing responsibility and spend allocation
-
📊 Negotiated Savings by Refinery Plant – Highlights savings achieved at each refinery location
Because this page delivers instant insights, leadership can quickly identify cost drivers, savings performance, and priority areas.
Click to Purchases Refinery Purchasing Dashboard in Power BI
Category Analysis Page: Why Is Category-Wise Analysis Important?
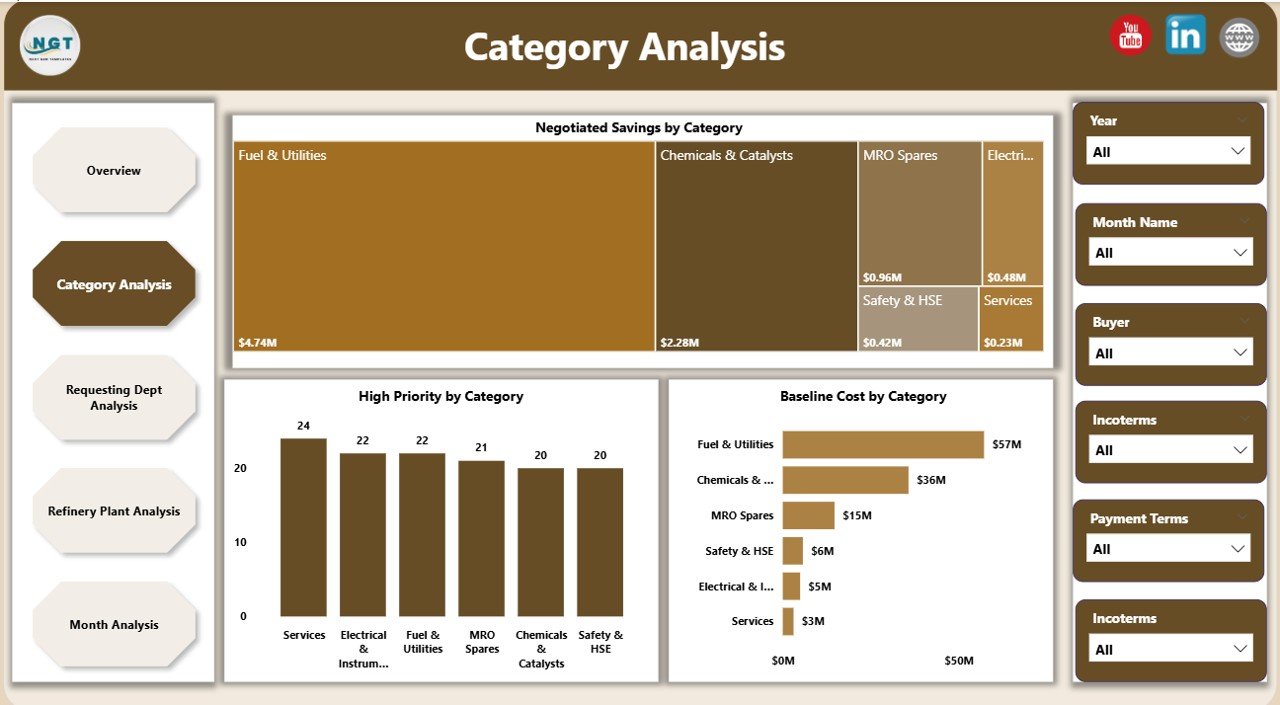
The Category Analysis Page focuses on procurement performance by purchasing category. Therefore, it helps organizations understand where money goes and where savings opportunities exist.
Charts on the Category Analysis Page
-
📈 Negotiated Savings by Category – Identifies high-performing categories
-
📈 High Priority by Category – Highlights categories with urgent demand
-
📈 Baseline Cost by Category – Shows spending concentration
As a result, procurement teams can optimize category strategies, renegotiate contracts, and reduce unnecessary costs.
Requesting Department Analysis: How Do Departments Impact Purchasing Performance?

Different departments raise purchase requests with varying urgency and cost impact. Therefore, the Requesting Department Analysis Page helps track departmental purchasing behavior.
Charts Included
-
📊 Negotiated Savings by Requesting Department
-
📊 Budget by Requesting Department
-
📊 Baseline Cost by Requesting Department
Because this page highlights department-wise trends, management can enforce accountability and encourage cost-efficient purchasing practices.
Refinery Plant Analysis: How Does Plant-Wise Visibility Improve Control?
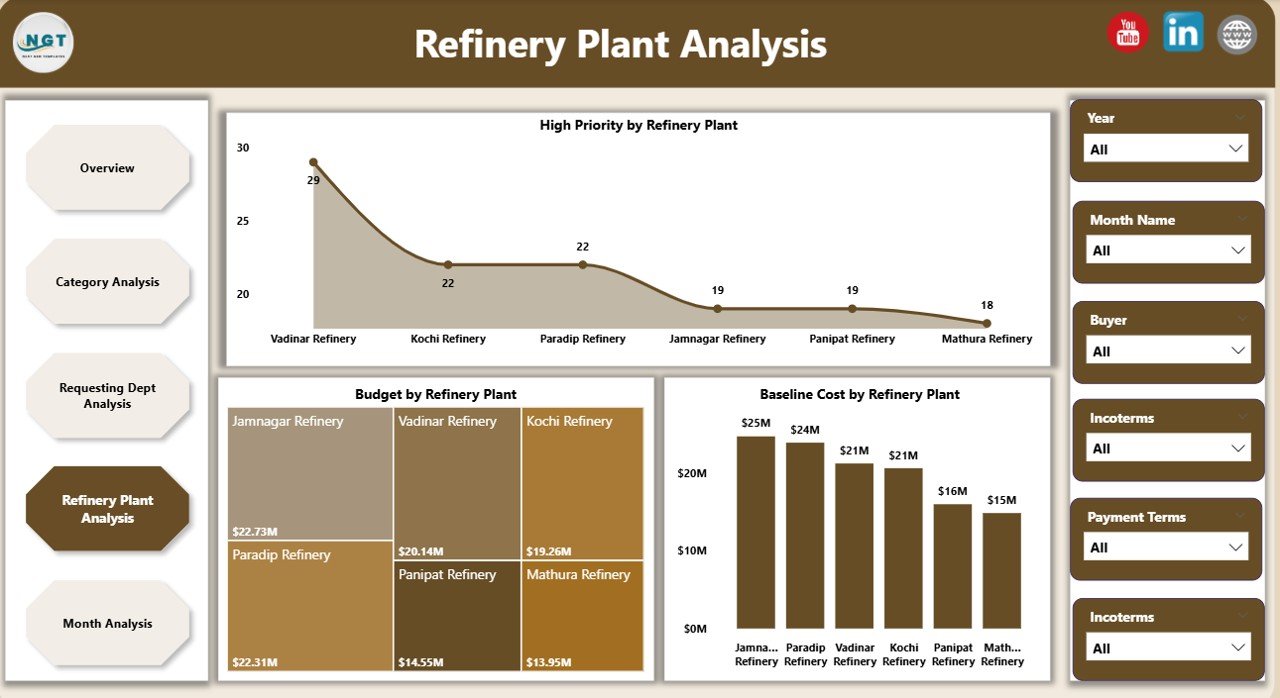
Refineries often operate across multiple locations. Therefore, tracking plant-wise purchasing performance becomes critical.
Charts on the Refinery Plant Analysis Page
-
📉 High Priority by Refinery Plant
-
📉 Budget by Refinery Plant
-
📉 Baseline Cost by Refinery Plant
As a result, organizations can compare plants, control overspending, and standardize procurement processes across locations.
Monthly Trends Page: Why Are Time-Based Trends Essential?
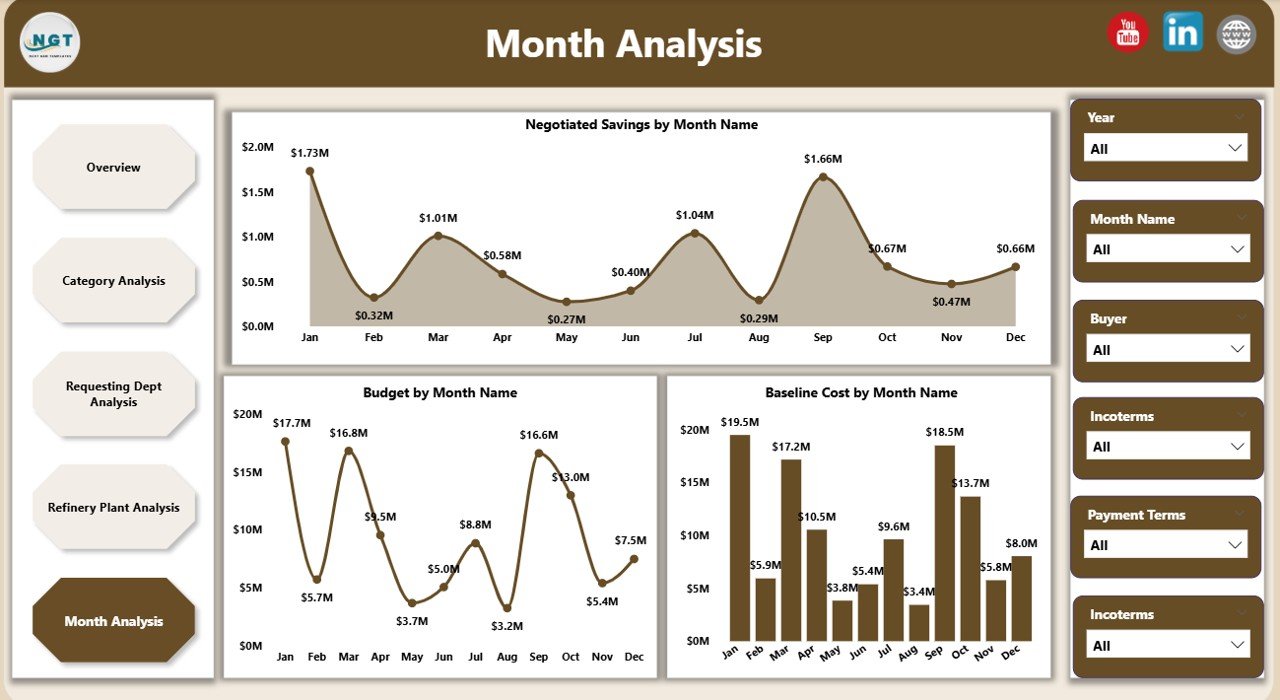
The Monthly Trends Page focuses on time-based performance. Therefore, it helps identify seasonal patterns, budget fluctuations, and savings consistency.
Charts Included
-
📈 Negotiated Savings by Month
-
📈 Budget by Month
-
📈 Baseline Cost by Month
Because this page reveals trends over time, procurement teams can forecast budgets, plan negotiations, and prevent cost escalations.
Advantages of Refinery Purchasing Dashboard in Power BI
Implementing a Refinery Purchasing Dashboard in Power BI delivers multiple strategic benefits.
1. Centralized Procurement Visibility
This dashboard consolidates all purchasing KPIs into one platform. Therefore, users no longer rely on scattered files or manual reports.
2. Improved Cost Control
Because the dashboard tracks baseline cost, budget, and savings together, teams can control spending proactively.
3. Faster and Smarter Decisions
With real-time visuals and slicers, decision-makers analyze data instantly. As a result, approvals and corrective actions happen faster.
4. Enhanced Savings Tracking
The dashboard highlights negotiated savings clearly. Therefore, procurement teams can measure negotiation success accurately.
5. Increased Accountability
Department-wise, buyer-wise, and plant-wise insights ensure transparency and responsibility across the organization.
Best Practices for the Refinery Purchasing Dashboard in Power BI
Click to Purchases Refinery Purchasing Dashboard in Power BI
To maximize value, organizations should follow proven best practices.
1. Standardize Data Sources
Always use clean and consistent procurement data. Therefore, dashboards remain accurate and reliable.
2. Define Clear KPIs
Select KPIs that align with refinery procurement goals. For example, focus on savings, budget utilization, and priority requests.
3. Use Consistent Time Filters
Maintain standard monthly and yearly time dimensions. As a result, trend analysis stays meaningful.
4. Optimize Visual Design
Use simple charts, clear labels, and minimal clutter. Therefore, users understand insights quickly.
5. Train End Users
Ensure procurement and finance teams understand how to use slicers and filters. As a result, dashboard adoption increases.
Who Can Benefit from a Refinery Purchasing Dashboard in Power BI?
This dashboard supports multiple stakeholders:
-
🏭 Refinery Procurement Managers
-
💼 Buyers and Category Managers
-
💰 Finance and Cost Control Teams
-
📊 Supply Chain Analysts
-
🧑💼 Senior Management
Because the dashboard serves diverse roles, it becomes a powerful enterprise-wide decision tool.
How Does Power BI Improve Refinery Procurement Analytics?
Power BI offers advanced analytics capabilities that traditional tools cannot match.
-
Interactive slicers and filters
-
Real-time data refresh
-
Advanced DAX calculations
-
Secure role-based access
-
Easy sharing across teams
As a result, refinery organizations gain deeper insights with minimal effort.
Common Challenges Without a Purchasing Dashboard
Without a structured dashboard, refineries often face:
-
Poor visibility into costs
-
Delayed decision-making
-
Inconsistent savings tracking
-
Manual reporting errors
-
Lack of accountability
However, a Refinery Purchasing Dashboard in Power BI eliminates these issues effectively.
Conclusion: Why Should You Use a Refinery Purchasing Dashboard in Power BI?
A Refinery Purchasing Dashboard in Power BI transforms how organizations manage procurement. Instead of reactive decision-making, teams gain proactive control. Moreover, the dashboard delivers transparency, efficiency, and measurable savings.
Because refinery purchasing involves high financial stakes, using Power BI ensures accuracy, speed, and confidence. Therefore, organizations that adopt this dashboard gain a strong competitive advantage.
Frequently Asked Questions (FAQs)
What is the main purpose of a Refinery Purchasing Dashboard in Power BI?
The main purpose is to monitor procurement performance, control budgets, and track negotiated savings in real time.
Can this dashboard handle large procurement datasets?
Yes, Power BI efficiently handles large datasets and refreshes data automatically.
Is this dashboard suitable for multiple refinery plants?
Absolutely. The dashboard supports plant-wise analysis and comparison.
Can users customize KPIs and visuals?
Yes, Power BI allows full customization based on organizational needs.
Does this dashboard support monthly and yearly analysis?
Yes, the Monthly Trends page enables both short-term and long-term performance analysis.
Visit our YouTube channel to learn step-by-step video tutorials