Introduction
Welcome to our fun and informative corner! Today, we’re going to unravel the magic behind creating a dynamic “Road and Flag infographics chart” in Excel. This isn’t just a blog post; it’s your gateway to becoming an Excel infographic pro. Plus, we’ve got a neat video and a practice file to get your hands dirty (well, digitally!).
Why the Road and Flag infographics chart
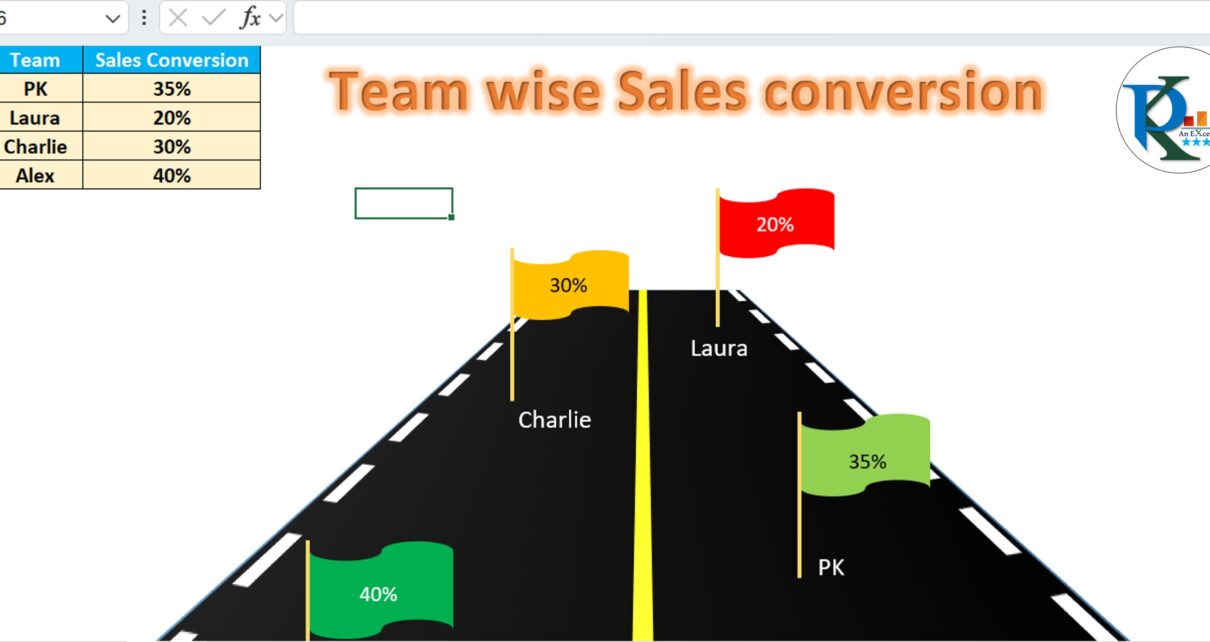
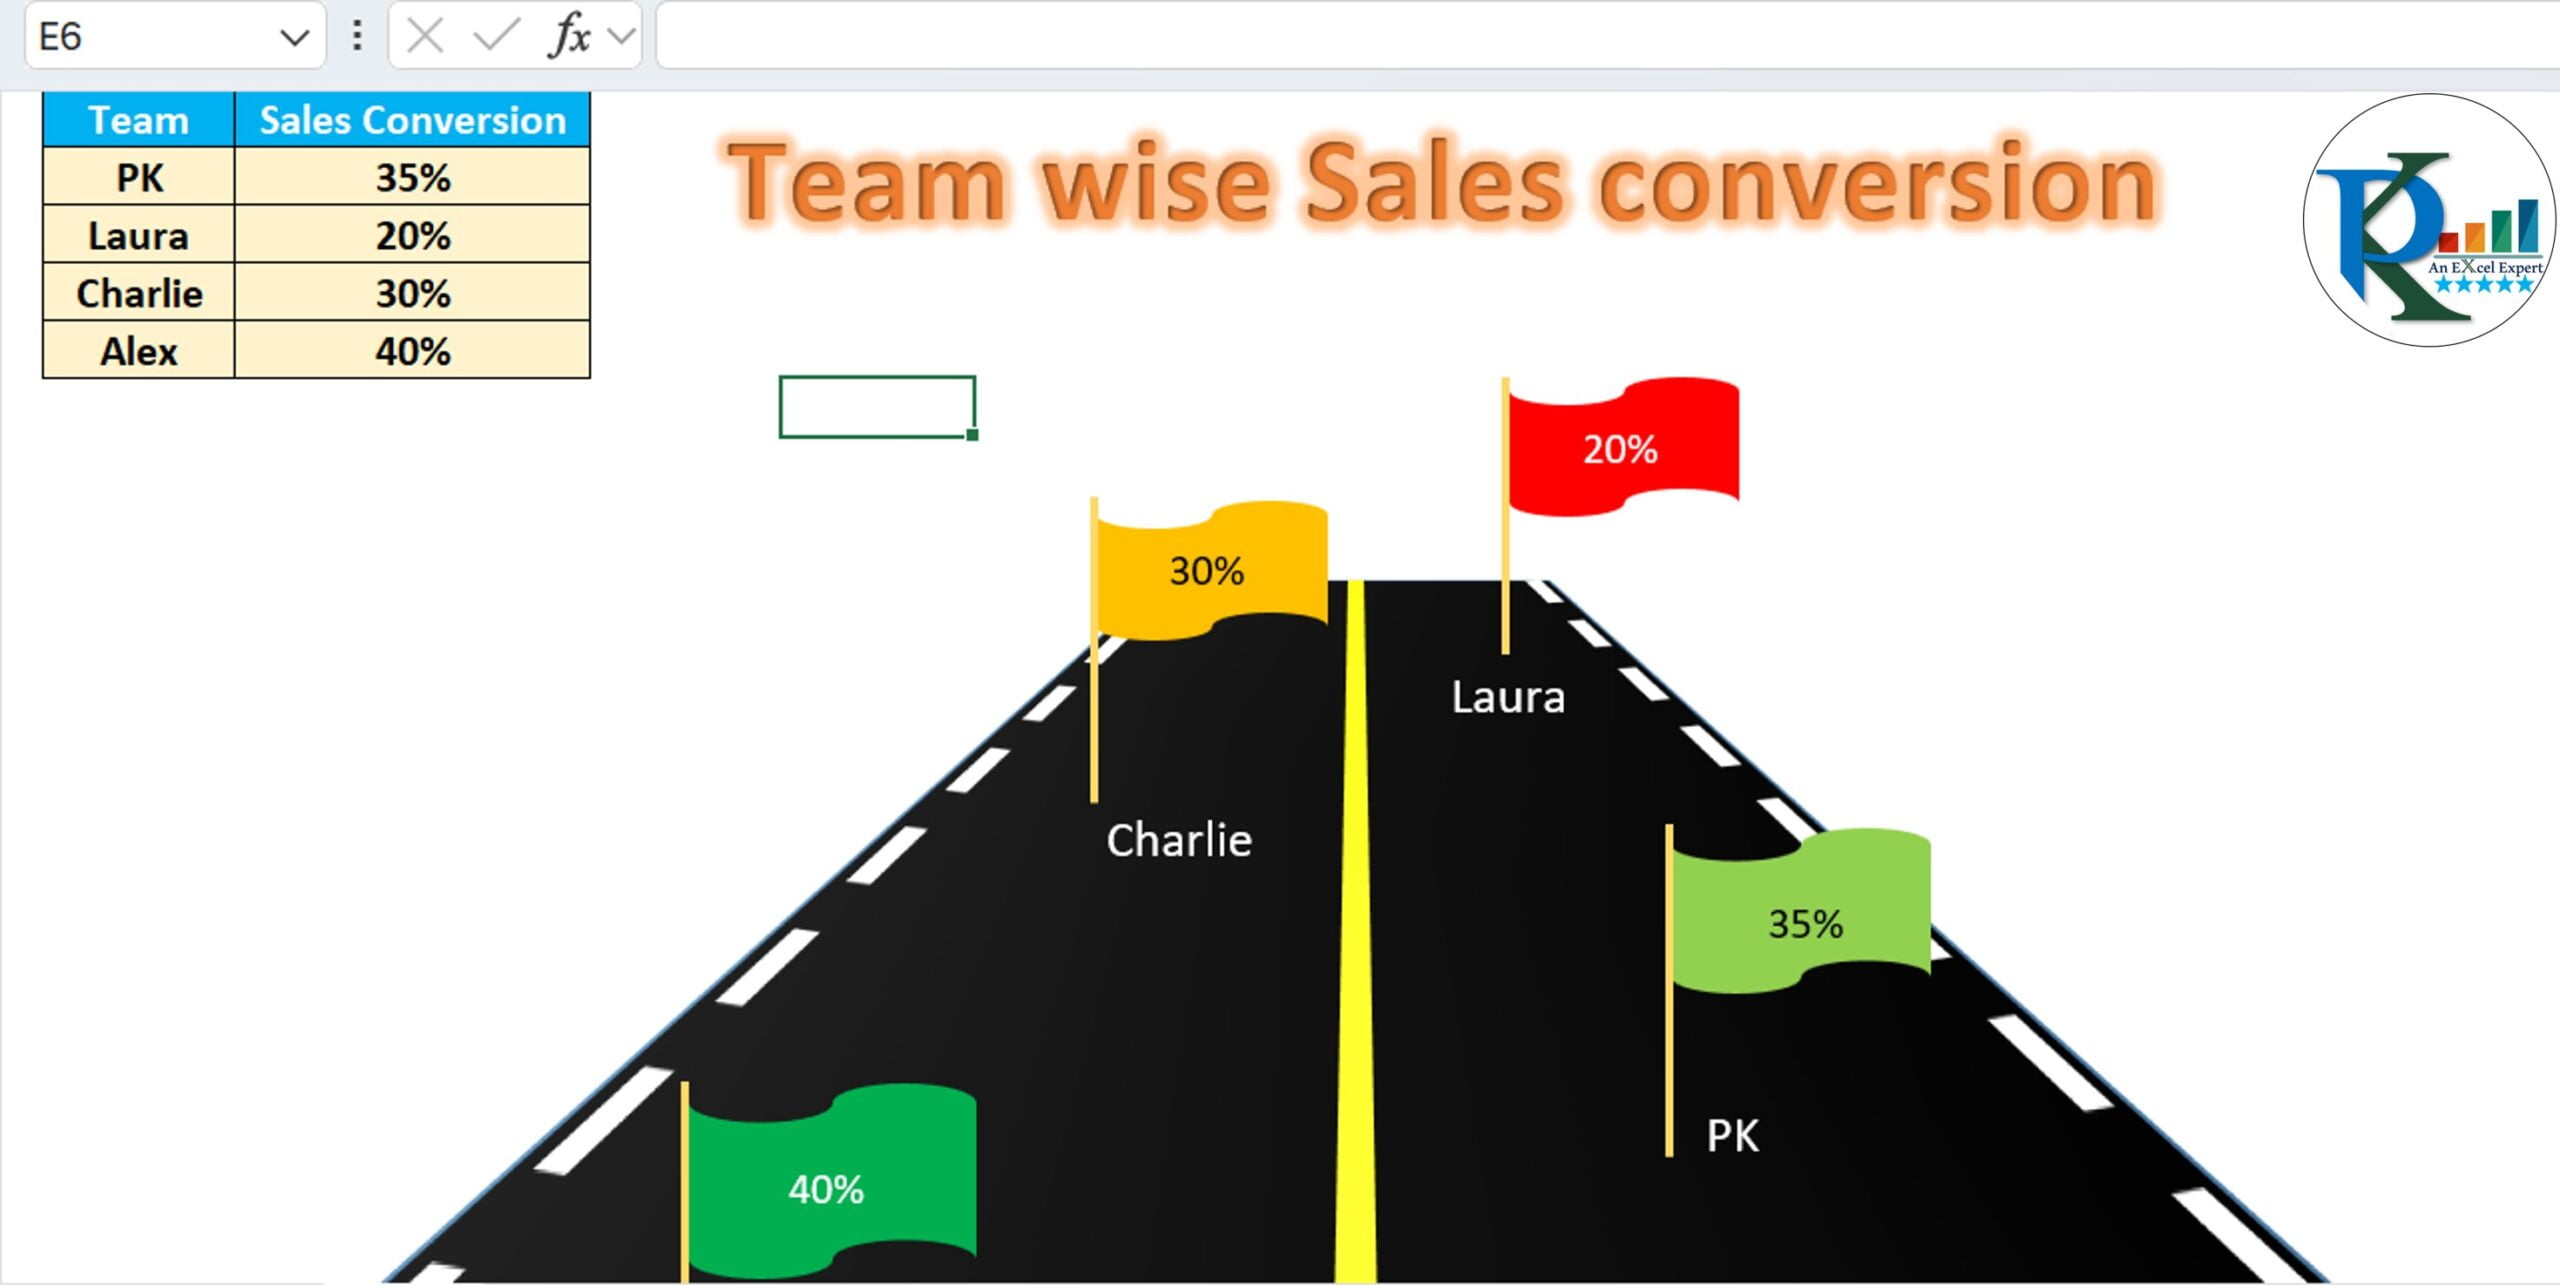
Let’s start off by saying this chart is super cool. It’s not just a bunch of numbers and bars. It’s a vibrant, living chart that changes as you update your data. Imagine a road with flags that shift and dance as your sales data changes. That’s what we’re building today!
Click to buy Road and Flag infographics chart in Excel
Your Roadmap to Excel Infographic Awesomeness
-
Data Entry: Where It All Begins
First Things First: Pop your team-wise sales conversion data into Excel, right in the range of B1:C5. Easy-peasy!
-
Flags That Move with Your Data
Here’s the Cool Part: Change the values between B2 and B5 and voilà! The flags on your chart will update automatically. It’s like having a conversation with your data!
-
Laying Down the Road
Building the Foundation: The road is the backbone of our chart. You’ll learn how to lay it down, step by simple step.
-
Flag Placement: The Fun Part
Flags Ahoy!: Once your road is set, it’s time to plant those flags. Each one tells a story about your data.
-
Making It Shine
The Cherry on Top: We’ll walk you through the nifty tricks to make your chart not just informative, but also a feast for the eyes.
Click to buy Road and Flag infographics chart in Excel
See It to Believe It: Our Video Tutorial
Now, for the most exciting part! Check out our detailed video tutorial. It’s right here, in this blog post. Watching the steps unfold visually is a game-changer for your learning experience.
Visit our YouTube channel to learn step-by-step video tutorials
Watch the step-by-step video tutorial:
Get Your Hands on the Practice File
And here’s the clincher – download our practice file linked below. There’s no better teacher than experience. Play around with the file, make mistakes, learn, and have fun!
Click to buy Road and Flag infographics chart in Excel
Wrapping It Up
Creating the Road and Flag Chart in Excel is like painting with numbers. It’s fun, engaging, and super useful. Whether you’re an Excel newbie or a seasoned pro, this tutorial is designed to up your data visualization game. So, let’s dive in and turn those boring spreadsheets into a canvas of information and beauty!
🔥 Hungry for more Excel tips? Keep exploring our blog and tutorials. Your path to Excel mastery is filled with fun and learning, and we’re here to guide you every step of the way! Let’s excel together! 🚀
Click to buy Road and Flag infographics chart in Excel