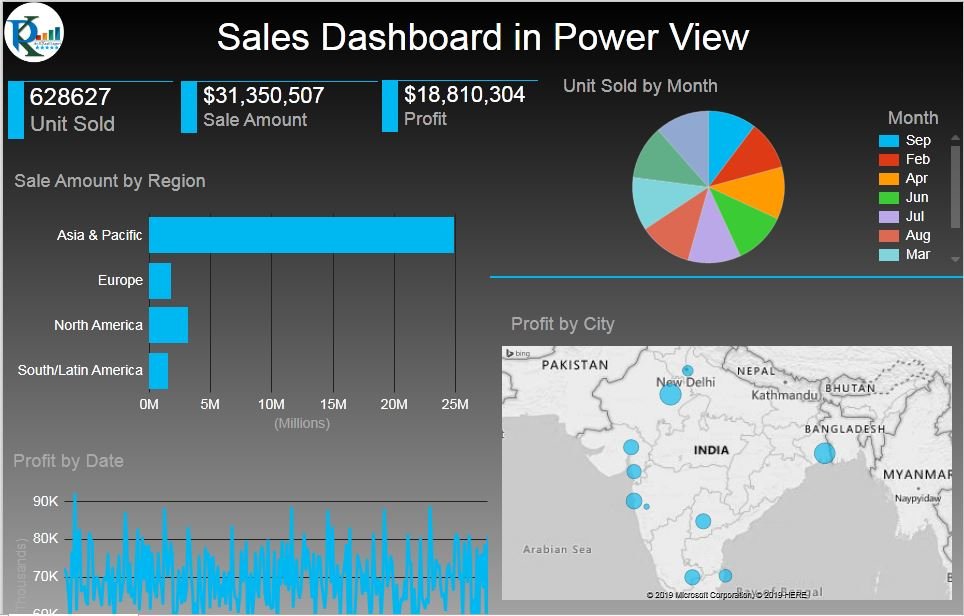
This tutorial demonstrates a legacy sales dashboard built with Power View in Excel 2013. The original screenshot and video show that historical workflow. It is not a current Microsoft 365 Power View tutorial.
Version and compatibility note
Microsoft removed Power View from Excel for Microsoft 365 starting in October 2021, and Excel 2021 does not include it. Excel 2013 reached end of support in April 2023. Check your environment before purchasing this legacy template. See Microsoft’s Power View roadmap and Excel 2013 support information. Power BI Desktop is Microsoft’s recommended migration direction; this article does not claim that the template has been converted or tested there.
Sales Dashboard Power View in Excel 2013
In this article, we have created a beautiful Sales Dashboard Power View in Excel 2013.
Click to buy Sales Dashboard Power View in Excel 2013
What is Power View?
Power View is a data visualization technology that lets you create interactive charts, graphs, maps, and other visuals that bring your data to life. Historically, Power View was used across Excel and Microsoft reporting products; availability depended on the product version and environment.
There are a few system requirements for Power View, based on which version of Excel, SharePoint, or SQL Server you use.
Watch the step by step video tutorial:
Click to buy Sales Dashboard Power View in Excel 2013