The agriculture industry moves fast. Demand changes with seasons. Raw material prices fluctuate often. Production targets shift frequently. Therefore, manufacturers must track revenue, cost, profit margin, plant performance, and sales channels in real time.
However, many seed and fertilizer companies still rely on scattered Excel sheets. As a result, managers struggle to monitor production plants. They miss cost overruns. They fail to compare regions properly. Moreover, they cannot track monthly profit trends clearly.
So, how can you monitor profit margin, total revenue, total cost, plant performance, product categories, and monthly trends in one powerful system?
The answer is simple.
Click to Purchases Seed and Fertilizer Manufacturing Dashboard in Power BI
You need a Seed and Fertilizer Manufacturing Dashboard in Power BI.
In this detailed guide, you will learn:
-
What a Seed and Fertilizer Manufacturing Dashboard in Power BI is
-
Why manufacturing companies need it
-
Detailed explanation of all 5 dashboard pages
-
Key metrics included
-
Advantages of Seed and Fertilizer Manufacturing Dashboard in Power BI
-
Best Practices for the Seed and Fertilizer Manufacturing Dashboard
-
Frequently Asked Questions with Answers
Let us explore everything step by step.
What Is a Seed and Fertilizer Manufacturing Dashboard in Power BI?
A Seed and Fertilizer Manufacturing Dashboard in Power BI is a ready-to-use business intelligence solution designed specifically for seed producers, fertilizer manufacturers, agrochemical companies, and agricultural supply chains.
It collects raw operational data and transforms it into:
-
Interactive charts
-
Profitability insights
-
Plant performance reports
-
Sales channel analysis
-
Monthly trend dashboards
Moreover, Power BI allows you to use slicers (filters) to drill down into specific regions, customer types, plant names, product categories, and months. Therefore, decision-makers can analyze data quickly and take immediate action.
Instead of checking multiple reports, you can monitor everything in one structured dashboard file.
Why Do Seed and Fertilizer Manufacturers Need This Dashboard?
Agriculture manufacturing involves complex operations. Companies manage multiple plants. They sell through different sales channels. They supply to various customer types. They also face seasonal demand fluctuations.
Therefore, companies need:
-
Real-time revenue tracking
-
Cost monitoring by plant
-
Profit margin analysis by product category
-
Sales channel performance comparison
-
Monthly profitability trends
Without a structured dashboard, managers depend on manual reports. However, manual reporting consumes time. It also increases errors. As a result, companies lose opportunities.
On the other hand, a Power BI dashboard delivers:
-
Clear visual reports
-
Instant KPI monitoring
-
Easy drill-down capability
-
Accurate profit analysis
Thus, leadership teams can take faster and smarter decisions.
Detailed Explanation of All 5 Dashboard Pages
This Seed and Fertilizer Manufacturing Dashboard in Power BI contains 5 powerful pages. Each page focuses on a specific business area.
Let us understand each page clearly.
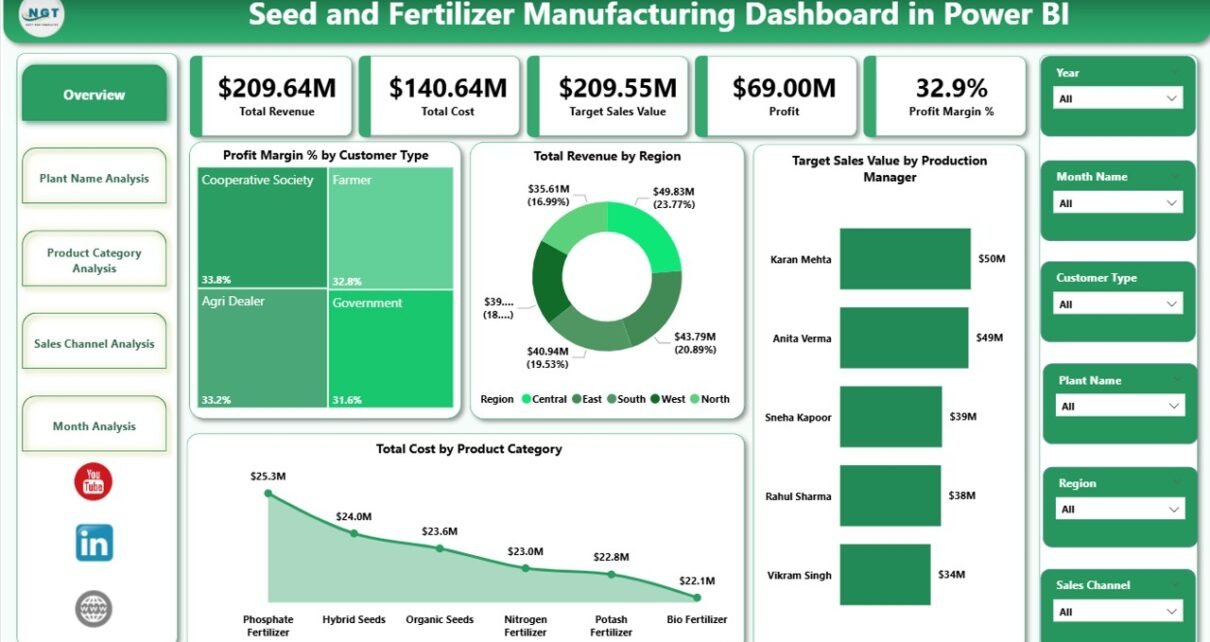
1️⃣ Overview Page – How Does It Give a Quick Business Snapshot?
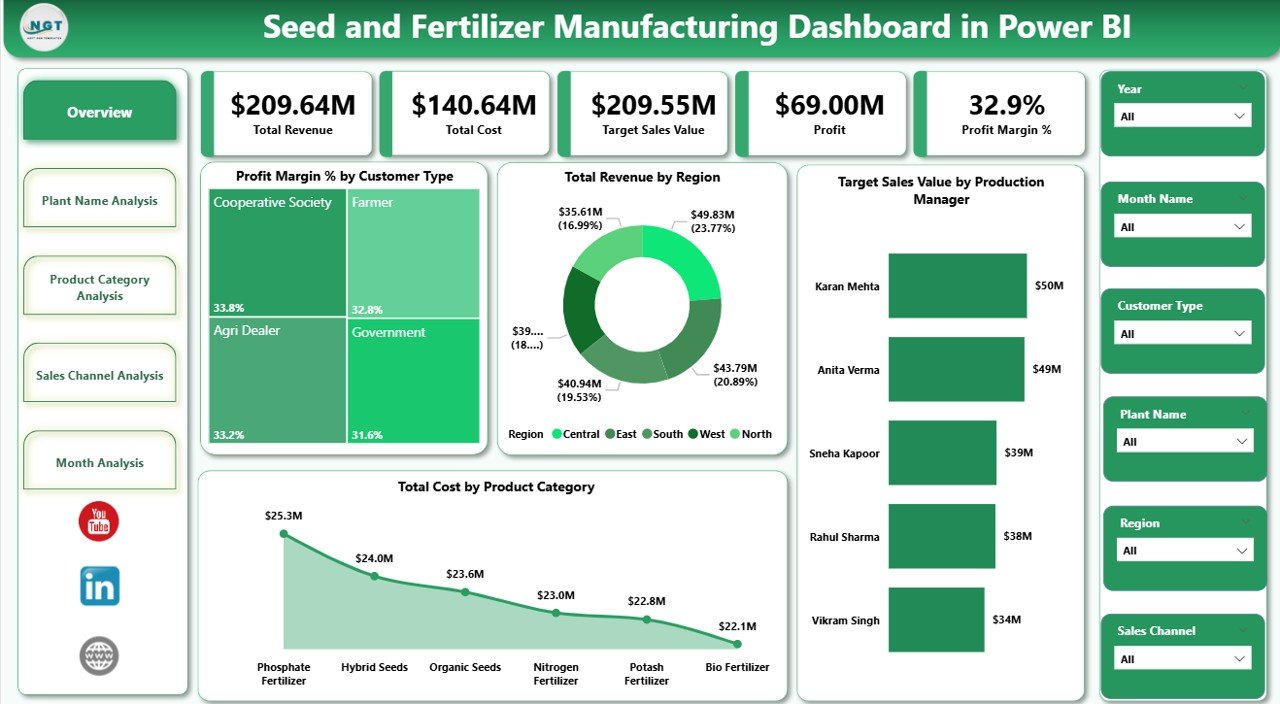
The Overview Page acts as the control center of the dashboard.
Here, you get a high-level view of overall business performance.
Key Elements on the Overview Page
You will find:
-
Profit Margin % by Customer Type
-
Total Revenue by Region
-
Target Sales Value by Production Manager
-
Total Cost by Product Category
In addition, slicers allow you to filter the report by:
-
Month
-
Region
-
Customer Type
-
Product Category
-
Production Manager
Why Is This Page Important?
This page helps management answer key questions:
-
Which customer type generates the highest profit margin?
-
Which region delivers maximum revenue?
-
Are production managers meeting sales targets?
-
Which product category drives higher costs?
Therefore, leadership teams can quickly detect performance gaps. Moreover, they can identify profitable segments instantly.
2️⃣ Plant Name Analysis – How Are Different Plants Performing?
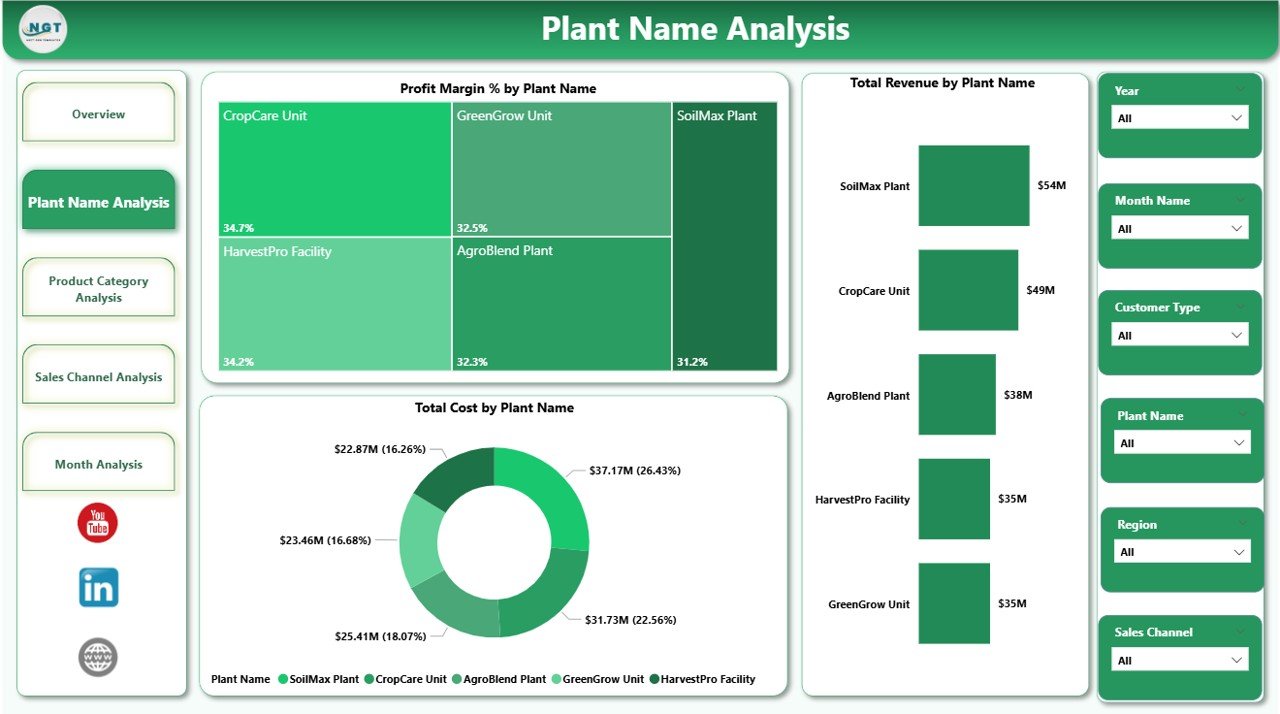
Manufacturing companies often operate multiple plants across different regions. However, not all plants perform equally.
The Plant Name Analysis page focuses on plant-level performance.
Charts Included
-
Profit Margin % by Plant Name
-
Total Revenue by Plant Name
-
Total Cost by Plant Name
What Insights Can You Get?
This page helps you understand:
-
Which plant generates the highest profit margin
-
Which plant contributes maximum revenue
-
Which plant incurs higher costs
-
Whether a plant needs cost optimization
For example, if Plant A generates high revenue but low profit margin, then management can analyze production inefficiencies. On the other hand, if Plant B shows high profit margin, then you can replicate its strategy.
Thus, this page improves operational efficiency.
Click to Purchases Seed and Fertilizer Manufacturing Dashboard in Power BI
3️⃣ Product Category Analysis – Which Products Drive Profit?
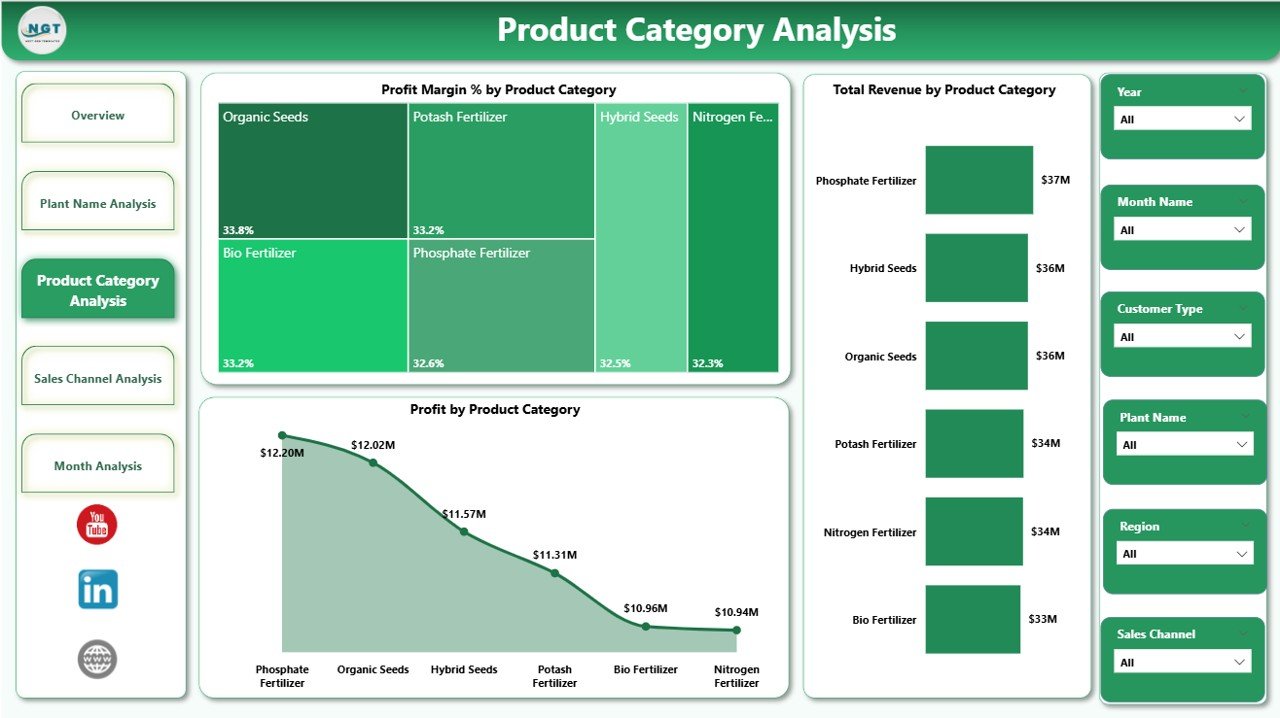
Seed and fertilizer companies manufacture multiple product categories such as:
-
Hybrid Seeds
-
Organic Fertilizers
-
Chemical Fertilizers
-
Micronutrients
-
Crop Protection Products
However, each category performs differently.
The Product Category Analysis page focuses on product-level profitability.
Charts Included
-
Profit Margin % by Product Category
-
Total Revenue by Product Category
-
Profit by Product Category
Why Is This Page Critical?
This page helps you answer:
-
Which product category delivers the highest profit?
-
Which category generates maximum revenue?
-
Which category needs pricing improvement?
For example, if chemical fertilizers generate high revenue but low profit margin, then cost control strategies must improve. Similarly, if hybrid seeds deliver high profit margin, then the company can increase marketing efforts.
Therefore, product strategy becomes more data-driven.
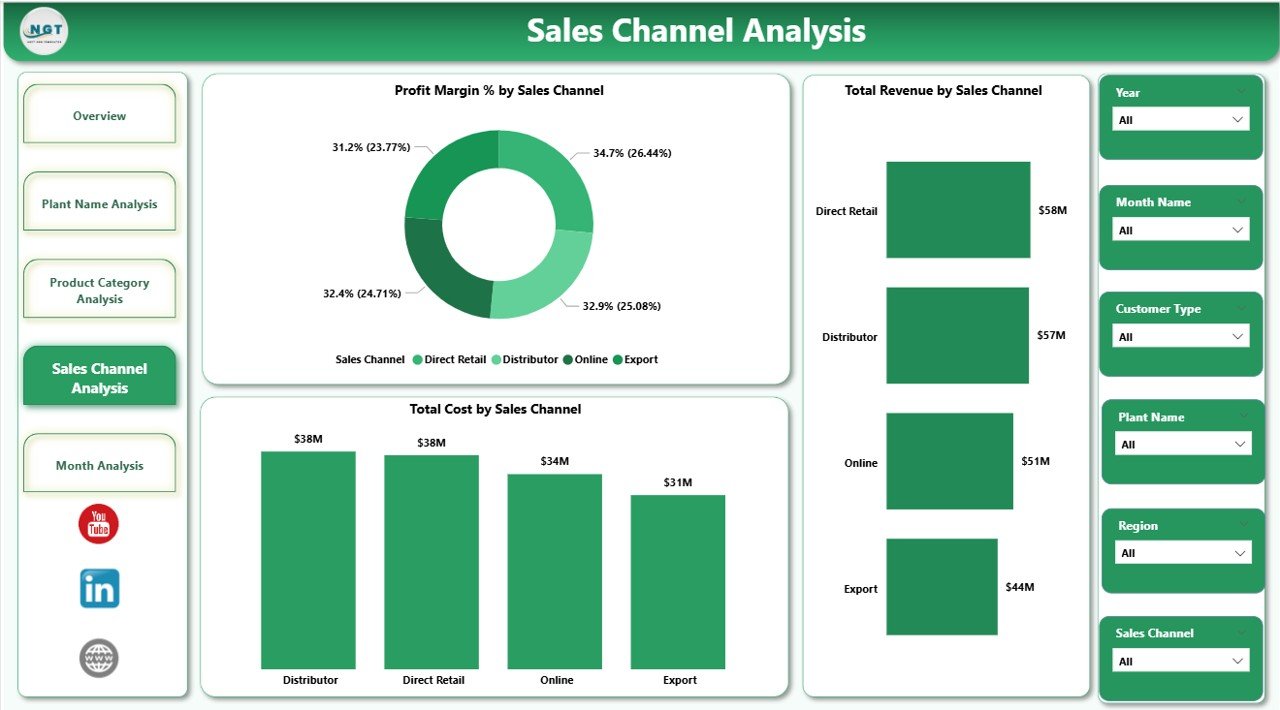
4️⃣ Sales Channel Analysis – Which Channel Performs Best?
Manufacturers sell through different channels such as:
-
Distributors
-
Dealers
-
Direct Sales
-
Online Sales
-
Retail Stores
However, every channel has different revenue and cost structures.
The Sales Channel Analysis page evaluates channel performance.
Charts Included
-
Profit Margin % by Sales Channel
-
Total Revenue by Sales Channel
-
Total Cost by Sales Channel
What Business Decisions Can You Make?
This page allows you to:
-
Compare channel profitability
-
Identify high-cost sales channels
-
Increase focus on profitable channels
-
Optimize commission structures
For instance, if distributor sales show high revenue but also high cost, then you can review margin agreements. On the other hand, if direct sales show strong profit margin, then you can expand that channel.
Thus, sales strategies become more effective.
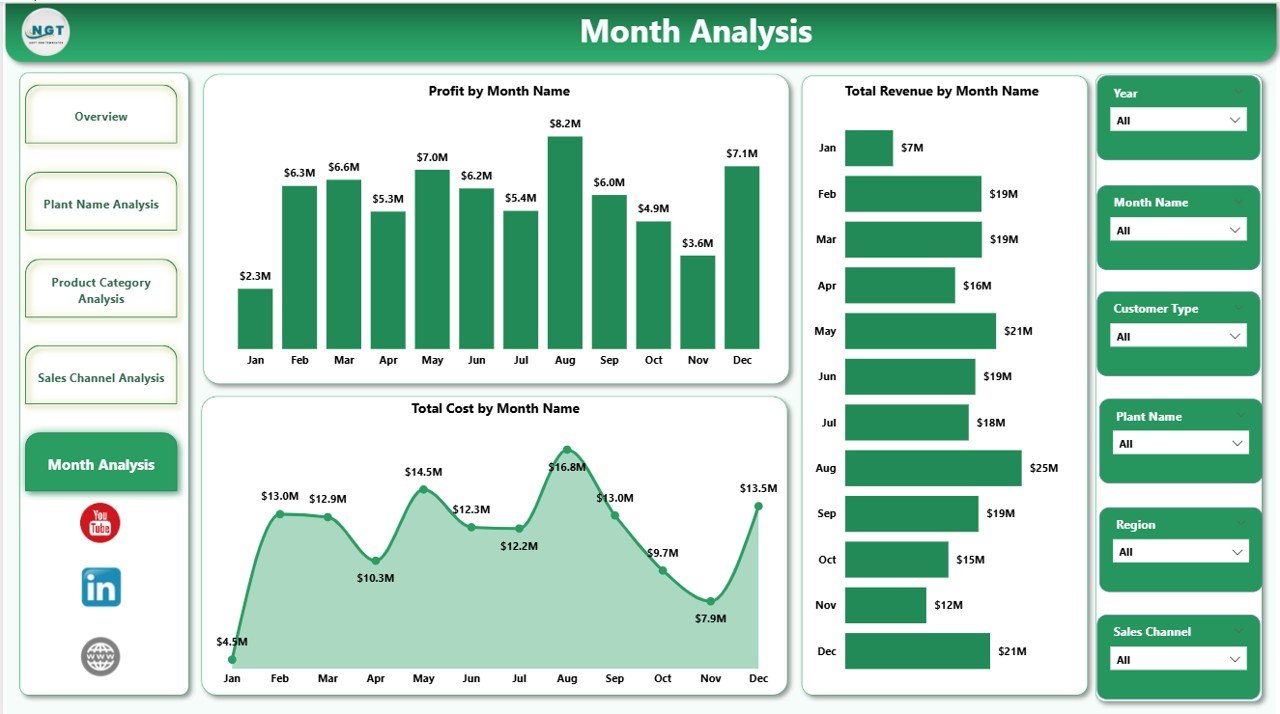
5️⃣ Month Analysis – How Does Monthly Performance Change?
Agriculture follows seasonal patterns. Therefore, monthly analysis becomes extremely important.
The Month Analysis page focuses on time-based trends.
Charts Included
-
Profit by Month
-
Total Revenue by Month
-
Total Cost by Month
Why Monthly Tracking Matters?
This page helps you:
-
Identify peak sales months
-
Detect low-demand seasons
-
Monitor cost fluctuations
-
Forecast future demand
For example, fertilizer demand may rise before sowing season. Therefore, you can plan production accordingly. Similarly, if certain months show cost spikes, then you can review procurement strategies.
Hence, monthly insights improve planning accuracy.
Key KPIs Included in the Dashboard
This dashboard tracks important KPIs such as:
-
Total Revenue
-
Total Cost
-
Profit
-
Profit Margin %
-
Target Sales Value
-
Revenue by Region
-
Profit by Product Category
-
Revenue by Plant
-
Cost by Sales Channel
-
Monthly Profit Trends
These KPIs help management measure performance effectively.
Advantages of Seed and Fertilizer Manufacturing Dashboard in Power BI
Using this dashboard offers multiple advantages.
1. Better Decision Making
You get real-time insights. Therefore, you can take faster decisions.
2. Improved Cost Control
You can track cost by plant, product, and channel. As a result, you reduce unnecessary expenses.
3. Increased Profitability
You can focus on high-margin products and channels. Thus, overall profit improves.
4. Clear Performance Tracking
You can monitor production managers and sales targets easily.
5. Time Saving
You eliminate manual reporting. Therefore, you save valuable time.
Click to Purchases Seed and Fertilizer Manufacturing Dashboard in Power BI
6. Better Forecasting
You can analyze monthly trends. Consequently, you improve demand planning.
Best Practices for the Seed and Fertilizer Manufacturing Dashboard
To get maximum benefit, follow these best practices.
1. Update Data Regularly
Import fresh data weekly or monthly. Accurate data ensures accurate insights.
2. Maintain Clean Data
Remove duplicates. Correct errors. Standardize product and plant names.
3. Use Meaningful Filters
Apply slicers smartly. Compare regions, plants, and months effectively.
4. Monitor Profit Margin Closely
Revenue alone does not indicate success. Always track profit margin %.
5. Review Monthly Trends
Analyze trends consistently. Identify patterns early.
6. Share Dashboard with Management
Export insights and share them during review meetings.
How Does This Dashboard Improve Strategic Planning?
This dashboard connects operations, sales, and finance in one place.
Because of that:
-
Production planning improves
-
Inventory management becomes easier
-
Sales targets align with plant capacity
-
Cost control strengthens
Moreover, leadership teams can align business goals with real performance numbers.
Conclusion
Seed and fertilizer manufacturing involves complex operations. Companies must manage plants, product categories, regions, and sales channels simultaneously.
However, without a structured system, performance tracking becomes difficult. Therefore, a Seed and Fertilizer Manufacturing Dashboard in Power BI becomes essential.
It provides:
-
Clear revenue insights
-
Profit margin analysis
-
Plant-level performance tracking
-
Channel-wise cost analysis
-
Monthly trend monitoring
As a result, businesses improve profitability, reduce costs, and enhance decision-making speed.
If you want to modernize your agricultural manufacturing operations, this dashboard offers the perfect solution.
Frequently Asked Questions with Answers
1. What software do I need to use this dashboard?
You need Microsoft Power BI Desktop to open and use the dashboard file.
2. Can I customize the dashboard?
Yes. You can modify charts, add KPIs, and change filters according to your business needs.
3. Can this dashboard handle multiple plants?
Yes. It supports multiple plant names and compares their performance easily.
4. Does the dashboard support monthly analysis?
Yes. The Month Analysis page shows profit, revenue, and cost trends by month.
5. Can I track sales channels separately?
Yes. The Sales Channel Analysis page compares profit margin, revenue, and cost by channel.
6. Is this dashboard suitable for small manufacturers?
Yes. Both small and large manufacturers can use it effectively.
7. How often should I update the data?
You should update data monthly or weekly to ensure accurate reporting.
Visit our YouTube channel to learn step-by-step video tutorials

