Managing shipbuilding projects demands precision, visibility, and continuous monitoring. However, shipyards often struggle with scattered data, delayed reporting, and limited insights. As a result, decision-makers face challenges in controlling costs, tracking risks, and monitoring project delays. That is exactly why a Shipbuilding Dashboard in Power BI plays a critical role in modern shipbuilding operations.
This detailed guide explains everything you need to know about a Shipbuilding Dashboard in Power BI, including how it works, its key features, advantages, best practices, and real-world use cases. Moreover, this article uses clear language, simple explanations, and practical insights so that anyone can understand and implement it easily.
Click to Purchases Shipbuilding Dashboard in Power BI
What Is a Shipbuilding Dashboard in Power BI?
A Shipbuilding Dashboard in Power BI is an interactive business intelligence solution designed to track, analyze, and visualize key shipbuilding metrics in one centralized platform. Instead of reviewing multiple Excel sheets, reports, and emails, project managers and shipyard leaders can view all critical KPIs in a single dashboard.
Power BI transforms raw shipbuilding data into meaningful visuals such as charts, cards, and trends. As a result, teams gain real-time visibility into costs, risks, project delays, vessel performance, and shipyard productivity.
Most importantly, this dashboard supports better decision-making by presenting accurate and updated information in a visual format.
Why Do Shipbuilding Companies Need a Power BI Dashboard?
Shipbuilding projects involve large budgets, long timelines, and multiple stakeholders. Therefore, even small inefficiencies can result in cost overruns and delivery delays. Traditional reporting methods fail to provide quick insights and real-time monitoring.
A Shipbuilding Dashboard in Power BI solves these challenges by:
-
Centralizing shipbuilding data
-
Improving visibility across projects and shipyards
-
Tracking planned vs actual costs accurately
-
Monitoring risks and delays proactively
-
Supporting data-driven decisions
Because of these benefits, shipbuilding companies increasingly rely on Power BI dashboards to stay competitive.
Key Features of the Shipbuilding Dashboard in Power BI
This Shipbuilding Dashboard in Power BI includes 5 powerful and well-structured pages, each designed to deliver specific insights. Let us explore each page in detail.
Click to Purchases Shipbuilding Dashboard in Power BI
1. Overview Page – A Complete Snapshot of Shipbuilding Performance
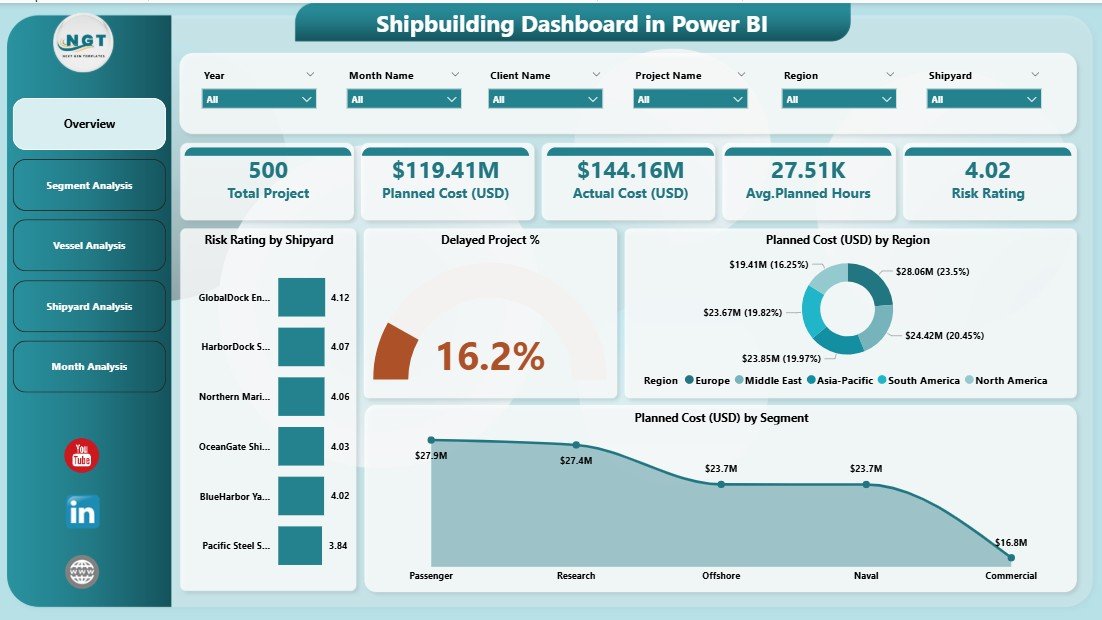
The Overview Page acts as the central hub of the dashboard. It provides a high-level summary of all critical shipbuilding metrics at a glance.
Key Elements of the Overview Page
-
Interactive slicers to filter data by key dimensions
-
4 KPI cards showing high-level metrics
-
4 interactive charts for performance analysis
Charts Available on the Overview Page
-
Risk Rating by Shipyard
-
Delayed Project Percentage
-
Planned Cost (USD) by Region
-
Planned Cost (USD) by Segment
Why the Overview Page Matters
This page helps leadership quickly assess project health. Moreover, it highlights risk areas, cost distribution, and project delays without digging into detailed reports.
2. Segment Analysis Dashboard – Performance by Business Segment
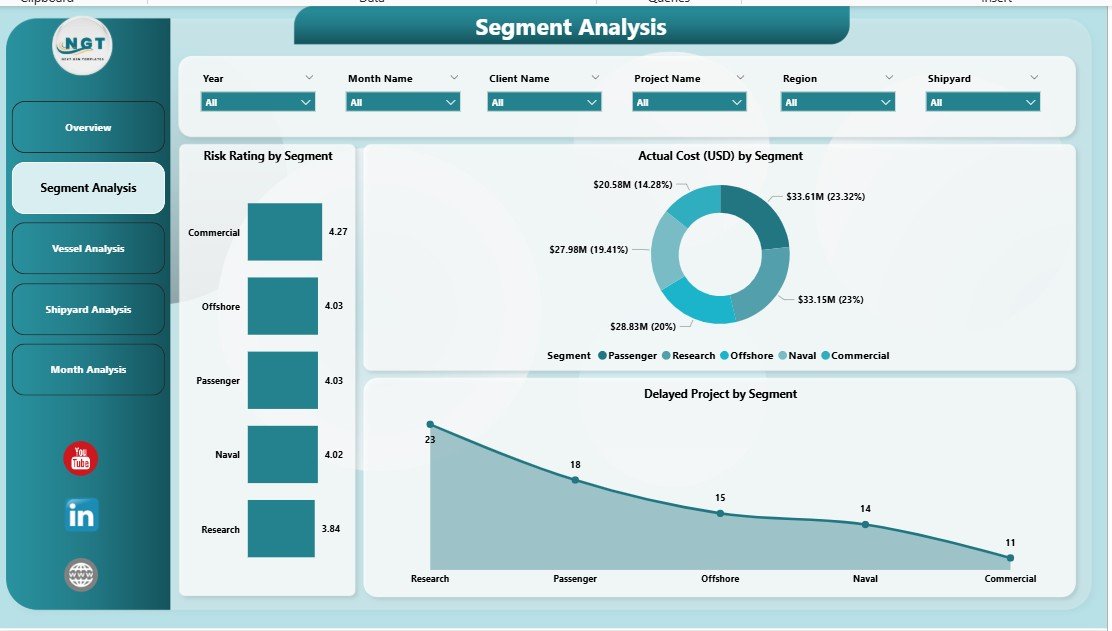
The Segment Analysis Page focuses on evaluating shipbuilding performance across different business segments.
Key Features of Segment Analysis Page
-
Dynamic slicers for flexible analysis
-
Clear visual breakdown of segment-wise performance
-
Easy comparison between segments
Charts Available on Segment Analysis Page
-
Risk Rating by Segment
-
Delayed Project by Segment
-
Actual Cost (USD) by Segment
Business Value of Segment Analysis
This page enables managers to identify underperforming segments quickly. Additionally, it supports cost optimization and risk mitigation strategies across different business units.
3. Vessel Analysis Dashboard – Insights by Vessel Type
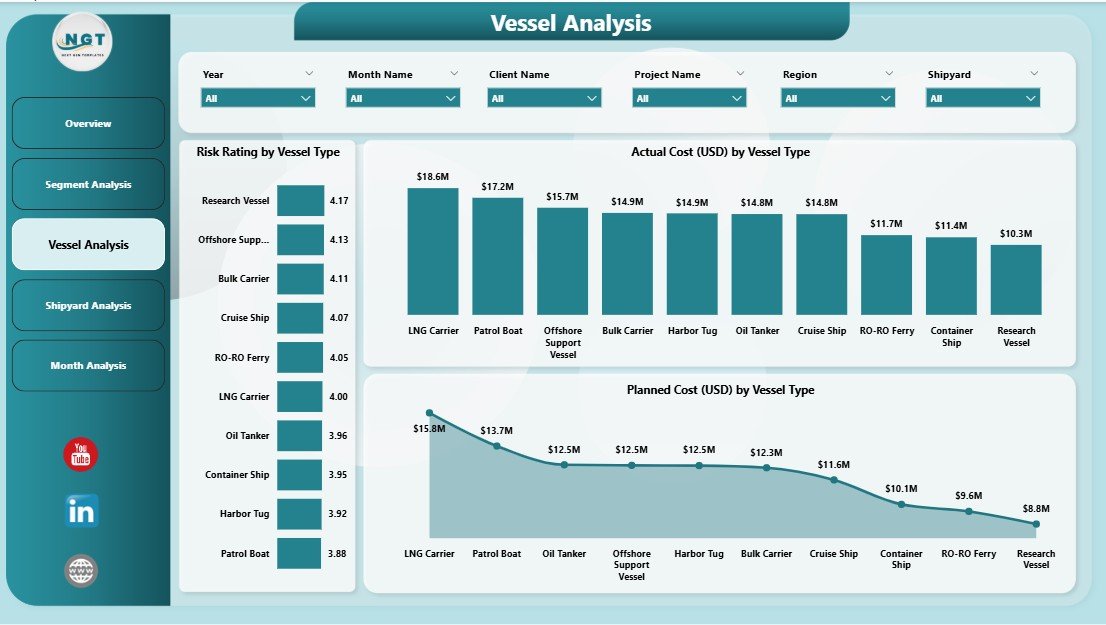
Different vessel types have different cost structures, risk levels, and timelines. Therefore, the Vessel Analysis Page focuses on vessel-wise performance.
Key Highlights of Vessel Analysis Page
-
Simple layout with powerful insights
-
Interactive slicers for filtering vessel data
-
Visual comparison across vessel types
Charts Available on Vessel Analysis Page
-
Risk Rating by Vessel Type
-
Planned Cost (USD) by Vessel Type
-
Actual Cost (USD) by Vessel Type
How Vessel Analysis Improves Decision-Making
Click to Purchases Shipbuilding Dashboard in Power BI
This page helps teams understand which vessel types drive higher risks or costs. Consequently, management can allocate resources more efficiently and improve project planning.
4. Shipyard Analysis Dashboard – Productivity and Cost Control
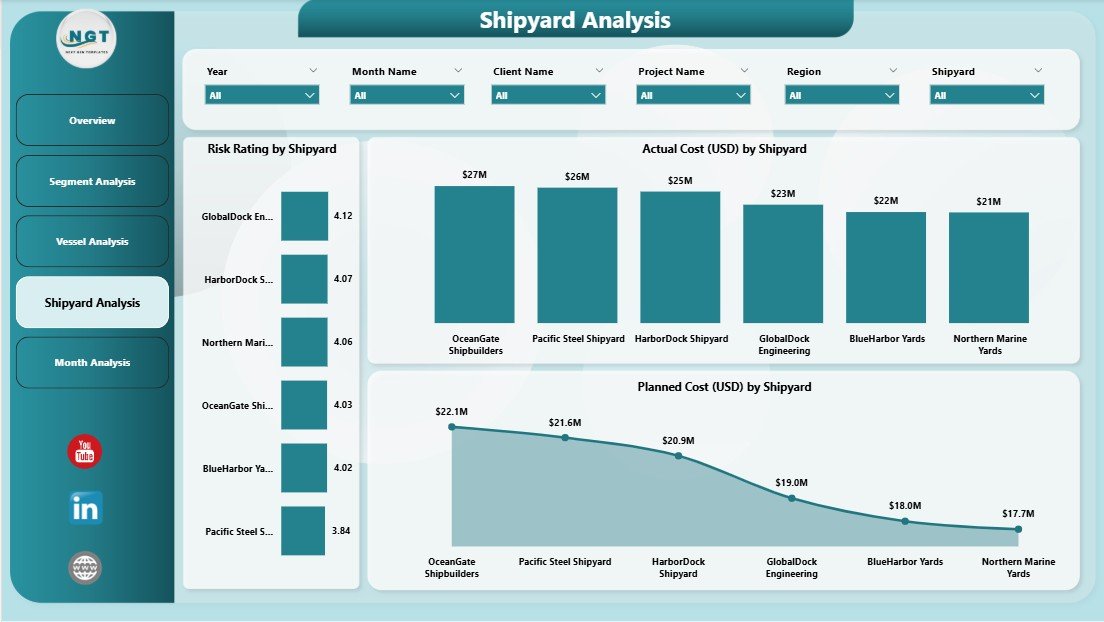
The Shipyard Analysis Page focuses on measuring shipyard-level efficiency, cost performance, and labor utilization.
Key Elements of Shipyard Analysis Page
-
Interactive slicers for shipyard selection
-
Focus on productivity and cost comparison
-
Clear visualization of labor hours
Charts Available on Shipyard Analysis Page
-
Man-Hours by Shipyard
-
Actual Cost (USD) by Shipyard
-
Planned Cost (USD) by Shipyard
Why Shipyard Analysis Is Critical
This page helps management identify high-cost shipyards, inefficiencies, and productivity gaps. As a result, leaders can implement corrective actions and improve overall shipyard performance.
5. Monthly Trends Dashboard – Time-Based Performance Tracking
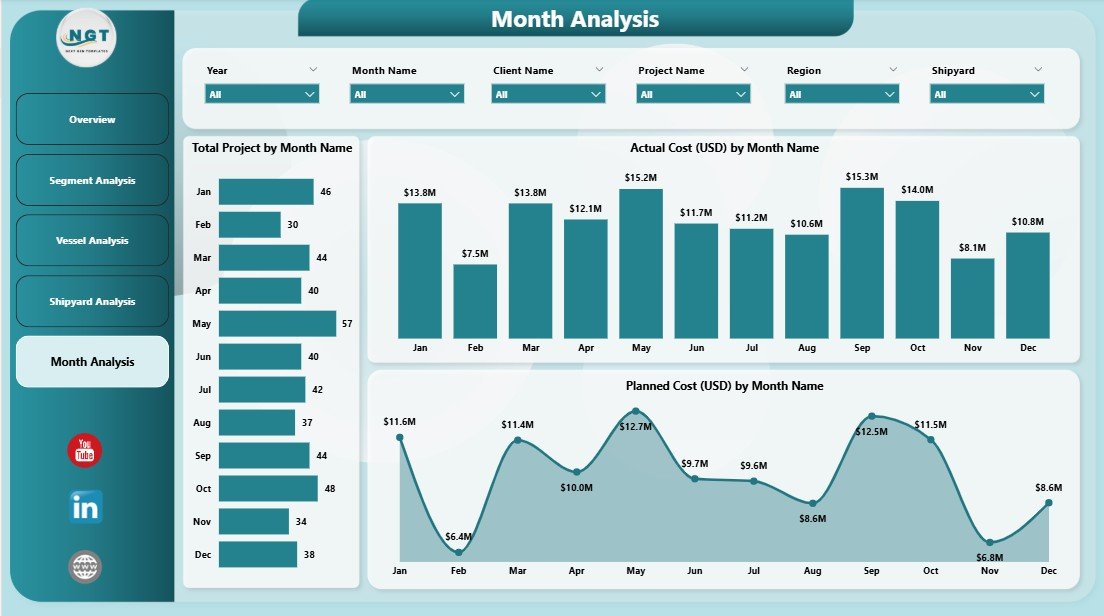
The Monthly Trends Page tracks performance over time and highlights cost and project trends.
Key Metrics in Monthly Trends Page
-
Project volume trends
-
Cost movement patterns
-
Monthly performance fluctuations
Charts Available on Monthly Trends Page
-
Total Projects by Month
-
Actual Cost (USD) by Month
-
Planned Cost (USD) by Month
Value of Monthly Trend Analysis
This page helps identify seasonal trends, budget deviations, and performance improvements over time. Moreover, it supports forecasting and future planning.
Advantages of Shipbuilding Dashboard in Power BI
Implementing a Shipbuilding Dashboard in Power BI delivers multiple operational and strategic advantages.
1. Centralized Performance Monitoring
The dashboard brings all shipbuilding KPIs into one centralized view. Therefore, teams no longer rely on scattered reports.
2. Improved Cost Control
Power BI highlights planned vs actual costs clearly. As a result, teams can identify overruns early and take corrective action.
3. Enhanced Risk Visibility
Risk ratings across shipyards, segments, and vessel types improve proactive risk management.
4. Faster Decision-Making
Visual insights reduce reporting time and accelerate decision-making.
5. Real-Time Data Insights
Power BI updates dashboards automatically when data refreshes. Therefore, leaders always view the latest information.
Opportunities for Improvement in Shipbuilding Dashboards
Although Power BI dashboards deliver strong value, companies can enhance them further.
-
Add predictive analytics for cost forecasting
-
Include delay root-cause analysis
-
Integrate supplier and procurement KPIs
-
Implement alerts for cost overruns and high risks
By continuously improving dashboards, shipbuilding companies maximize ROI.
Best Practices for the Shipbuilding Dashboard in Power BI
Following best practices ensures long-term success and usability.
1. Use Clean and Structured Data
Always maintain standardized data inputs to avoid inconsistencies.
2. Focus on Actionable KPIs
Select KPIs that support real decisions, not just reporting.
3. Keep Dashboard Layout Simple
Avoid overcrowding visuals. Instead, prioritize clarity and readability.
4. Use Consistent Metrics
Ensure all users interpret KPIs consistently across pages.
5. Refresh Data Regularly
Schedule automatic refresh to maintain real-time accuracy.
Who Can Benefit from a Shipbuilding Dashboard in Power BI?
A Shipbuilding Dashboard in Power BI benefits multiple stakeholders.
-
Shipyard Managers
-
Project Managers
-
Finance Teams
-
Operations Leaders
-
Risk & Compliance Teams
-
Executive Management
Because of its flexibility, each role can view relevant insights.
How Does Power BI Improve Shipbuilding Project Visibility?
Click to Purchases Shipbuilding Dashboard in Power BI
Power BI improves visibility by converting complex shipbuilding data into interactive visuals. As a result, teams understand performance instantly without manual calculations.
Moreover, slicers allow users to drill down by shipyard, vessel type, segment, or month.
How to Implement a Shipbuilding Dashboard in Power BI?
Implementing the dashboard involves structured steps.
-
Define shipbuilding KPIs
-
Prepare clean Excel or database inputs
-
Design dashboard pages logically
-
Create interactive visuals
-
Test and validate insights
-
Deploy and train users
Following this approach ensures smooth adoption.
Conclusion: Why Shipbuilding Dashboard in Power BI Is a Must-Have Tool
A Shipbuilding Dashboard in Power BI transforms how shipbuilding companies manage projects, costs, and risks. Instead of relying on static reports, teams gain dynamic, real-time insights that support faster and smarter decisions.
With structured pages like Overview, Segment Analysis, Vessel Analysis, Shipyard Analysis, and Monthly Trends, this dashboard delivers a complete performance picture. As a result, organizations improve efficiency, reduce costs, and enhance project delivery.
For shipbuilding companies aiming for operational excellence, a Power BI dashboard is no longer optional—it is essential.
Frequently Asked Questions (FAQs)
1. What data is required for a Shipbuilding Dashboard in Power BI?
You need project data, cost data, shipyard details, vessel types, risk ratings, and monthly performance data.
2. Can Power BI handle large shipbuilding datasets?
Yes, Power BI efficiently handles large datasets and complex calculations.
3. Is Power BI suitable for non-technical users?
Yes, Power BI dashboards use intuitive visuals and slicers, making them easy to use.
4. How often should the dashboard be updated?
You should refresh the dashboard daily or weekly, depending on data availability.
5. Can the dashboard track planned vs actual costs?
Yes, cost comparison remains one of the key strengths of this dashboard.
6. Does the dashboard support drill-down analysis?
Yes, users can drill down by shipyard, segment, vessel type, and month.
Visit our YouTube channel to learn step-by-step video tutorials