The solar industry grows faster every year. Governments promote renewable energy. Investors expect strong returns. Developers manage multiple sites at once. However, many solar companies still track construction progress using scattered Excel sheets.As a result, managers struggle to monitor budgets, delays, contractor performance, and project stages. Moreover, reporting takes too much time. Therefore, decision-makers often react late instead of acting early.So, how can solar companies track construction performance in one structured, interactive, and real-time system?You need a Solar Project Construction Dashboard in Power BI.In this detailed guide, you will learn:What a Solar Project Construction Dashboard in Power BI
- Why solar companies need it
- A complete explanation of all 5 dashboard pages
- Key KPIs included in the dashboard
- Advantages of using this dashboard
- Best practices for implementation
- Frequently Asked Questions with answers
Click to buy Solar Project Construction Dashboard in Power BI
What Is a Solar Project Construction Dashboard in Power BI?
A Solar Project Construction Dashboard in Power BI is an interactive performance monitoring solution designed specifically for solar project developers and EPC contractors.
It helps you:
- Track total projects across locations
- Monitor total budget vs total cost incurred
- Analyze delays and completion percentage
- Evaluate contractor performance
- Measure panels installed by location and stage
- Review man-hours and productivity
Instead of manually consolidating data, you can view everything on one screen. Furthermore, Power BI updates visuals instantly when you apply filters.
As a result, you gain full control over project performance.
Why Do Solar Companies Need a Construction Dashboard?
Solar project construction involves:
- Land preparation
- Procurement
- Panel installation
- Electrical work
- Testing and commissioning
Since each stage requires coordination, even small delays affect overall timelines. Moreover, cost overruns reduce profit margins.
Therefore, solar companies need:
- Real-time visibility
- Budget control
- Contractor performance tracking
- Stage-based monitoring
- Delay analysis
Without a dashboard, teams waste hours preparing reports. However, with Power BI, leaders make decisions in minutes.
What Are the 5 Pages of the Solar Project Construction Dashboard in Power BI?
This dashboard includes 5 powerful pages inside the Power BI Desktop file. Each page focuses on a different management perspective.
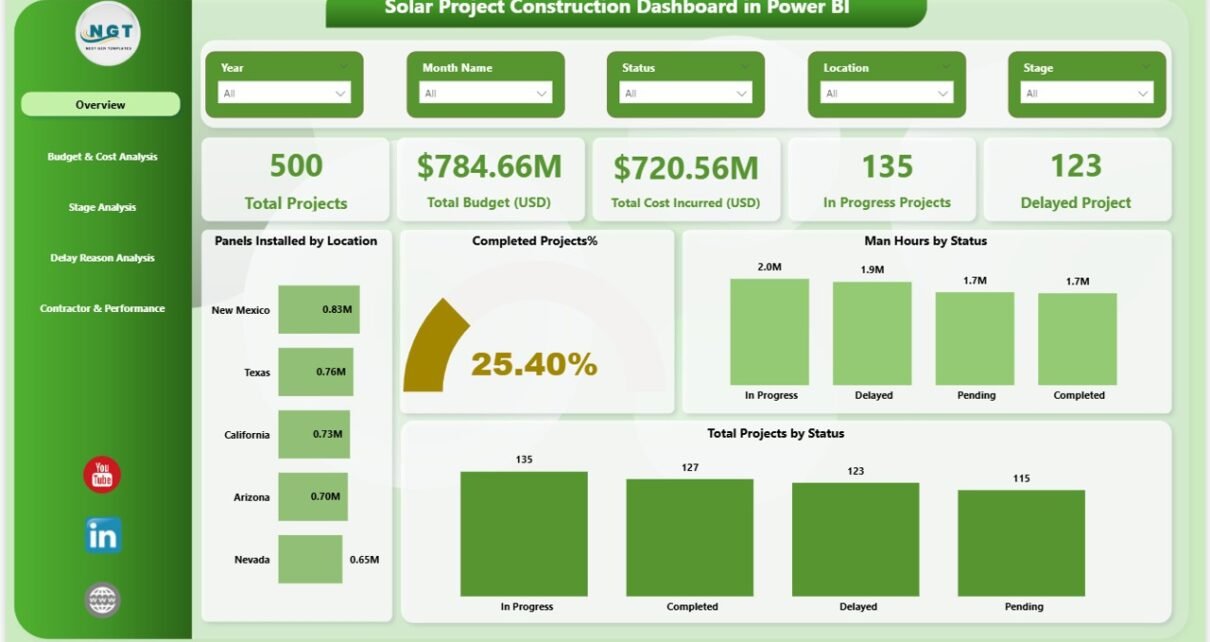
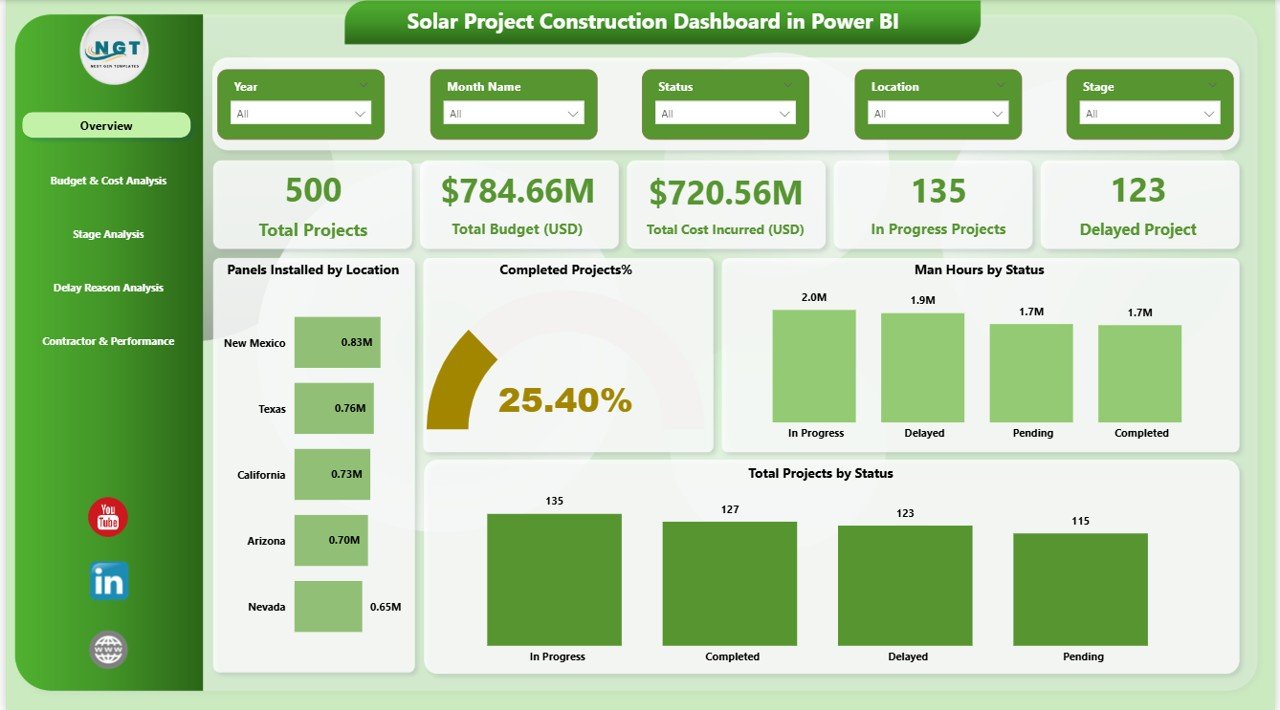
Overview Page – What Does It Show?
The Overview Page works as the command center of the dashboard.
Here, you see key performance indicators at a glance.
Key Cards on the Overview Page
- Total Projects
- Total Budget (USD)
- Total Cost Incurred (USD)
- In Progress Projects
- Delayed Projects
These cards give instant clarity. Therefore, managers quickly understand overall project health.
Key Visuals on the Overview Page
- Panels Installed by Location
- Completed Project %
- Man Hours by Status
- Total Projects by Status
Moreover, slicers allow you to filter by:
- Location
- Contractor
- Stage
- Month
As a result, you can drill down into specific areas instantly.
Click to buy Solar Project Construction Dashboard in Power BI
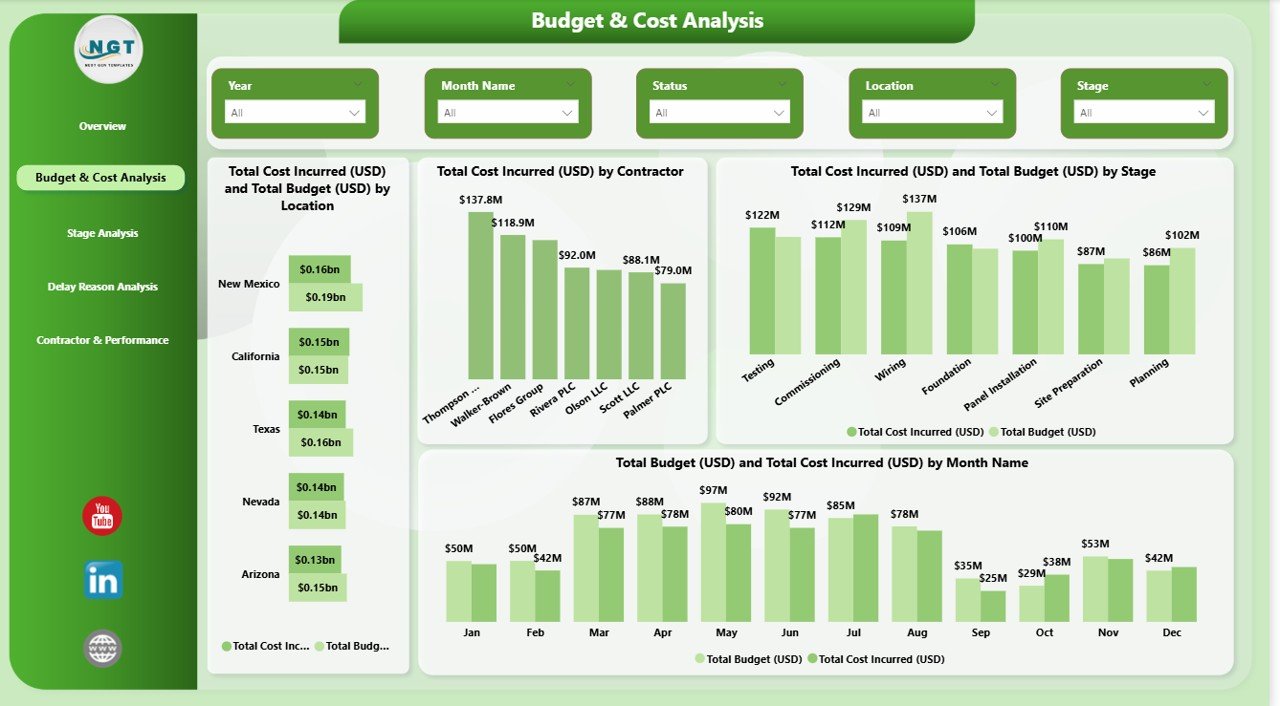
Budget & Cost Analysis – How Can You Control Financial Performance?
Budget control plays a critical role in solar project success.
The Budget & Cost Analysis Page helps you monitor financial performance closely.
What This Page Includes:
- Total Cost Incurred (USD) by Location
- Total Budget (USD) by Location
- Total Cost Incurred (USD) by Contractor
- Total Cost Incurred (USD) and Total Budget (USD) by Stage
- Monthly Cost vs Budget Analysis
Because this page compares budget vs actual costs, you quickly identify overspending.
Furthermore, you can:
- Detect cost-heavy locations
- Evaluate contractor cost efficiency
- Analyze monthly spending trends
Therefore, you prevent financial leakage early.
Click to buy Solar Project Construction Dashboard in Power BI
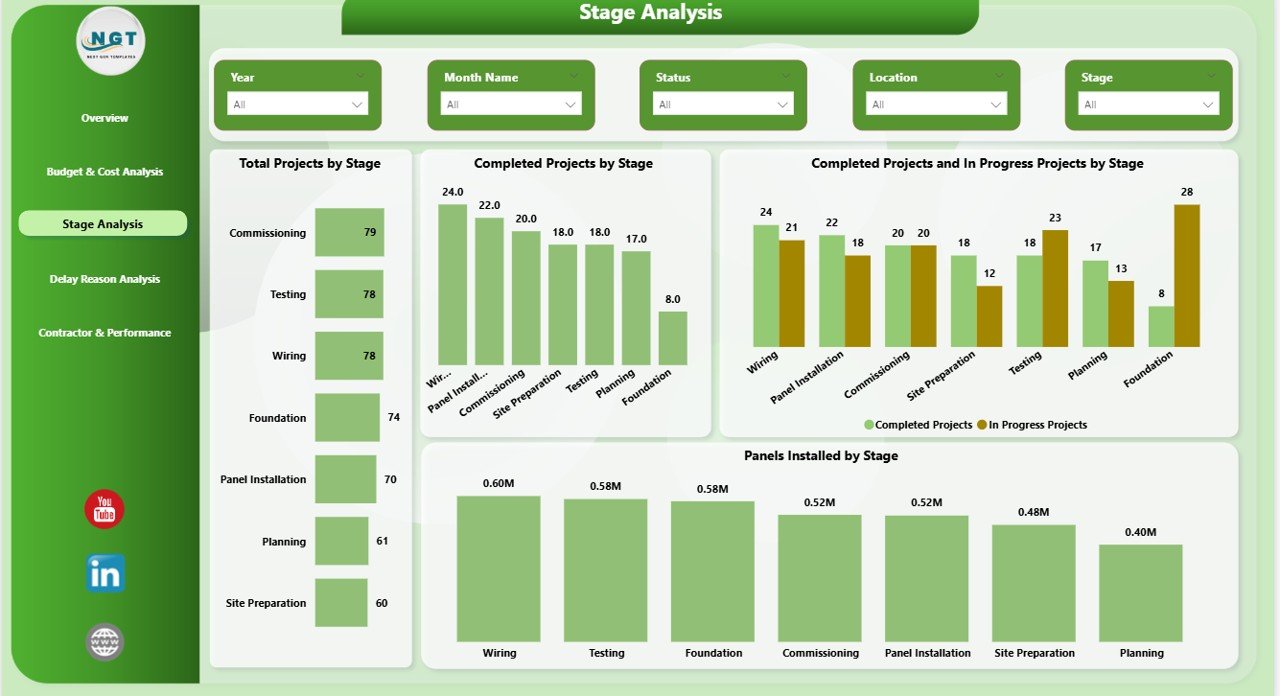
Stage Analysis – How Do Projects Progress Across Stages?
Solar construction includes multiple stages. Therefore, tracking stage progress ensures timely completion.
The Stage Analysis Page provides deep operational visibility.
Key Charts on This Page:
- Total Projects by Stage
- Completed Projects by Stage
- Completed vs In Progress Projects by Stage
- Panels Installed by Stage
With this view, you can:
- Identify bottleneck stages
- Track completion ratio
- Monitor panel installation progress
- Balance resources effectively
As a result, you improve workflow efficiency.
Click to buy Solar Project Construction Dashboard in Power BI
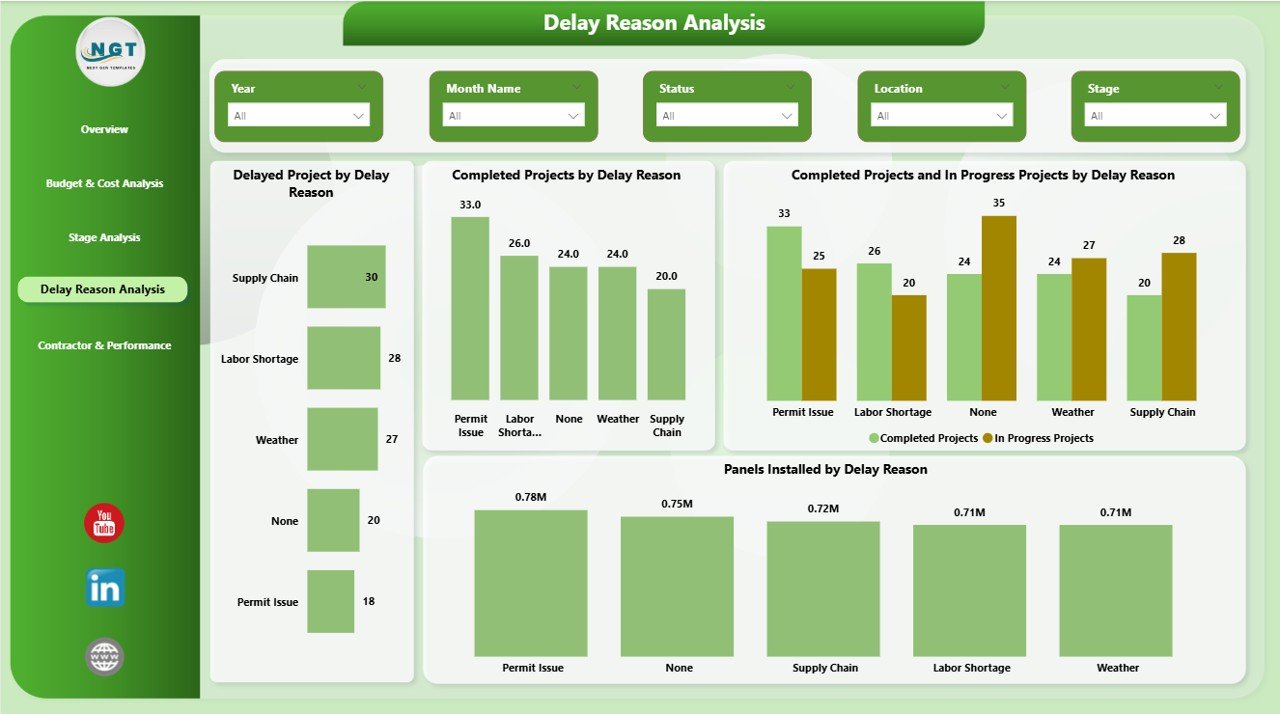
Delay Reason Analysis – Why Do Solar Projects Get Delayed?
Delays reduce profitability. Therefore, understanding delay reasons helps you prevent future issues.
The Delay Reason Analysis Page focuses entirely on delay patterns.
Key Visuals Include:
- Delayed Projects by Delay Reason
- Completed Projects by Delay Reason
- Completed vs In Progress Projects by Delay Reason
- Panels Installed by Delay Reason
Common delay reasons may include:
- Weather conditions
- Material shortages
- Contractor inefficiency
- Permit approvals
- Technical issues
Since you can visualize delay patterns, you can take corrective action quickly.
Click to buy Solar Project Construction Dashboard in Power BI
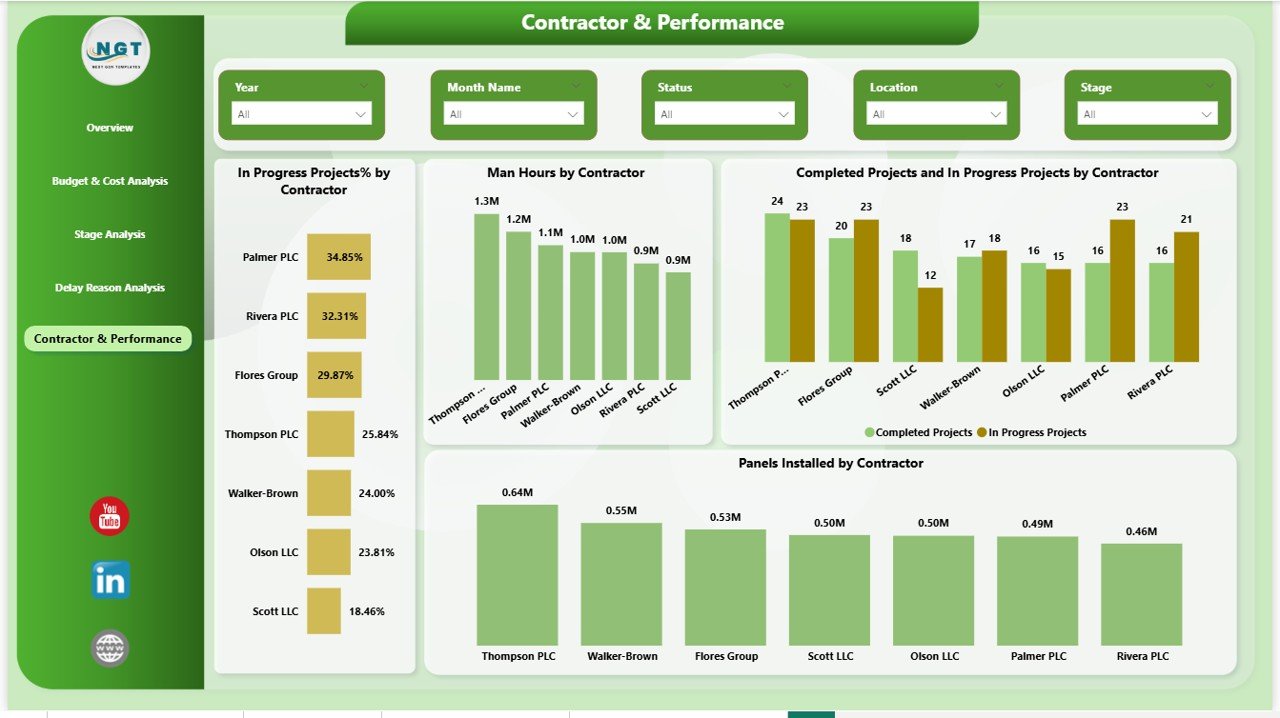
Contractor & Performance – Which Contractor Performs Better?
Contractor performance directly impacts cost, time, and quality.
The Contractor & Performance Page provides contractor-level insights.
Key Charts Include:
- In Progress Projects % by Contractor
- Man Hours by Contractor
- Completed vs In Progress Projects by Contractor
- Panels Installed by Contractor
Because this page compares performance across contractors, you can:
- Reward high performers
- Identify slow-performing contractors
- Optimize manpower allocation
- Improve accountability
Therefore, project execution becomes more efficient.
Click to buy Solar Project Construction Dashboard in Power BI
Key KPIs Tracked in the Solar Project Construction Dashboard
This dashboard tracks important KPIs such as:
- Total Projects
- Completed Project %
- In Progress Projects
- Delayed Projects
- Total Budget (USD)
- Total Cost Incurred (USD)
- Budget Variance
- Panels Installed
- Man Hours
- Projects by Stage
- Projects by Location
- Projects by Contractor
Each KPI updates dynamically when you apply slicers.
Advantages of Solar Project Construction Dashboard in Power BI
Now let us explore the major advantages.
- Real-Time Visibility
You monitor project health instantly. Moreover, you eliminate manual reporting.
- Better Budget Control
You compare budget vs actual cost. Therefore, you prevent cost overruns early.
- Improved Decision-Making
You use data instead of assumptions. As a result, you make confident decisions.
- Contractor Performance Evaluation
You track productivity and project progress. Therefore, you select better contractors for future projects.
- Delay Reduction
You identify root causes of delays. Consequently, you improve planning accuracy.
- Enhanced Project Transparency
You share reports with stakeholders easily. Furthermore, Power BI makes reports visually clear.
How Does Power BI Improve Solar Project Monitoring?
Power BI provides:
- Interactive dashboards
- Drill-down capability
- Dynamic slicers
- Real-time updates
- Clean visual layouts
Moreover, it connects with Excel data sources easily.
Therefore, you transform raw data into strategic insights.
Best Practices for the Solar Project Construction Dashboard in Power BI
To maximize results, follow these best practices.
- Keep Data Structured
Use clean Excel data tables. Moreover, maintain consistent naming formats.
- Update Data Regularly
Enter project updates weekly or monthly. Therefore, your dashboard remains accurate.
- Define KPIs Clearly
Set measurable targets for:
- Budget
- Timeline
- Panels installed
- Man hours
Clear KPIs improve accountability.
- Monitor Delay Trends Monthly
Analyze delay reasons every month. Consequently, you reduce repeated issues.
- Train Team Members
Ensure managers understand how to use slicers and filters. As a result, they explore deeper insights.
- Review Contractor Performance Periodically
Use data to compare contractors fairly. Therefore, you reward performance based on facts.
Who Can Benefit from This Dashboard?
This dashboard helps:
- Solar project developers
- EPC contractors
- Renewable energy companies
- Project managers
- Financial controllers
- Operations managers
If your organization handles multiple solar projects, this dashboard adds tremendous value.
How to Implement the Solar Project Construction Dashboard?
Follow these simple steps:
- Prepare structured Excel data
- Upload data into Power BI
- Map columns correctly
- Review all 5 pages
- Apply slicers for deeper analysis
- Share dashboard with stakeholders
Within minutes, you gain full project visibility.
Conclusion
Solar project construction demands precision, coordination, and financial control. However, manual tracking methods slow down decision-making and increase errors.
A Solar Project Construction Dashboard in Power BI solves these challenges effectively. It provides real-time insights, budget control, delay analysis, stage monitoring, and contractor performance tracking — all in one interactive platform.
Therefore, if you want better project execution, improved financial visibility, and stronger contractor accountability, you should implement this dashboard today.
Data-driven solar construction leads to faster completion and higher profitability.
Frequently Asked Questions with Answers
- What is a Solar Project Construction Dashboard in Power BI?
It is an interactive dashboard that tracks solar project budgets, delays, stages, contractors, and performance using real-time visuals.
- How many pages does this dashboard include?
It includes five pages:
- Overview
- Budget & Cost Analysis
- Stage Analysis
- Delay Reason Analysis
- Contractor & Performance
- Can I filter data by location or contractor?
Yes. You can use slicers to filter by location, contractor, stage, or month instantly.
- Does this dashboard help reduce project delays?
Yes. It identifies delay reasons clearly. Therefore, managers take corrective actions quickly.
- Is Power BI better than Excel for dashboards?
Power BI provides interactive visuals, drill-down features, and better performance for large datasets. Therefore, it offers stronger analytical capability.
- Can solar EPC contractors use this dashboard?
Yes. EPC contractors can track project progress, monitor budgets, and evaluate contractor performance effectively.
- How often should I update the dashboard?
You should update it weekly or monthly depending on project complexity.
Visit our YouTube channel to learn step-by-step video tutorials
Click to buy Solar Project Construction Dashboard in Power BI