The textile industry continues to evolve rapidly. Customers demand consistent quality, faster delivery, sustainable processing, and competitive pricing. At the same time, textile dyeing and finishing units handle complex operations involving chemicals, machines, labor, water consumption, and strict quality standards.
However, many factories still rely on manual Excel reports or disconnected systems to monitor performance. As a result, managers spend hours compiling reports instead of improving operations. Moreover, delayed insights often lead to production losses and higher operational costs.
Therefore, textile manufacturers now adopt modern analytics solutions. One of the most effective tools is the Textile Dyeing and Finishing KPI Dashboard in Power BI.
This ready-to-use dashboard transforms operational data into interactive visual insights. It helps production managers, quality teams, and business leaders monitor KPIs, analyze trends, and make faster decisions.
In this comprehensive guide, you will learn:
-
What the dashboard is and how it works
-
Key features and dashboard pages
-
Data structure and Excel integration
-
Important KPIs for textile dyeing operations
-
Advantages and best practices
-
Implementation strategy
-
Frequently asked questions
What Is a Textile Dyeing and Finishing KPI Dashboard in Power BI?
A Textile Dyeing and Finishing KPI Dashboard in Power BI is an interactive business intelligence solution designed to track operational performance using Key Performance Indicators (KPIs).
Instead of analyzing static reports, users can:
-
Monitor KPI achievement instantly
-
Compare actual vs target performance
-
Analyze trends across months and years
-
Evaluate operational efficiency visually
The dashboard connects to an Excel data source, where users simply enter KPI values. Power BI then automatically updates visuals and calculations.
Because Power BI supports dynamic filtering, drill-through analysis, and advanced visualization, decision-makers gain deeper insights compared to traditional spreadsheets.
Click to Purchases Textile Dyeing and Finishing KPI Dashboard in Power BI
Why Is KPI Monitoring Critical in Textile Dyeing and Finishing?
Textile dyeing and finishing processes directly influence product quality, production cost, and environmental impact. Even minor deviations can create large financial losses.
Without KPI tracking:
-
Quality defects increase unnoticed
-
Chemical usage becomes inefficient
-
Production delays occur frequently
-
Performance evaluation becomes subjective
On the other hand, KPI dashboards provide measurable performance visibility.
Therefore, organizations improve productivity while reducing waste.
Key Features of Textile Dyeing and Finishing KPI Dashboard in Power BI
This dashboard includes three interactive pages inside the Power BI Desktop file, each designed for a specific analytical purpose.
Click to Purchases Textile Dyeing and Finishing KPI Dashboard in Power BI
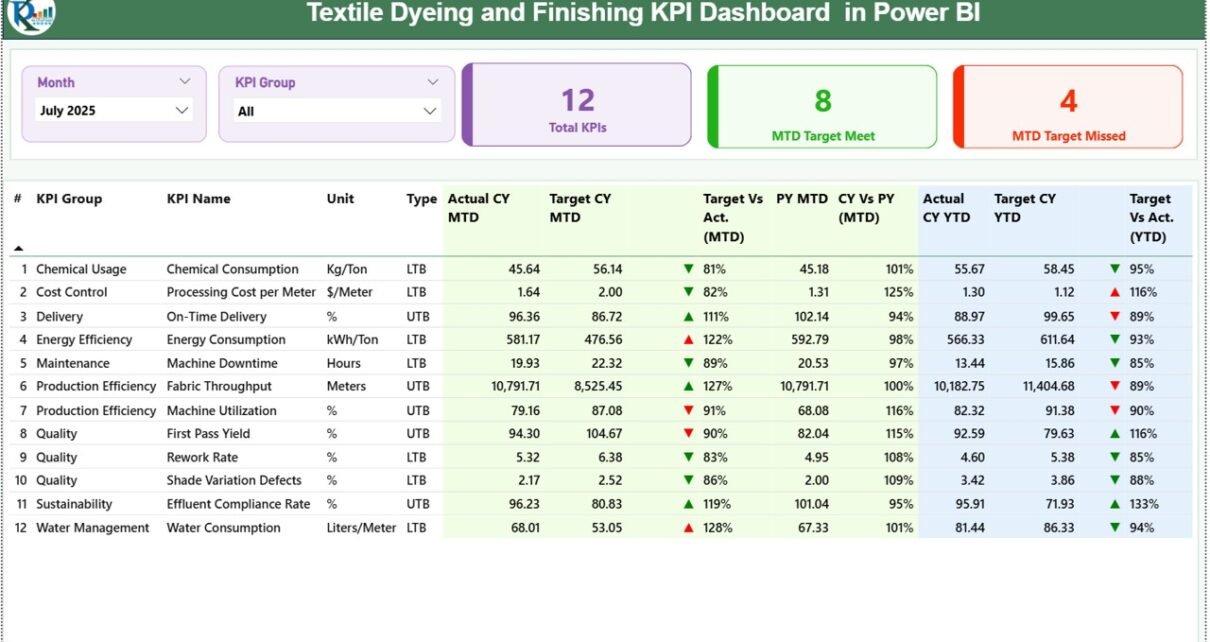
1️⃣ Summary Page – Central Performance Overview
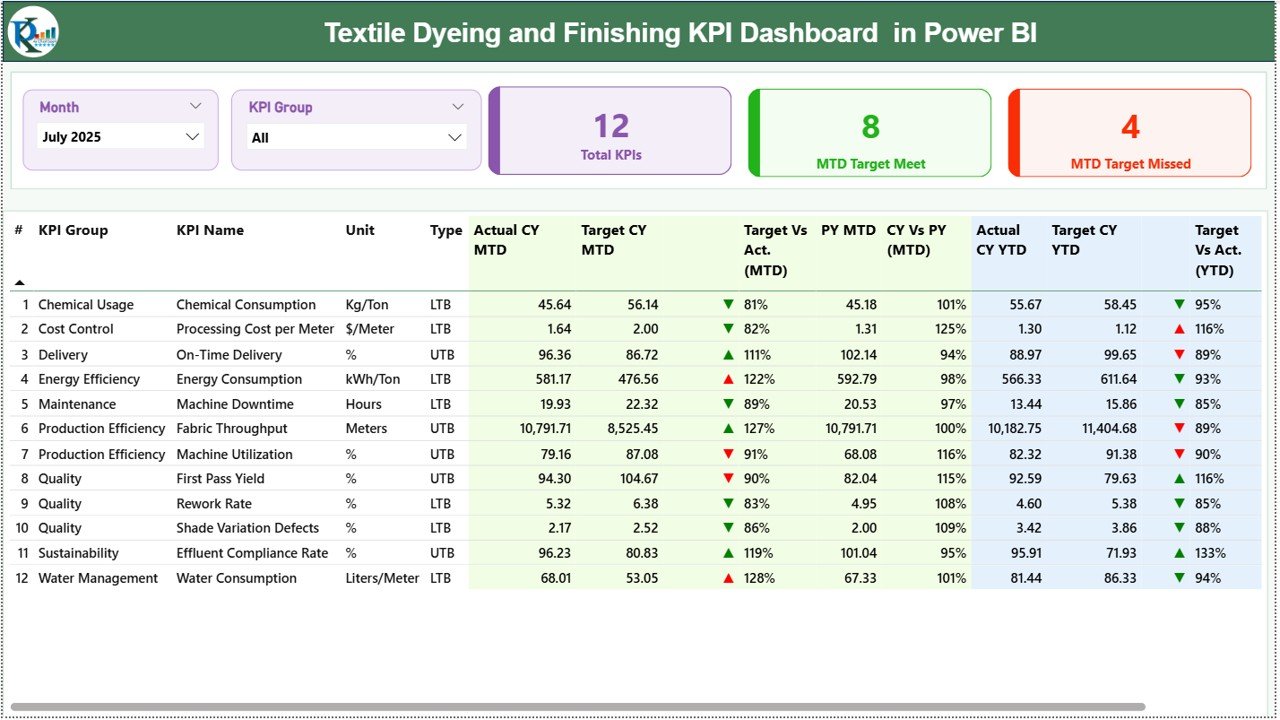
The Summary Page acts as the main control center of the dashboard.
Interactive Slicers
At the top, users find:
-
Month slicer
-
KPI Group slicer
These filters allow users to analyze performance dynamically.
KPI Performance Cards
Three KPI summary cards display:
-
Total KPI Count
-
MTD Target Meet Count
-
MTD Target Missed Count
As a result, management immediately understands overall performance health.
Detailed KPI Performance Table
Below the cards, a comprehensive KPI table provides detailed insights.
KPI Information Columns
-
KPI Number – Sequential KPI identifier
-
KPI Group – Category of KPI
-
KPI Name – Performance indicator name
-
Unit – Measurement unit
-
Type – UTB (Upper the Better) or LTB (Lower the Better)
MTD Performance Metrics
The dashboard displays:
-
Actual CY MTD
-
Target CY MTD
-
MTD Status Icons (▲ Green / ▼ Red)
-
Target vs Actual %
-
Previous Year MTD
-
Current Year vs Previous Year %
These comparisons help managers evaluate short-term performance quickly.
YTD Performance Metrics
Similarly, the dashboard shows:
-
Actual CY YTD
-
Target CY YTD
-
YTD Status Icons
-
Target vs Actual %
-
Previous Year YTD
-
Current Year vs Previous Year %
Therefore, users analyze long-term performance trends alongside monthly results.
2️⃣ KPI Trend Page – Performance Trend Analysis
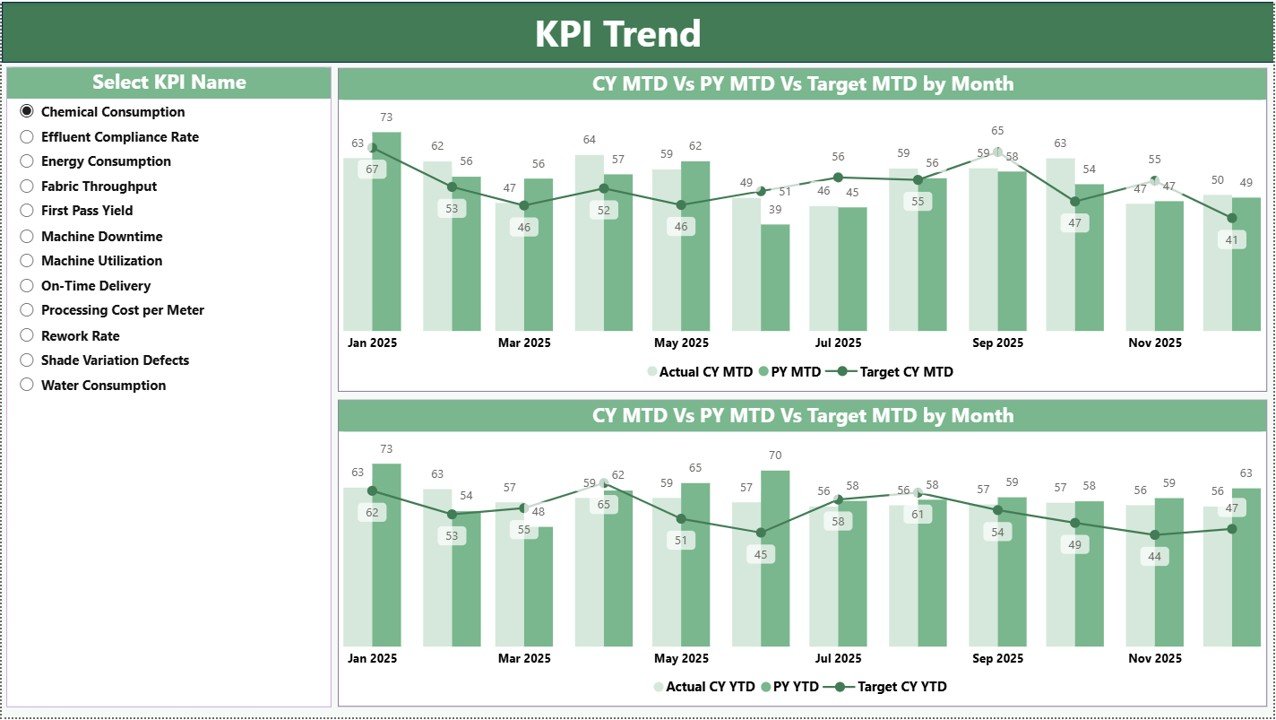
The KPI Trend Page helps users understand performance behavior over time.
Features Included:
-
KPI selection slicer
-
Two combo charts:
-
MTD Trend Analysis
-
YTD Trend Analysis
-
Each chart compares:
-
Current Year Actual
-
Previous Year Actual
-
Target Values
Because trend visualization highlights patterns, managers can identify improvements or recurring issues.
Click to Purchases Textile Dyeing and Finishing KPI Dashboard in Power BI
3️⃣ KPI Definition Page – Drill-Through KPI Details
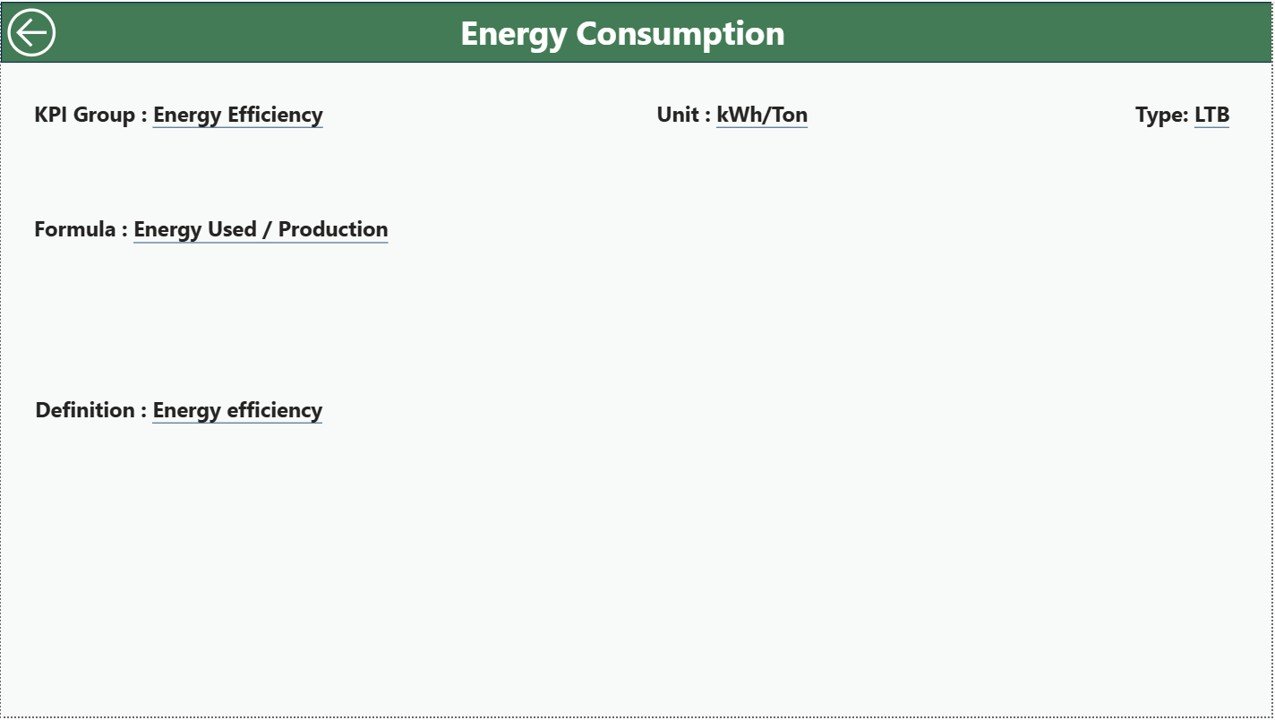
The KPI Definition page remains hidden and works as a drill-through page.
Users can access it directly from the Summary Page.
This page displays:
-
KPI Formula
-
KPI Definition
-
KPI Group
-
KPI Measurement Unit
-
KPI Type
A back button allows easy navigation to the main page.
Therefore, users understand KPI meaning without leaving the dashboard environment.
Excel Data Source Structure
The dashboard uses an Excel file as its data source. Users only need to update data in three worksheets.
1️⃣ Input_Actual Sheet
Users enter:
-
KPI Name
-
Month (first date of month)
-
MTD Values
-
YTD Values
Once updated, Power BI refreshes automatically.
2️⃣ Input_Target Sheet
This sheet captures:
-
KPI Name
-
Month
-
Target MTD values
-
Target YTD values
Targets help measure performance success.
3️⃣ KPI Definition Sheet
This sheet contains master KPI details:
-
KPI Number
-
KPI Group
-
KPI Name
-
Unit
-
Formula
-
Definition
-
KPI Type (LTB or UTB)
Maintaining this structure ensures consistent KPI interpretation.
Click to Purchases Textile Dyeing and Finishing KPI Dashboard in Power BI
Which KPIs Should Textile Dyeing and Finishing Units Track?
Production KPIs
-
Production Output per Day
-
Machine Utilization %
-
Batch Processing Time
-
Productivity Rate
Quality KPIs
-
Shade Matching Accuracy
-
Rework Percentage
-
Defect Rate
-
First Pass Yield
Resource Efficiency KPIs
-
Water Consumption per Kg
-
Chemical Consumption Ratio
-
Energy Usage Efficiency
-
Steam Consumption
Cost KPIs
-
Dyeing Cost per Unit
-
Chemical Cost Variance
-
Labor Productivity
Delivery KPIs
-
On-Time Order Completion
-
Lead Time Performance
Tracking these KPIs provides a complete operational picture.
How Does Power BI Improve Textile KPI Analysis?
Power BI enhances performance monitoring in several ways:
-
Interactive dashboards replace static reports
-
Instant filtering enables deeper analysis
-
Drill-through pages provide KPI explanations
-
Visual indicators simplify interpretation
-
Automated calculations reduce manual effort
Consequently, organizations make faster and smarter decisions.
Click to Purchases Textile Dyeing and Finishing KPI Dashboard in Power BI
Advantages of Textile Dyeing and Finishing KPI Dashboard in Power BI
✅ Real-Time Performance Visibility
Users instantly analyze KPI performance after data refresh.
✅ Interactive Analysis
Slicers allow flexible filtering by month or KPI group.
✅ Visual Decision Support
Icons and charts simplify complex data.
✅ Historical Comparison
Previous year comparisons reveal improvement trends.
✅ Centralized KPI Management
All KPIs remain accessible in one dashboard.
✅ Scalable Analytics
Businesses can expand dashboards easily.
✅ Improved Operational Control
Managers detect inefficiencies early.
How to Implement the Textile KPI Dashboard Successfully?
Step 1: Identify Operational Goals
Define whether the focus lies on quality, cost, or productivity.
Step 2: Standardize KPI Definitions
Ensure all departments use consistent metrics.
Step 3: Prepare Excel Data
Structure input sheets correctly.
Step 4: Train Users
Teach teams how to update data regularly.
Step 5: Schedule Data Refresh
Refresh Power BI periodically.
Step 6: Conduct KPI Review Meetings
Use dashboard insights to drive improvements.
Click to Purchases Textile Dyeing and Finishing KPI Dashboard in Power BI
Best Practices for the Textile Dyeing and Finishing KPI Dashboard
To achieve maximum value:
-
Maintain accurate data entry
-
Review KPIs monthly
-
Avoid excessive KPIs
-
Use meaningful targets
-
Monitor trends instead of isolated values
-
Align KPIs with production goals
-
Encourage team accountability
Following these practices ensures sustainable performance improvement.
Common Challenges and Solutions
Challenge: Data Inconsistency
Solution: Use standardized KPI definition sheets.
Challenge: Slow Reporting
Solution: Automate updates using Power BI refresh.
Challenge: Poor KPI Understanding
Solution: Use drill-through KPI definitions.
Challenge: Lack of Trend Analysis
Solution: Utilize KPI Trend page regularly.
Who Should Use This Dashboard?
This dashboard supports:
-
Textile Plant Managers
-
Production Supervisors
-
Quality Assurance Teams
-
Operations Analysts
-
Factory Owners
-
Continuous Improvement Teams
Because the dashboard remains intuitive, both technical and non-technical users benefit.
Click to Purchases Textile Dyeing and Finishing KPI Dashboard in Power BI
Future Enhancements You Can Add
You can further enhance analytics by adding:
-
Machine-level performance tracking
-
Shift-wise analysis
-
Sustainability KPIs
-
Automated alerts
-
Predictive analytics models
-
Power BI Service cloud sharing
These improvements support Industry 4.0 transformation.
Conclusion
The Textile Dyeing and Finishing KPI Dashboard in Power BI provides a powerful solution for monitoring textile manufacturing performance. Instead of relying on manual reports, organizations gain interactive analytics that improve visibility, efficiency, and decision-making.
Moreover, the dashboard combines Excel simplicity with Power BI visualization power. As a result, businesses can track KPIs accurately, compare performance effectively, and continuously optimize operations.
Ultimately, companies that adopt KPI-driven management achieve better productivity, improved quality, and stronger profitability.
Click to Purchases Textile Dyeing and Finishing KPI Dashboard in Power BI
Frequently Asked Questions (FAQs)
What is a Textile Dyeing KPI Dashboard in Power BI?
It is an interactive analytics dashboard that tracks textile manufacturing KPIs using Power BI visuals and Excel data.
Do I need advanced Power BI knowledge to use it?
No. Users only update Excel input sheets and refresh the dashboard.
Can I customize KPIs?
Yes. You can modify KPIs through the KPI Definition sheet.
How often should data be updated?
Most factories update data monthly or weekly.
Does the dashboard support historical comparison?
Yes. It compares current year performance with previous year data.
Why use Power BI instead of Excel dashboards?
Power BI provides interactive filtering, drill-through analysis, and advanced visualization.
Is this dashboard suitable for small textile factories?
Yes. Both small and large textile units can use it effectively.
Click to Purchases Textile Dyeing and Finishing KPI Dashboard in Power BI
Visit our YouTube channel to learn step-by-step video tutorials