Tunnel engineering projects involve complex planning, strict safety standards, and continuous monitoring of construction activities. Engineers, project managers, and infrastructure authorities must track multiple performance indicators to ensure projects progress smoothly, remain safe, and stay within budget.
However, managing tunnel construction performance using scattered reports and manual spreadsheets often creates confusion and delays. Teams struggle to analyze performance trends, compare targets with actual results, and identify operational issues quickly.
Therefore, organizations need a centralized system that tracks tunnel engineering KPIs in a structured and visual way.
A Tunnel Engineering KPI Dashboard in Excel provides a powerful solution. It helps engineering teams monitor performance metrics, evaluate progress, compare targets, and make data-driven decisions. Instead of reviewing multiple reports, managers can analyze all important indicators in one interactive dashboard.
In this comprehensive guide, you will learn everything about the Tunnel Engineering KPI Dashboard in Excel, including its features, advantages, best practices, and practical applications.
Click to buy Tunnel Engineering KPI Dashboard in Excel
What is a Tunnel Engineering KPI Dashboard in Excel?
A Tunnel Engineering KPI Dashboard in Excel is a structured performance monitoring tool designed to track key indicators related to tunnel construction and engineering projects.
Tunnel engineering involves multiple operational processes such as:
- Excavation progress monitoring
- Safety compliance tracking
- Equipment utilization monitoring
- Project timeline management
- Budget control and cost monitoring
- Geological risk monitoring
- Workforce productivity tracking
Since tunnel projects generate large amounts of operational data, engineers need a system that converts raw data into meaningful insights.
This dashboard collects KPI data and presents it in visual formats such as:
- Performance indicators
- Trend charts
- Target vs actual comparisons
- Monthly and yearly analysis
As a result, tunnel project managers can quickly identify performance gaps and take corrective actions.
Why Do Tunnel Engineering Projects Need KPI Dashboards?
Tunnel engineering projects require high levels of coordination and precision. Engineers must continuously monitor several project parameters to avoid delays, cost overruns, or safety issues.
Without a structured dashboard, teams often face several problems:
- Difficulty tracking project progress
- Lack of visibility into performance metrics
- Delays in identifying operational issues
- Poor coordination between departments
- Inconsistent reporting formats
However, a KPI dashboard solves these problems by creating a centralized monitoring system.
With a Tunnel Engineering KPI Dashboard, organizations can:
- Track critical engineering KPIs in real time
- Compare actual performance with planned targets
- Identify project delays early
- Improve decision-making processes
- Increase transparency across teams
Therefore, this dashboard becomes a powerful management tool for tunnel infrastructure projects.
Key Features of the Tunnel Engineering KPI Dashboard in Excel
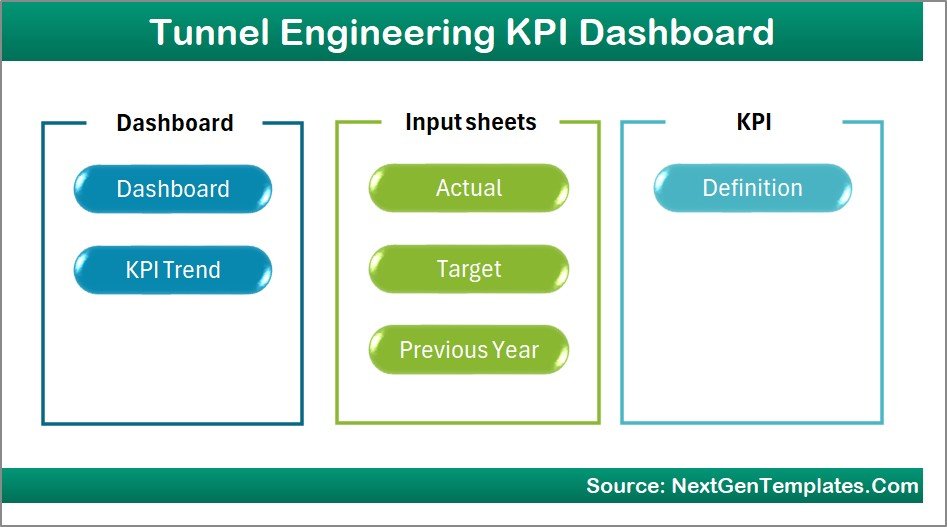
This Tunnel Engineering KPI Dashboard includes 7 structured worksheets that help users manage KPI data efficiently.
Summary Page
The Summary Page works as the navigation center of the dashboard.
This sheet contains six interactive buttons that allow users to quickly jump to other worksheets.
Because of this structure, users can easily navigate the dashboard without scrolling through multiple sheets.
The Summary Page improves usability and ensures a better dashboard experience.
Click to buy Tunnel Engineering KPI Dashboard in Excel
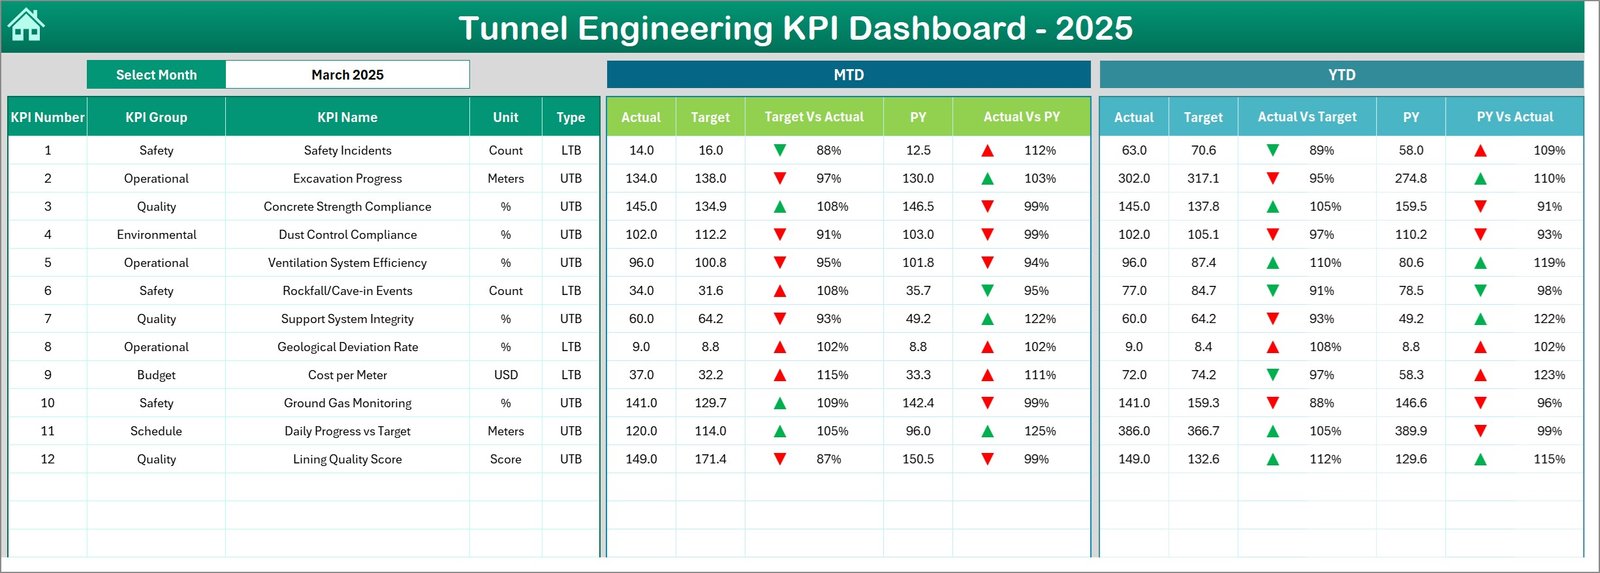
Dashboard Sheet Tab
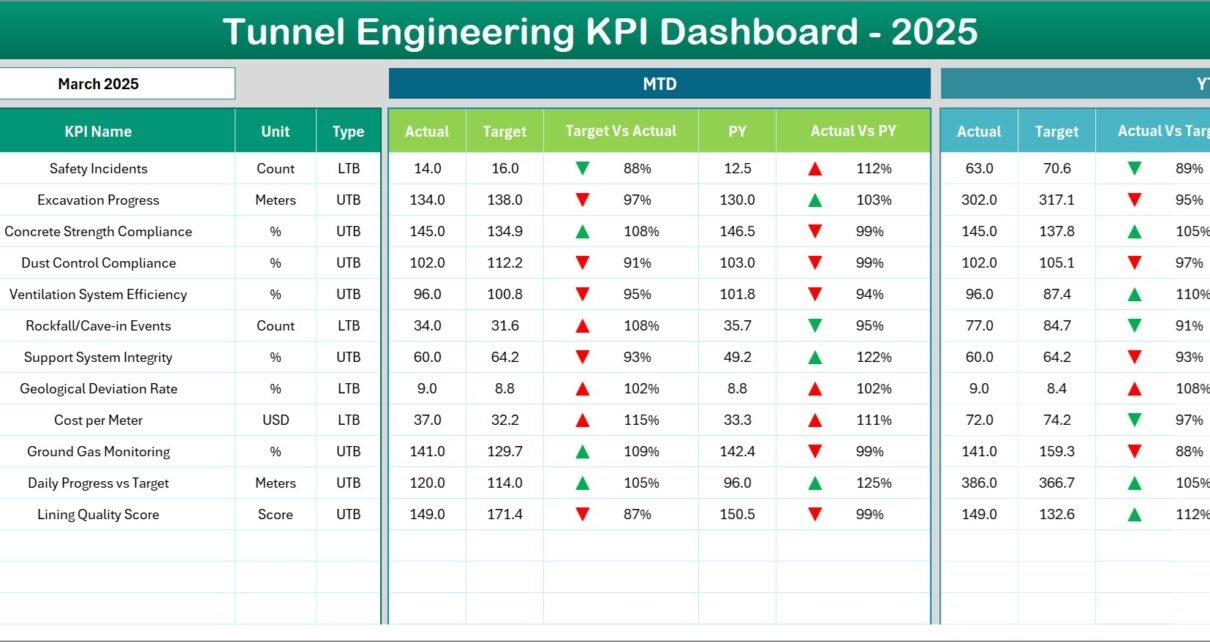
The Dashboard Sheet serves as the main analytical page of the entire template.
On this page, users can monitor the performance of all KPIs in one place.
Key Features of the Dashboard Page
- Month selection dropdown available in cell D3
- Dashboard automatically updates when the month changes
- Displays MTD (Month-To-Date) performance
- Displays YTD (Year-To-Date) performance
- Shows Target vs Actual comparison
- Shows Previous Year vs Actual comparison
In addition, the dashboard uses conditional formatting arrows to indicate performance trends.
For example:
- Up arrow → KPI performing better than target
- Down arrow → KPI below target
Therefore, managers can instantly identify high-performing and underperforming KPIs.
Click to buy Tunnel Engineering KPI Dashboard in Excel
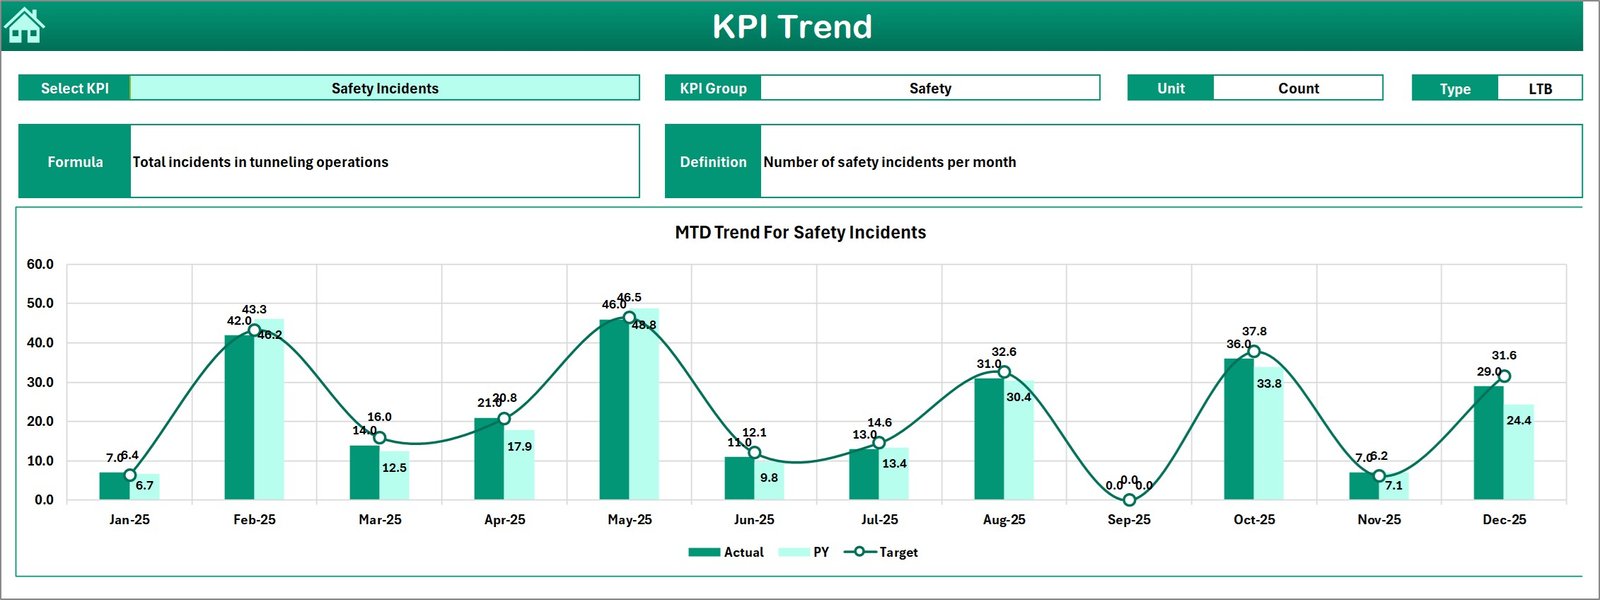
Trend Sheet Tab
The Trend Sheet helps users analyze the performance trend of any KPI over time.
Users can select a KPI from the dropdown menu located in cell C3.
Once the KPI is selected, the sheet displays important information such as:
- KPI Group
- Unit of Measurement
- KPI Type (Lower the Better or Upper the Better)
- KPI Formula
- KPI Definition
In addition, this sheet shows two important trend charts:
- MTD Trend Chart
- YTD Trend Chart
These charts compare:
- Actual performance
- Target values
- Previous year performance
As a result, project managers can easily analyze KPI performance trends across months.
Click to buy Tunnel Engineering KPI Dashboard in Excel
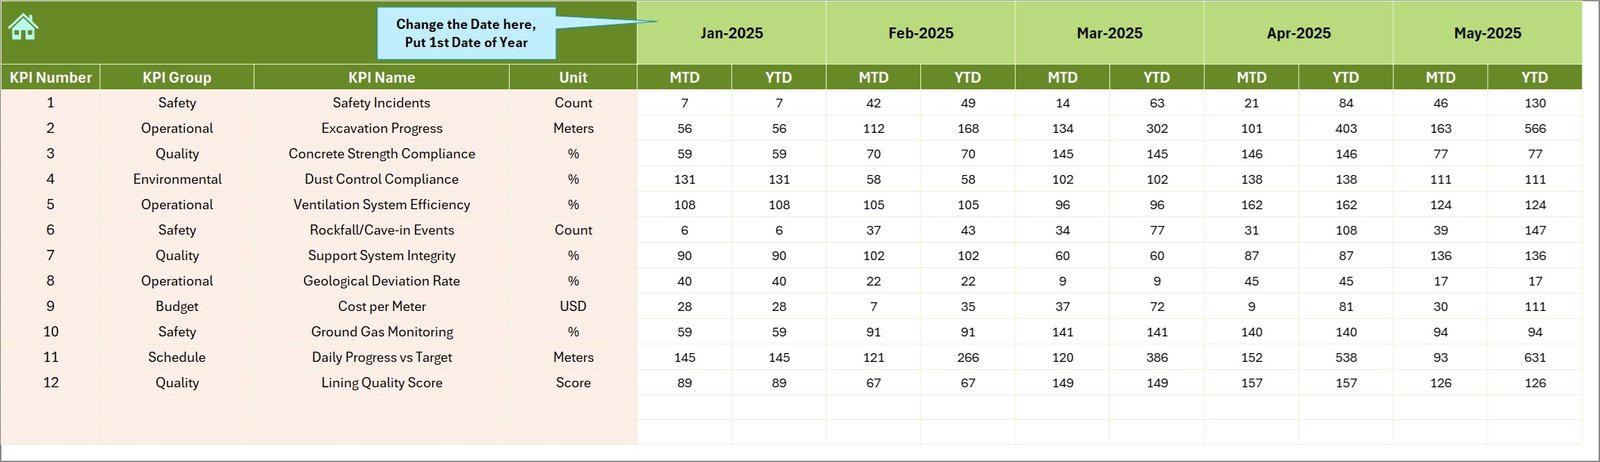
Actual Numbers Input Sheet
The Actual Numbers Input Sheet allows users to enter real performance data for each KPI.
Users must enter Month-To-Date (MTD) and Year-To-Date (YTD) values for the selected month.
Important Feature
Users can change the reporting month using cell E1.
To configure the dashboard correctly:
- Enter the first month of the year in cell E1
- Then input KPI values for each month
Once users enter data, the dashboard automatically updates charts and indicators.
Click to buy Tunnel Engineering KPI Dashboard in Excel
Target Sheet Tab
The Target Sheet allows users to define expected performance levels for each KPI.
Users must enter target numbers for:
- MTD values
- YTD values
Targets help organizations measure whether the project performs according to plan.
When the dashboard compares targets with actual results, it highlights performance gaps.
Click to buy Tunnel Engineering KPI Dashboard in Excel
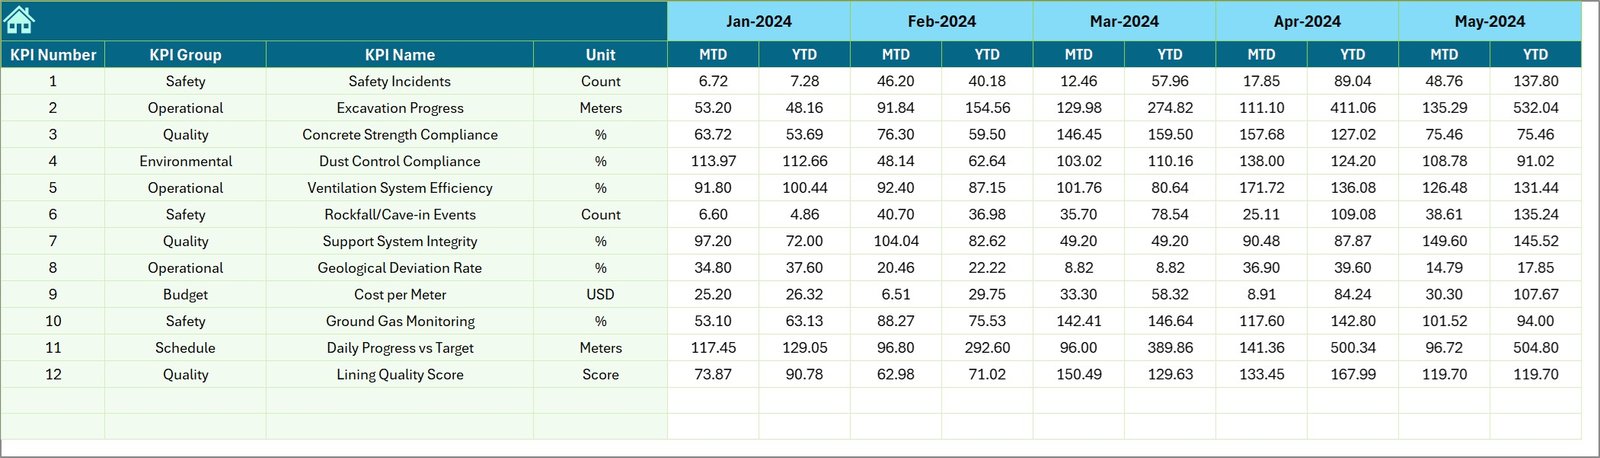
Previous Year Number Sheet
This worksheet stores the performance data from the previous year.
Users must enter previous year KPI numbers using the same format as the current year.
Because of this structure, the dashboard can compare:
- Current year performance
- Previous year performance
Therefore, managers can evaluate whether performance improves or declines over time.
Click to buy Tunnel Engineering KPI Dashboard in Excel
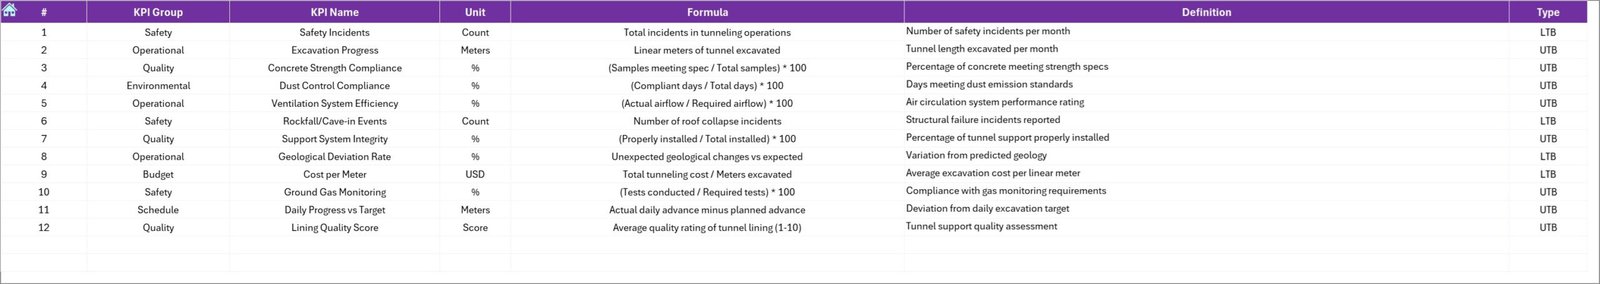
KPI Definition Sheet
The KPI Definition Sheet stores the complete information about each KPI.
This sheet contains the following columns:
- KPI Name
- KPI Group
- Unit of Measurement
- KPI Formula
- KPI Definition
This structure helps users understand each KPI clearly.
Moreover, it improves documentation and ensures consistency in KPI calculations.
Click to buy Tunnel Engineering KPI Dashboard in Excel
What KPIs Can Be Included in a Tunnel Engineering Dashboard?
Tunnel engineering projects track multiple performance indicators. Organizations can customize KPIs depending on project scope.
However, some commonly used tunnel engineering KPIs include:
Construction Progress KPIs
- Tunnel Excavation Progress (%)
- Daily Advance Rate
- Project Completion Percentage
- Delay Days vs Schedule
Safety KPIs
- Number of Safety Incidents
- Lost Time Injury Frequency Rate
- Safety Inspection Compliance Rate
- Safety Training Completion Rate
Operational KPIs
- Equipment Utilization Rate
- Machine Downtime Hours
- Maintenance Completion Rate
- Equipment Availability
Financial KPIs
- Cost Variance
- Budget Utilization
- Cost Per Meter Excavation
- Material Consumption Rate
Quality KPIs
- Quality Inspection Pass Rate
- Rework Percentage
- Material Defect Rate
- Compliance Audit Score
By monitoring these KPIs, tunnel engineering teams can improve project control.
Advantages of Tunnel Engineering KPI Dashboard in Excel
A well-designed KPI dashboard offers multiple benefits for tunnel construction projects.
- Centralized Performance Monitoring
The dashboard consolidates all KPIs into one system.
Therefore, managers no longer need to review multiple reports or spreadsheets.
- Faster Decision Making
Because the dashboard shows visual indicators, managers can identify issues quickly.
As a result, teams can take corrective action before problems escalate.
- Improved Project Visibility
The dashboard provides complete transparency into project performance.
Project stakeholders can easily monitor progress and performance trends.
- Better Target Tracking
The dashboard compares:
- Actual performance
- Target performance
- Previous year results
Therefore, organizations can evaluate project efficiency more accurately.
- Time Saving Reporting
Instead of preparing manual reports, teams can generate insights directly from the dashboard.
Consequently, this saves time and improves reporting efficiency.
- Data-Driven Project Management
When teams track KPIs regularly, they rely on data instead of assumptions.
As a result, tunnel engineering projects achieve better outcomes.
Best Practices for the Tunnel Engineering KPI Dashboard
Organizations must follow several best practices to get the most value from their KPI dashboards.
- Define Clear KPIs
First, teams must select KPIs that directly reflect project performance.
Avoid tracking unnecessary metrics.
Instead, focus on indicators that support decision-making.
- Update Data Regularly
Dashboard insights remain accurate only when data stays up to date.
Therefore, teams must update KPI values regularly.
- Use Standard KPI Definitions
All departments must follow the same KPI definitions.
This practice ensures consistency in performance measurement.
- Monitor Trends Instead of Single Values
Single KPI values rarely provide enough insights.
However, trend charts reveal performance patterns over time.
Therefore, teams should analyze KPI trends frequently.
- Train Team Members
Organizations must train staff on how to use the dashboard.
Proper training improves adoption and ensures accurate reporting.
Practical Use Cases of Tunnel Engineering KPI Dashboards
Many infrastructure organizations can benefit from this dashboard.
For example:
Infrastructure Construction Companies
Companies building tunnels for highways, metros, or railways can monitor project performance.
Government Infrastructure Agencies
Government departments managing tunnel infrastructure projects can track project progress efficiently.
Engineering Consulting Firms
Consultants can analyze performance data and generate insights for clients.
Project Management Offices
PMOs can track multiple tunnel projects and compare performance metrics.
How Does the Tunnel Engineering KPI Dashboard Improve Project Control?
Tunnel engineering projects require continuous monitoring and proactive management.
A KPI dashboard improves project control in several ways.
First, it provides real-time performance insights.
Second, it highlights performance deviations.
Third, it improves communication between stakeholders.
Finally, it supports data-driven decision making.
As a result, project teams can manage complex tunnel projects more efficiently.
Conclusion
Tunnel engineering projects involve complex operations, strict safety requirements, and continuous performance monitoring. Without a structured reporting system, organizations struggle to track progress, identify risks, and manage project performance.
However, the Tunnel Engineering KPI Dashboard in Excel simplifies this process. It consolidates KPI data, visualizes performance metrics, and provides actionable insights.
With features such as interactive dashboards, KPI trend analysis, target comparison, and structured data input sheets, this dashboard helps engineering teams monitor project performance efficiently.
Therefore, organizations involved in tunnel infrastructure projects can significantly improve project visibility, decision-making, and operational efficiency by using this dashboard.
Frequently Asked Questions (FAQs)
What is a Tunnel Engineering KPI Dashboard?
A Tunnel Engineering KPI Dashboard is a performance monitoring tool that tracks key metrics related to tunnel construction projects.
Why is a KPI dashboard important for tunnel engineering?
It helps project managers monitor performance, track progress, identify delays, and improve decision-making.
Can this dashboard track multiple KPIs?
Yes. Organizations can track multiple KPIs such as safety metrics, construction progress, equipment utilization, and financial performance.
Why should organizations use Excel for KPI dashboards?
Excel provides flexible data management, automation features, and visualization tools that make it ideal for KPI dashboards.
Can this dashboard be customized?
Yes. Organizations can easily customize KPIs, targets, and charts based on project requirements.
Visit our YouTube channel to learn step-by-step video tutorials
Watch the step-by-step video tutorial:
Click to buy Tunnel Engineering KPI Dashboard in Excel