Urban metro systems play a crucial role in modern cities. As urban populations grow rapidly, governments and transportation authorities must manage complex metro infrastructure projects efficiently. These projects involve multiple activities such as station construction, track installation, safety compliance, passenger management, and operational performance monitoring.
However, managing metro development using scattered spreadsheets or manual reports often leads to confusion. Decision-makers struggle to track project progress, budget utilization, passenger metrics, and operational efficiency. Consequently, project teams cannot identify delays, cost overruns, or performance issues quickly.
Therefore, organizations require a structured system that tracks important metro development KPIs in one place. A centralized KPI dashboard allows stakeholders to monitor performance, evaluate progress, and make informed decisions.
This is where the Urban Metro Development KPI Dashboard in Excel becomes extremely valuable.
The Urban Metro Development KPI Dashboard is a powerful Excel-based analytics tool designed to monitor key performance indicators related to metro construction, infrastructure development, and operational efficiency. Because it combines dynamic reporting, KPI tracking, and visual analytics, decision-makers can instantly understand project performance and identify improvement areas.
In this comprehensive guide, you will learn:
- What an Urban Metro Development KPI Dashboard is
- Why metro authorities need KPI monitoring tools
- Key features of the Excel dashboard template
- Advantages of using metro KPI dashboards
- Best practices for metro performance management
- Frequently asked questions about metro KPI dashboards
Click to buy Urban Metro Development KPI Dashboard in Excel
What Is an Urban Metro Development KPI Dashboard in Excel?
An Urban Metro Development KPI Dashboard is an Excel-based reporting tool that tracks and visualizes critical performance indicators related to metro rail projects.
It allows transportation authorities, infrastructure planners, and project managers to monitor:
- Construction progress
- Budget utilization
- Operational efficiency
- Passenger growth
- Safety performance
- Infrastructure readiness
Instead of reviewing dozens of reports, decision-makers can quickly analyze project performance through interactive charts and KPI indicators.
Moreover, Excel dashboards offer flexibility and ease of use. Users can update numbers, adjust targets, and analyze performance trends without complex software.
As a result, metro authorities gain better visibility into project progress and operational performance.
Why Do Cities Need Urban Metro Development KPI Dashboards?
Urban transportation projects involve massive investments and long development cycles. Without proper monitoring, projects often face delays, budget overruns, and operational challenges.
Therefore, KPI dashboards help organizations manage these projects effectively.
- Monitor Project Progress
Metro development involves several milestones such as track laying, station construction, system installation, and trial runs. A KPI dashboard tracks these activities and highlights progress.
- Improve Decision-Making
Leaders need accurate data to make timely decisions. With a dashboard, they can quickly identify problems and take corrective actions.
- Track Budget Utilization
Metro infrastructure projects require large investments. Dashboards help financial teams track expenses and control project costs.
- Evaluate Operational Efficiency
Once the metro system becomes operational, managers must monitor train frequency, passenger flow, and service reliability.
- Enhance Accountability
Performance dashboards clearly show which departments meet their targets and which areas require improvement.
Key Features of the Urban Metro Development KPI Dashboard in Excel
The Urban Metro Development KPI Dashboard in Excel includes several structured worksheets designed to simplify KPI monitoring and analysis.
The template contains 7 powerful worksheets, each serving a specific purpose.
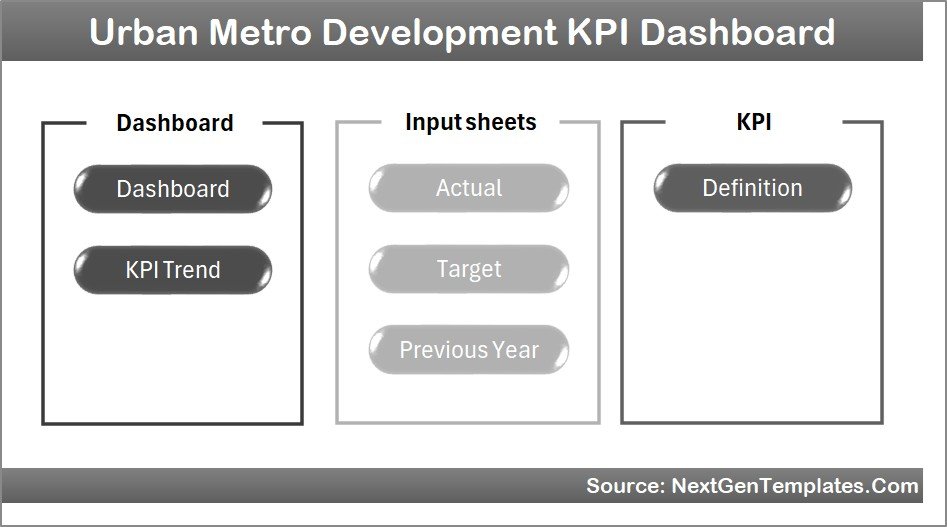
Summary Page
The Summary Page works as the index page of the dashboard.
This sheet includes six navigation buttons that allow users to jump quickly to different worksheets.
Because of this simple navigation system, users can easily move between different analysis sections.
Key benefits of the summary page:
- Easy navigation between worksheets
- Quick dashboard access
- Organized dashboard structure
Click to buy Urban Metro Development KPI Dashboard in Excel
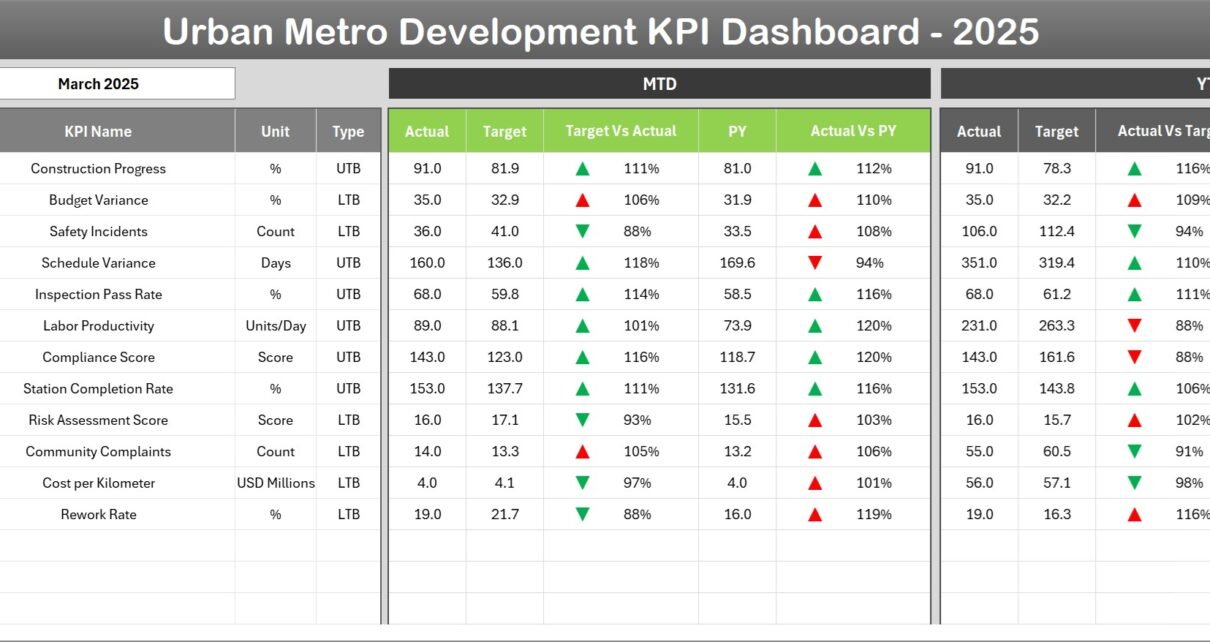
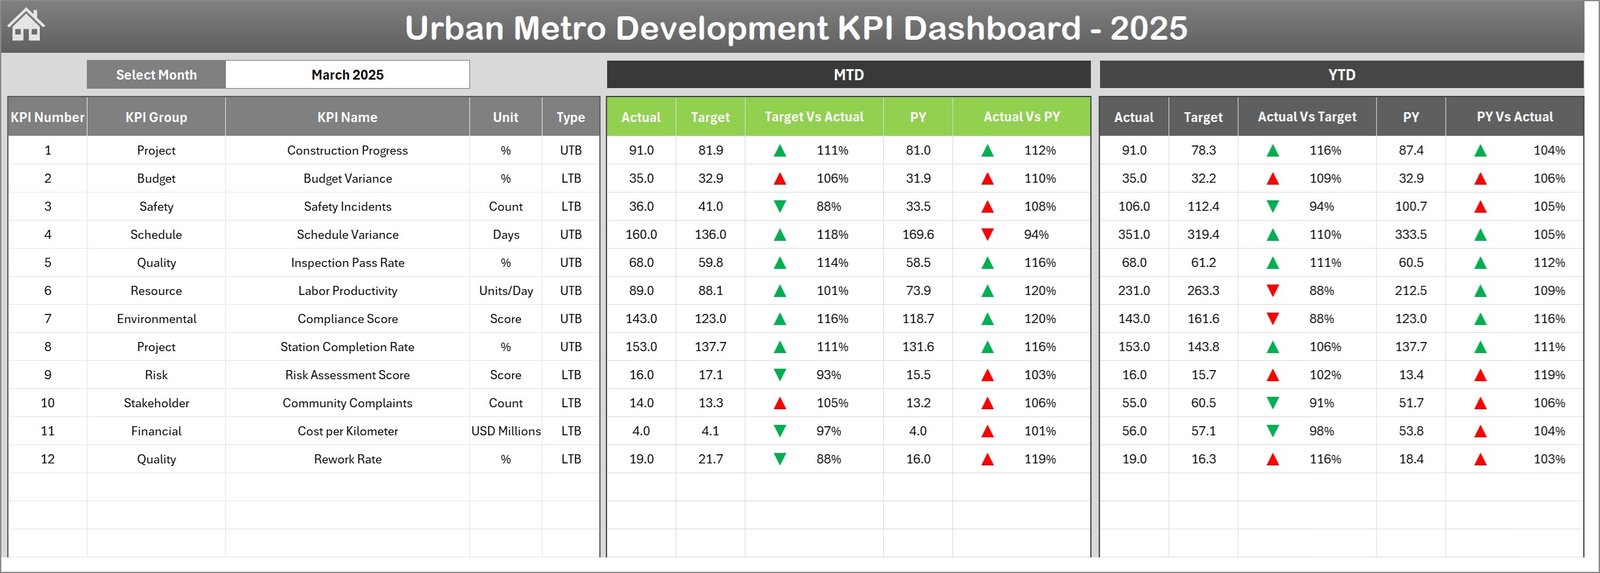
Dashboard Sheet
The Dashboard Sheet acts as the central reporting page.
This sheet displays all KPI metrics in a visually structured format. Users can instantly analyze performance indicators and compare them with targets.
A month selection dropdown in cell D3 allows users to change the reporting month. When the month changes, the entire dashboard updates automatically.
Metrics displayed in the dashboard include:
- MTD (Month-To-Date) Actual Values
- MTD Target Values
- Previous Year Performance
The dashboard also displays performance comparisons:
- Target vs Actual
- Previous Year vs Actual
Additionally, the dashboard uses conditional formatting arrows to show performance direction:
- Up arrow indicates improvement
- Down arrow indicates decline
YTD Performance Tracking
The dashboard also shows Year-To-Date (YTD) metrics, including:
- YTD Actual
- YTD Target
- Previous Year YTD
This feature allows project teams to evaluate long-term progress throughout the year.
Click to buy Urban Metro Development KPI Dashboard in Excel
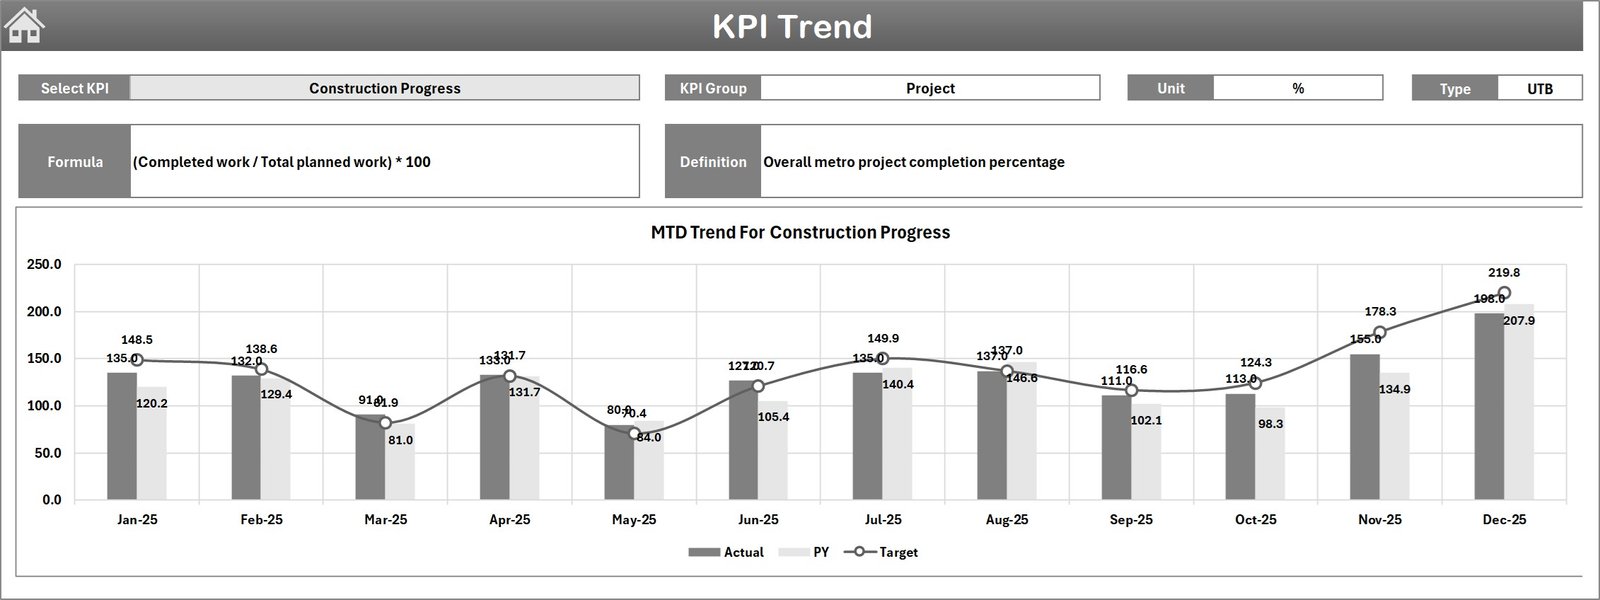
Trend Analysis Sheet
The Trend Sheet focuses on KPI trend analysis.
Users can select any KPI using the dropdown in cell C3. After selecting a KPI, the dashboard automatically displays detailed information.
The sheet displays the following information:
- KPI Group
- KPI Unit
- KPI Type (Lower is Better or Higher is Better)
- KPI Formula
- KPI Definition
Additionally, the sheet includes MTD and YTD trend charts.
These charts compare:
- Actual performance
- Target performance
- Previous year performance
As a result, managers can easily identify trends and performance patterns.
Click to buy Urban Metro Development KPI Dashboard in Excel
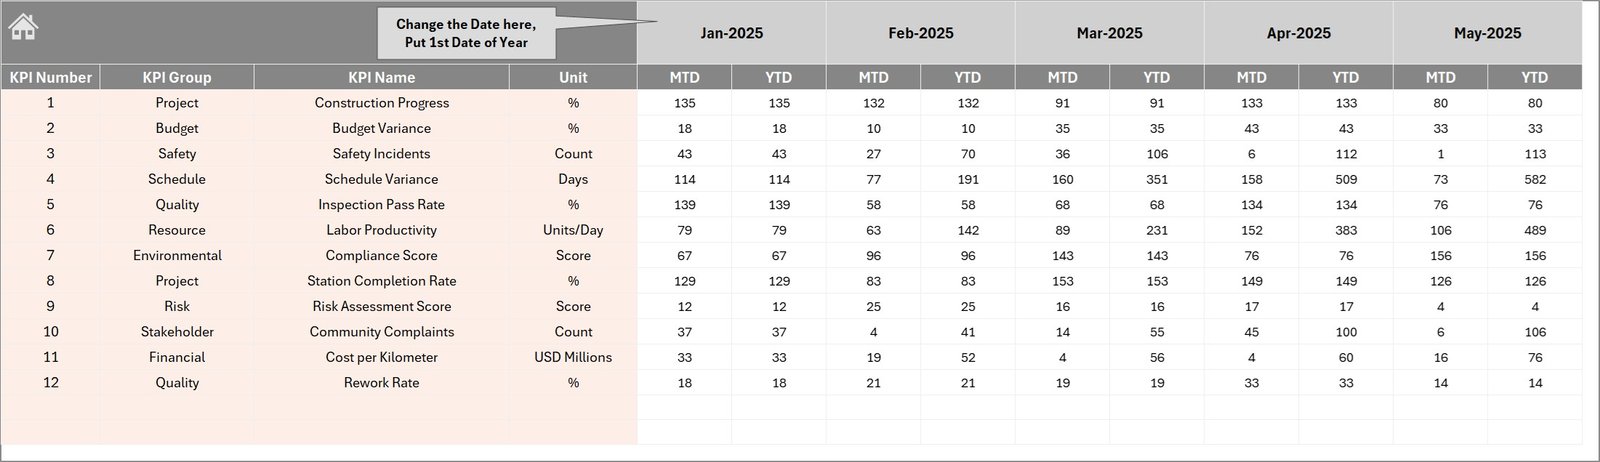
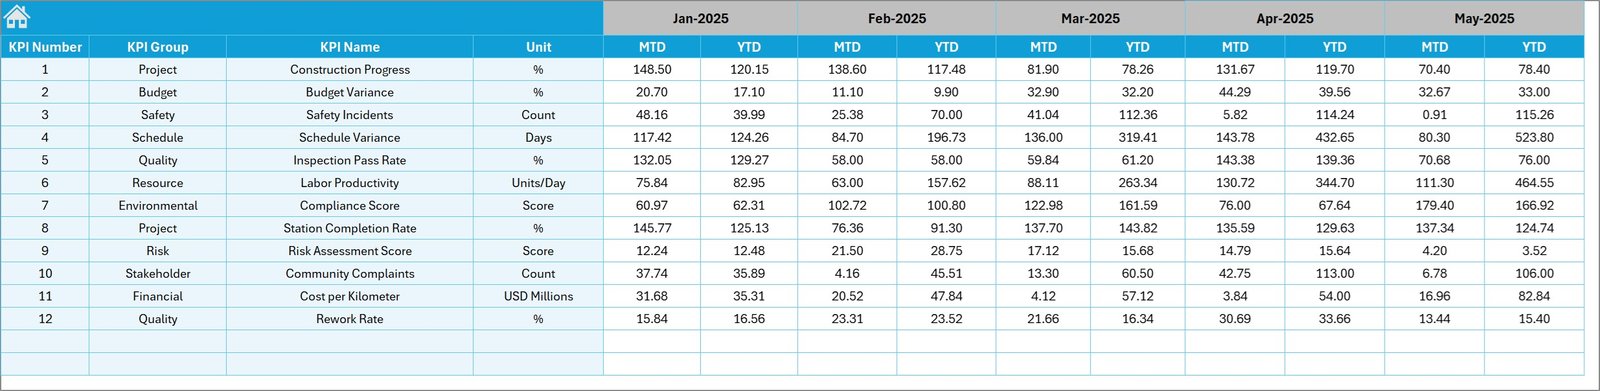
Actual Numbers Input Sheet
The Actual Numbers Input Sheet allows users to enter real operational data.
Users input both MTD and YTD values for each KPI.
A month selector in cell E1 allows users to set the starting month of the financial year.
Once users enter actual values, the dashboard automatically updates all charts and metrics.
Key advantages:
- Simple data entry
- Automatic dashboard updates
- Easy monthly performance tracking
Click to buy Urban Metro Development KPI Dashboard in Excel
Target Sheet
The Target Sheet allows managers to define monthly performance targets for each KPI.
Users must enter:
- MTD Target values
- YTD Target values
These targets help organizations measure actual performance against expected outcomes.
As a result, decision-makers can determine whether project activities remain on track.
Click to buy Urban Metro Development KPI Dashboard in Excel
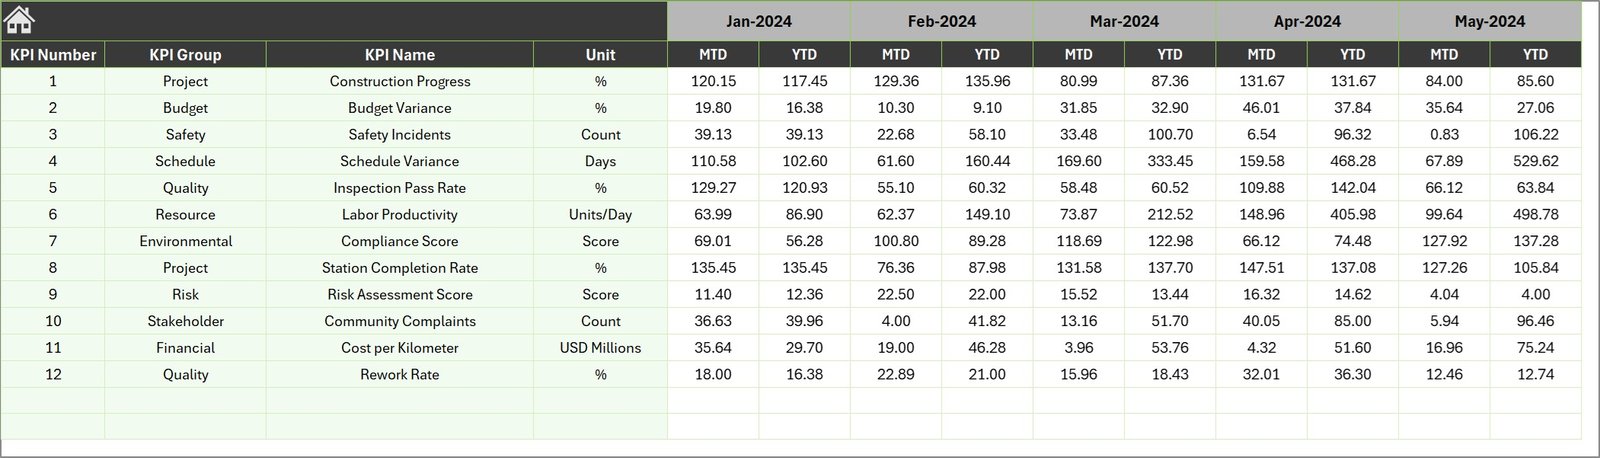
Previous Year Numbers Sheet
The Previous Year Numbers Sheet stores historical data from the previous year.
Users enter KPI values from the previous year using the same structure as the current year.
This data helps organizations compare performance across different years.
Consequently, managers can analyze long-term progress and identify growth trends.
Click to buy Urban Metro Development KPI Dashboard in Excel
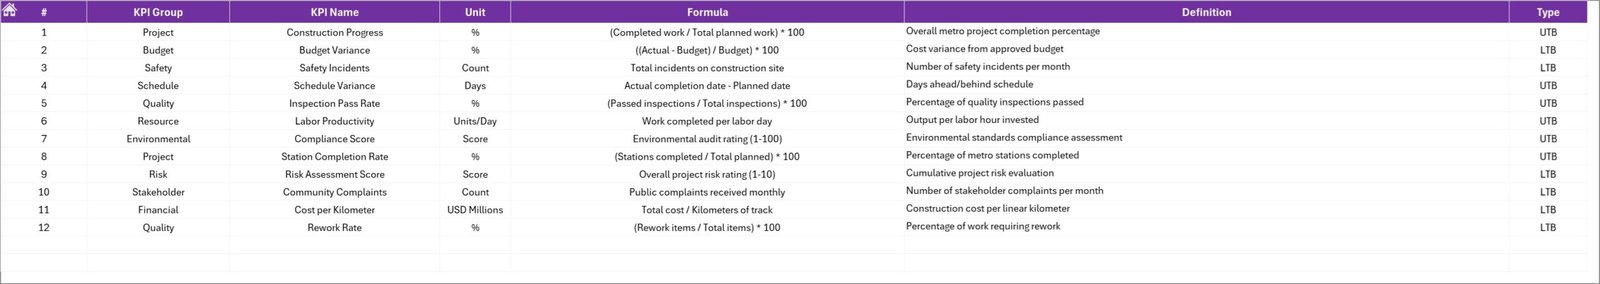
KPI Definition Sheet
The KPI Definition Sheet acts as the reference database for all KPIs used in the dashboard.
Users enter detailed information for each KPI, including:
- KPI Name
- KPI Group
- Unit of Measurement
- KPI Formula
- KPI Definition
Because of this structured approach, users can understand the meaning and calculation method of each KPI.
Click to buy Urban Metro Development KPI Dashboard in Excel
Advantages of Urban Metro Development KPI Dashboard in Excel
Organizations gain several advantages when they implement a KPI dashboard for metro development projects.
Centralized Performance Monitoring
A dashboard consolidates all KPI data in one place. Therefore, managers can quickly review project performance.
Real-Time Decision Support
When data updates regularly, leaders can detect problems early and take corrective action.
Time-Saving Reporting
Instead of preparing multiple reports manually, teams can generate insights instantly.
Better Performance Tracking
Dashboards highlight performance gaps using visual indicators.
Improved Infrastructure Planning
Metro authorities can analyze development trends and optimize project planning.
What Are the Important KPIs in Urban Metro Development?
Urban metro projects rely on several critical KPIs to measure success.
Common metro KPIs include:
- Construction completion percentage
- Station readiness index
- Track installation progress
- Budget utilization rate
- Train punctuality rate
- Passenger ridership growth
- Safety incident rate
- Operational efficiency index
- Maintenance completion rate
Tracking these KPIs helps authorities maintain service quality and infrastructure reliability.
Best Practices for the Urban Metro Development KPI Dashboard
To maximize the effectiveness of a KPI dashboard, organizations should follow several best practices.
- Define Clear KPIs
Each KPI must have a clear definition, formula, and measurement unit.
- Use Accurate Data Sources
Reliable data ensures accurate insights. Therefore, organizations should validate data regularly.
- Update Data Frequently
Regular updates help managers detect problems quickly.
- Keep the Dashboard Simple
Too many metrics can create confusion. Focus only on the most critical KPIs.
- Use Visual Indicators
Charts, icons, and conditional formatting improve data interpretation.
- Train Users Properly
Teams must understand how to input data and analyze reports.
Who Can Use the Urban Metro Development KPI Dashboard?
Many professionals benefit from metro KPI dashboards.
Common users include:
- Metro rail authorities
- Infrastructure project managers
- Urban transportation planners
- Government agencies
- Construction companies
- Financial analysts
- Smart city development teams
Because these stakeholders rely on accurate data, KPI dashboards become essential management tools.
How Does the Excel KPI Dashboard Improve Metro Project Management?
The Excel dashboard significantly improves project management by simplifying data analysis.
Better Progress Visibility
Managers can easily monitor project milestones.
Faster Performance Analysis
Charts and visual indicators simplify complex data.
Improved Collaboration
Teams can share the dashboard across departments.
Reduced Reporting Errors
Automation reduces manual reporting mistakes.
Conclusion
Urban metro systems form the backbone of modern transportation networks. However, managing large infrastructure projects requires accurate data, strong monitoring systems, and effective decision-making tools.
The Urban Metro Development KPI Dashboard in Excel provides a powerful solution for tracking metro development performance. Because it consolidates data, visualizes KPIs, and highlights trends, decision-makers gain complete visibility into project progress and operational efficiency.
Moreover, the dashboard simplifies reporting and improves accountability across departments. With structured worksheets, automated calculations, and visual analytics, transportation authorities can manage metro development projects more effectively.
As cities continue to expand their metro networks, tools like KPI dashboards will become essential for ensuring efficiency, transparency, and sustainable urban mobility.
Frequently Asked Questions (FAQs)
What is an Urban Metro Development KPI Dashboard?
An Urban Metro Development KPI Dashboard is an Excel-based reporting tool that tracks key performance indicators related to metro infrastructure development and operations.
Why should metro authorities use KPI dashboards?
KPI dashboards help organizations monitor project performance, track budgets, evaluate operational efficiency, and improve decision-making.
Can Excel handle complex KPI dashboards?
Yes. Excel offers powerful features such as charts, formulas, conditional formatting, and dropdown controls that allow users to create advanced dashboards.
What types of KPIs are used in metro development dashboards?
Common KPIs include construction progress, station readiness, train punctuality, passenger growth, safety metrics, and budget utilization.
Is the dashboard suitable for smart city projects?
Yes. Urban metro dashboards play a key role in smart city transportation planning and infrastructure management.
Visit our YouTube channel to learn step-by-step video tutorials
Watch the step-by-step video tutorial:
Click to buy Urban Metro Development KPI Dashboard in Excel