Poultry farming plays a major role in the agriculture industry. Farmers manage thousands of birds, handle multiple costs, track daily production, and monitor revenue trends. As poultry farms grow, decisions become complex. Farmers need quick insights into mortality, feed consumption, medicine costs, production patterns, and profit margins.
Because of this, most poultry businesses search for a simple way to analyze their numbers. This is where the Poultry Farming Dashboard in Excel becomes a powerful tool. It turns raw data into clear charts, tables, and KPIs that help farmers make better decisions every day.
In this detailed guide, you will learn everything about this dashboard—what it is, how it works, the key features, advantages, best practices, and answers to common questions.
Click to Purchases Poultry Farming Dashboard in Excel
What Is a Poultry Farming Dashboard in Excel?
A Poultry Farming Dashboard in Excel is a ready-to-use reporting tool that compiles all important poultry farm data into visual charts and KPIs. It tracks information such as:
-
Bird mortality
-
Feed cost
-
Medicine cost
-
Farm type performance
-
Bird type profitability
-
Monthly profit patterns
-
Under-treatment percentages
-
Total cost vs revenue
-
Profit margin
The dashboard uses slicers, page navigation buttons, and automated charts. This helps farmers view results instantly without writing formulas or updating complex sheets.
The best part? It works completely in Excel, so any farmer or farm manager can understand it quickly.
Why Do Poultry Farmers Need a Dashboard?
Poultry farms deal with dynamic changes every day. Costs rise, feed consumption changes, and mortality may increase due to diseases. Without a structured system, it becomes hard to track everything.
A dashboard helps because it:
-
Shows real-time farm performance
-
Reduces manual reporting work
-
Highlights areas where farmers lose profit
-
Gives clarity on costs and revenue
-
Helps compare farm, bird, and feed types
-
Makes long-term planning easier
Because poultry farms run on thin profit margins, accurate insights save time and money.
Key Features of the Poultry Farming Dashboard in Excel
This dashboard has 5 main reporting pages, a support sheet, and a data sheet. Each page focuses on a specific type of analysis.
Below is the complete explanation of each section.
Page Navigator
The dashboard includes a Page Navigator on the left side, which helps the user move easily between all five pages. This simple navigation improves workflow and saves time.
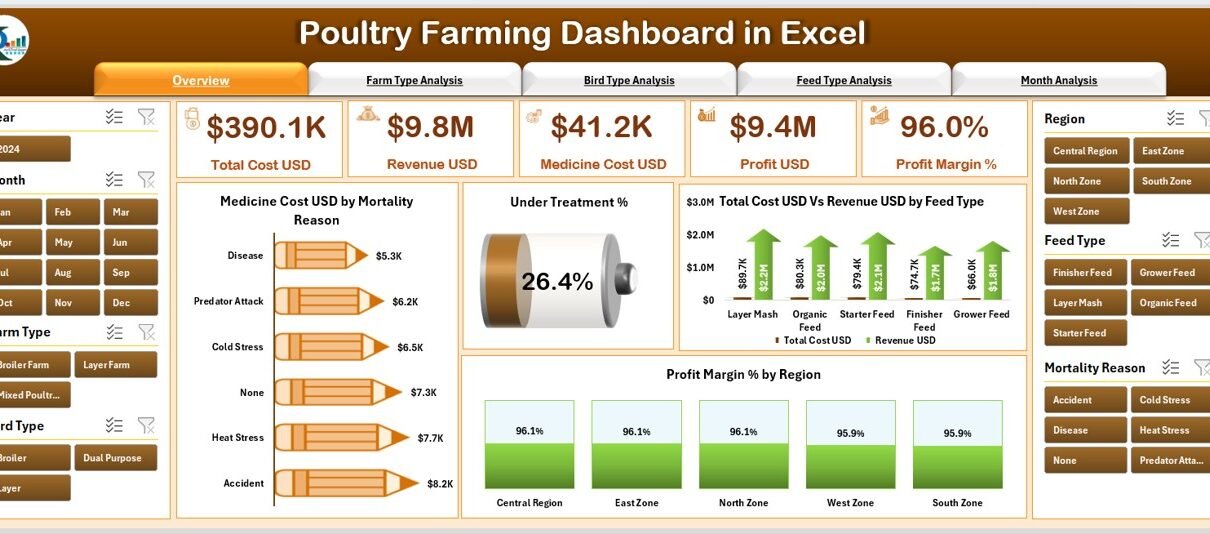
1. Overview Page (Main Dashboard)
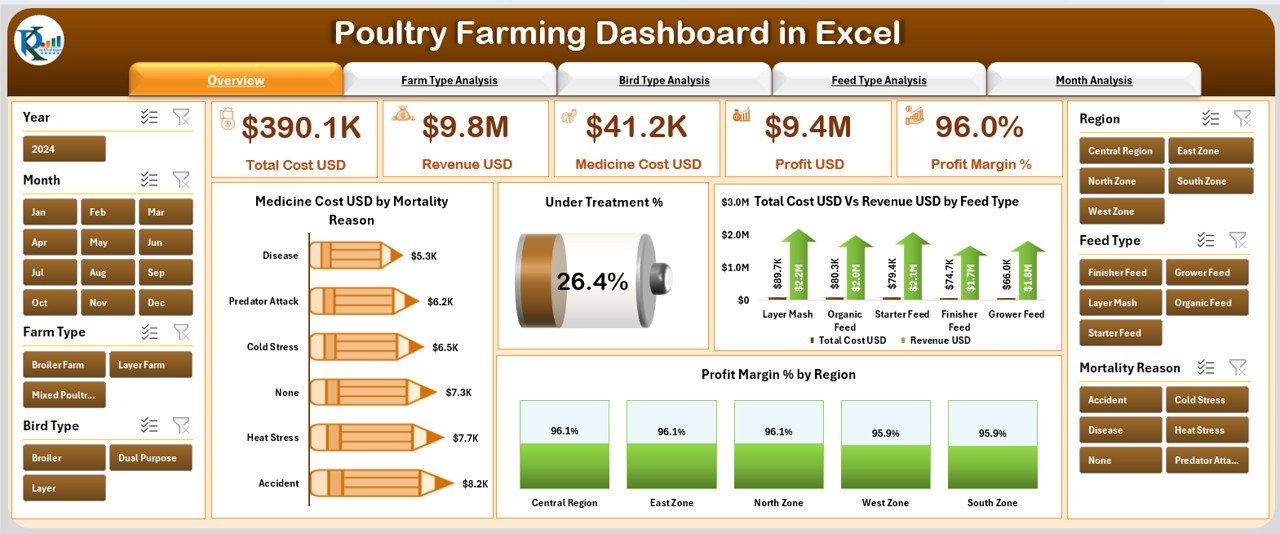
The Overview Page gives a complete summary of farm performance. It contains:
Slicers on the right side
Users can filter the entire dashboard by different categories such as:
-
Region
-
Bird type
-
Feed type
-
Farm type
-
Month
These slicers help farmers analyze data from different angles.
Cards (Top KPIs)
The page has 5 KPI cards, which may include:
-
Total Birds
-
Total Revenue
-
Total Cost
-
Average Profit Margin
-
Under Treatment %
-
Mortality Rate
These KPIs change instantly when users apply filters.
Charts
The page displays 4 important charts:
-
Medicine Cost (USD) by Mortality Reason
This helps identify why birds died and how medicine costs change. -
Under Treatment %
It shows the percentage of birds currently under treatment. -
Total Cost USD vs Revenue USD by Feed Type
This chart compares spending and earnings across different feed types. -
Profit Margin % by Region
It helps identify which region generates the highest profits.
Because of these visuals, farmers get a clear overview of their operations within seconds.
2. Farm Type Analysis Page
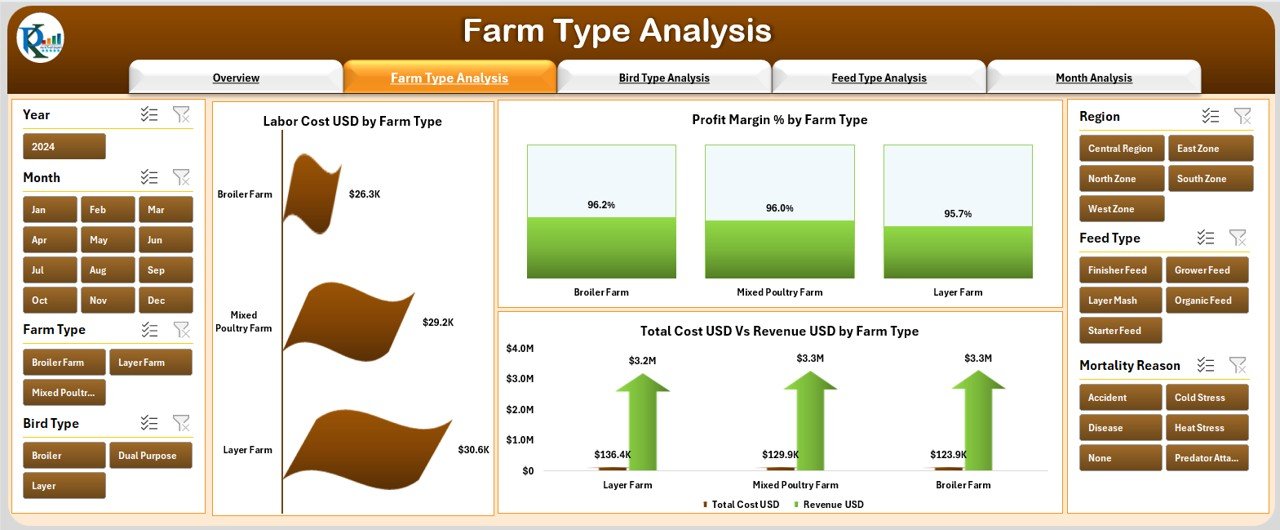
This page focuses on performance differences between farm types. Most farms operate with different units such as broiler farms, breeder farms, layer farms, or contract farms.
Slicers on the right side
Users can apply filters to compare farm types across months, regions, and feed types.
Charts on this page
The Farm Type Analysis page includes the following:
-
Labor Cost USD by Farm Type
Helps analyze how labor cost varies between different farms. -
Profit Margin % by Farm Type
Shows which farm type brings the best profit. -
Total Cost USD vs Revenue USD by Farm Type
Highlights whether a particular farm type remains profitable.
This page is very useful for farm owners who manage multiple farms at different locations.
3. Bird Type Analysis Page
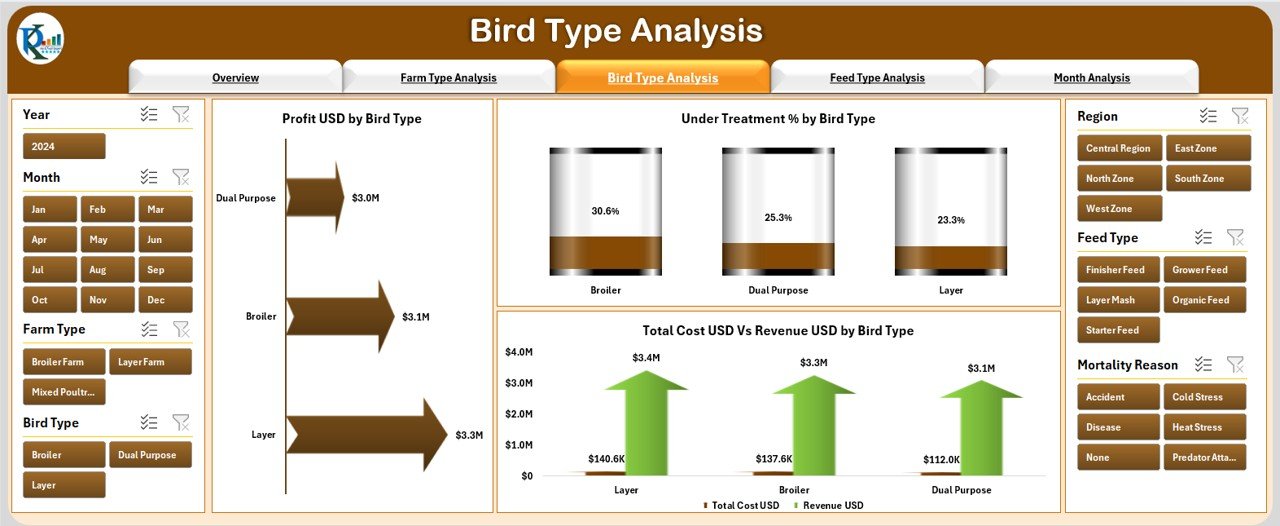
Bird performance is one of the biggest factors in poultry profitability. This page helps users compare different bird types such as:
-
Broilers
-
Layers
-
Breeders
-
Country chickens
-
Ducks
-
Turkeys
Charts included
-
Profit by Bird Type
Shows which bird type gives maximum profit. -
Total Cost USD vs Revenue USD by Bird Type
Helps farmers see if certain birds cost more than they earn. -
Under Treatment % by Bird Type
Identifies which bird type gets sick often.
These insights help farmers choose the best bird types for maximum return.
Click to Purchases Poultry Farming Dashboard in Excel
4. Feed Type Analysis Page
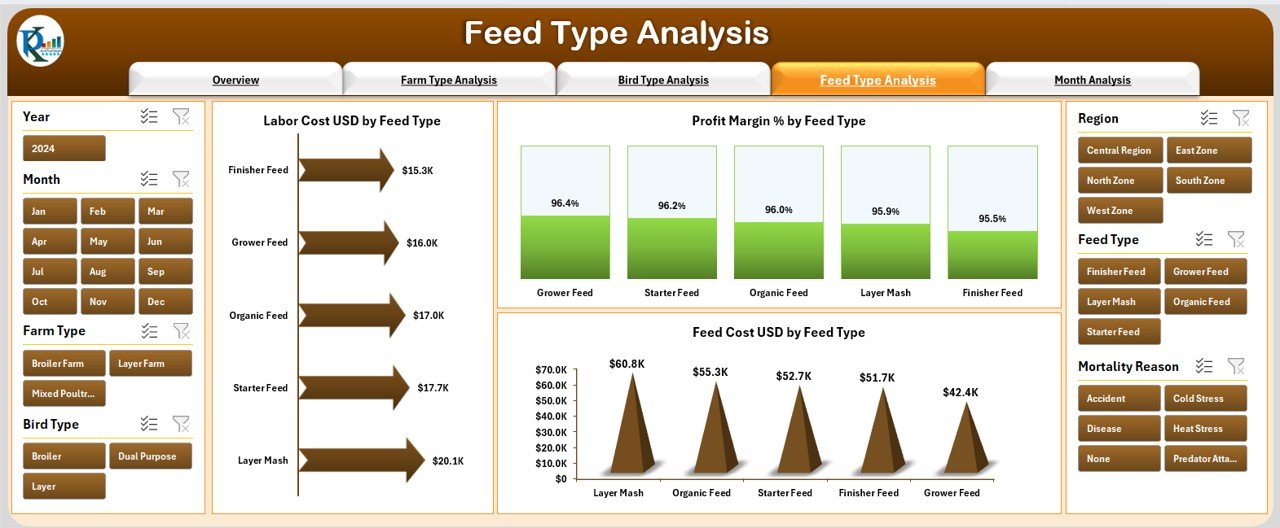
Feed cost covers almost 60–70% of poultry farm expenses. Because of this, feed analysis becomes extremely important.
Charts included on this page
-
Profit Margin % by Feed Type
Shows how feed impacts profitability. -
Total Cost USD vs Revenue USD by Feed Type
Helps compare feed cost with earnings. -
Labor Cost USD by Feed Type
Shows labor distribution based on feed categories.
This analysis helps farmers choose the most profitable and cost-effective feed types.
5. Month Analysis Page
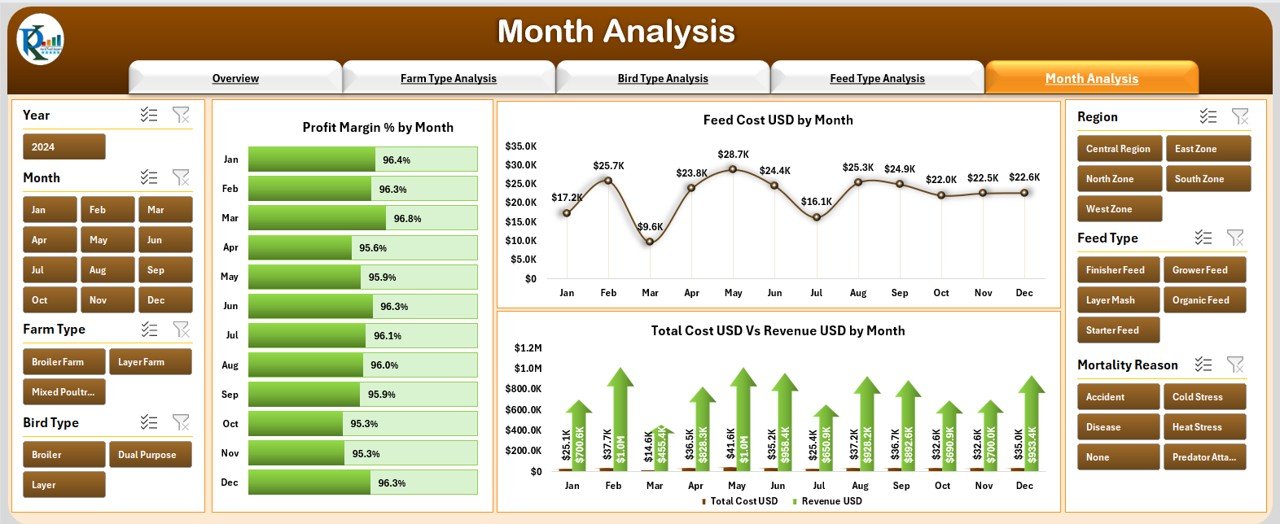
Every poultry farm experiences monthly variation in production, mortality, and profit margins. Therefore, this page shows trends month by month.
Charts included
-
Profit Margin % by Month
Shows which months perform better. -
Total Cost USD vs Revenue USD by Month
Identifies profit or loss patterns across the year. -
Feed Cost USD by Month
Helps track how feed expenses change over time.
Farmers use this page to plan production cycles, feeding schedules, and stocking patterns.
Support Sheet
The support sheet includes:
-
Lookup tables
-
Drop-down lists
-
Data validation lists
-
Category master lists
These help maintain accuracy throughout the dashboard.
Data Sheet
This sheet contains all the raw data related to:
-
Farm type
-
Bird type
-
Feed cost
-
Medicine cost
-
Treatment details
-
Cost and revenue
-
Monthly information
The dashboard uses formulas and pivot tables to convert this data into visuals.
Advantages of a Poultry Farming Dashboard in Excel
Here are the top benefits farmers gain when using this dashboard:
✔ 1. Saves Time on Reporting
Farmers do not need to create charts manually. The dashboard updates automatically.
✔ 2. Helps Reduce Costs
By monitoring feed, labor, and medicine costs, farmers discover opportunities to control expenses.
✔ 3. Improves Bird Health
Seeing mortality reasons and under-treatment percentages helps improve farm practices.
✔ 4. Increases Profit
Profit margin charts help farmers identify high-performing regions, bird types, and feed types.
✔ 5. Boosts Decision Making
Clear visuals help farmers take quick decisions with confidence.
✔ 6. Simple for Anyone to Use
Since it works in Excel, even non-technical users understand it easily.
✔ 7. Enhances Farm Planning
Monthly trend data helps farmers plan future production cycles smoothly.
Why This Dashboard Is Better Than Manual Reports
Many farmers still rely on manual sheets. However, manual work often leads to mistakes. The dashboard solves this by:
-
automatically updating charts
-
avoiding calculation errors
-
organizing data neatly
-
simplifying comparisons
-
reducing duplication of work
This dashboard remains reliable, accurate, and easy to maintain.
How to Use the Poultry Farming Dashboard
Using the dashboard is simple:
-
Enter new data into the Data Sheet.
-
Refresh pivot tables.
-
Use slicers to filter by region, bird type, feed type, or farm type.
-
Read the KPI cards to understand overall performance.
-
Explore charts for cost, revenue, and profit insights.
Within minutes, farmers can view complete farm performance without effort.
Best Practices for Using the Poultry Farming Dashboard in Excel
Follow these best practices for smooth usage:
1. Update Data Regularly
Daily or weekly updates help maintain accurate insights.
2. Maintain Clear Labels
Keep bird types, feed categories, and farm names consistent.
3. Review Profit Margins Often
Use the Profit vs Cost charts to adjust production plans.
4. Track Medicine Cost Carefully
High medicine costs may indicate deeper health issues.
5. Use Monthly Trends for Planning
Plan stocking, feeding, and harvesting cycles based on monthly trends.
6. Backup the Workbook Frequently
Always keep a backup to avoid losing important data.
7. Review Under Treatment % Regularly
High under-treatment values may require immediate action.
8. Train Your Team
Ensure farm managers know how to use slicers and filters.
Common Mistakes Farmers Make in Poultry Data Tracking
To get better results, avoid these mistakes:
-
Entering incomplete data
-
Mixing feed types
-
Ignoring monthly trends
-
Not analyzing mortality reasons
-
Skipping cost vs revenue comparison
-
Using inconsistent category names
The dashboard helps avoid these mistakes with proper structure and clear visuals.
Conclusion
The Poultry Farming Dashboard in Excel is a practical and powerful tool for farmers, farm managers, and agribusiness teams. It simplifies data tracking, highlights hidden insights, and improves decision-making. Because the dashboard uses Excel, anyone can use it without advanced technical knowledge.
With five detailed analysis pages—Overview, Farm Type, Bird Type, Feed Type, and Month Analysis—this dashboard covers every part of poultry operations. When used correctly, it reduces costs, improves profitability, and helps farmers grow their business confidently.
If you want a simple yet effective way to manage your poultry farm performance, this dashboard gives you the clarity you need.
Frequently Asked Questions (FAQs)
1. What is the purpose of a Poultry Farming Dashboard in Excel?
It helps farmers track costs, revenue, mortality, treatment, feed performance, and profit margins using simple visuals.
2. Can beginners use this dashboard easily?
Yes. The dashboard uses simple Excel functions, slicers, and charts that even beginners can understand.
3. How often should I update the data?
You should update data weekly or daily to get accurate insights.
4. Can I add more bird types or regions?
Yes. You can add more categories in the support sheet and data sheet.
5. Does the dashboard show profit trends?
Yes. It shows profit margin by bird type, feed type, farm type, region, and month.
6. Can I compare costs and revenue?
Yes. Many charts show total cost vs revenue across various categories.
7. Is Excel enough for poultry analysis?
Yes. Excel gives clean visuals, fast calculations, and easy reporting for farm managers.
Visit our YouTube channel to learn step-by-step video tutorials