The animation and VFX industry grows every year because global demand for digital content keeps rising. However, studios face many challenges such as complex workflows, tight deadlines, high production costs, and the need for accurate resource planning. As a result, every studio must monitor its operations in a more structured way.
An Animation & VFX Dashboard in Power BI solves these challenges because it brings all production, financial, and performance metrics into one place. It also helps studios track revenue, profit, milestones, and project progress without using multiple files or reports.
In this detailed article, you will learn everything about the Animation & VFX Dashboard in Power BI, its pages, key features, advantages, best practices, and FAQs. This article uses simple words, smooth transitions, and a clear structure so you can understand the full value of this dashboard.
Click to Purchases Animation & VFX Dashboard in Power BI
What Is an Animation & VFX Dashboard in Power BI?
An Animation & VFX Dashboard in Power BI is a ready-to-use reporting solution that helps studios, production houses, and VFX teams monitor their operations. It collects data from an Excel file and converts it into simple visuals such as cards, slicers, pie charts, bar charts, trend charts, and comparison metrics.
Since the dashboard runs inside Power BI, teams can view insights with one click. They can also filter the data using slicers such as Month, Studio Name, Department, Project Type, and Software Tool. This gives more control because every team member gets real-time insights without going through large datasets.
Why Do Animation & VFX Studios Need a Dashboard?
Animation and VFX projects involve many moving parts such as software usage, labor cost, rendering cost, client deliverables, project deadlines, and production quality. Monitoring all these areas manually creates confusion and delays.
A dashboard solves this problem because:
-
It creates a central reporting system
-
It shows real-time studio, project, and department performance
-
It reduces manual reporting
-
It reveals hidden cost patterns
-
It improves decision-making
-
It increases productivity
With Power BI, everything becomes interactive, fast, and visually clear.
Key Features of the Animation & VFX Dashboard in Power BI
This dashboard contains five powerful pages, each designed to answer specific production and business questions. You can explore each page using slicers to view month-wise, studio-wise, department-wise, and project-wise insights.
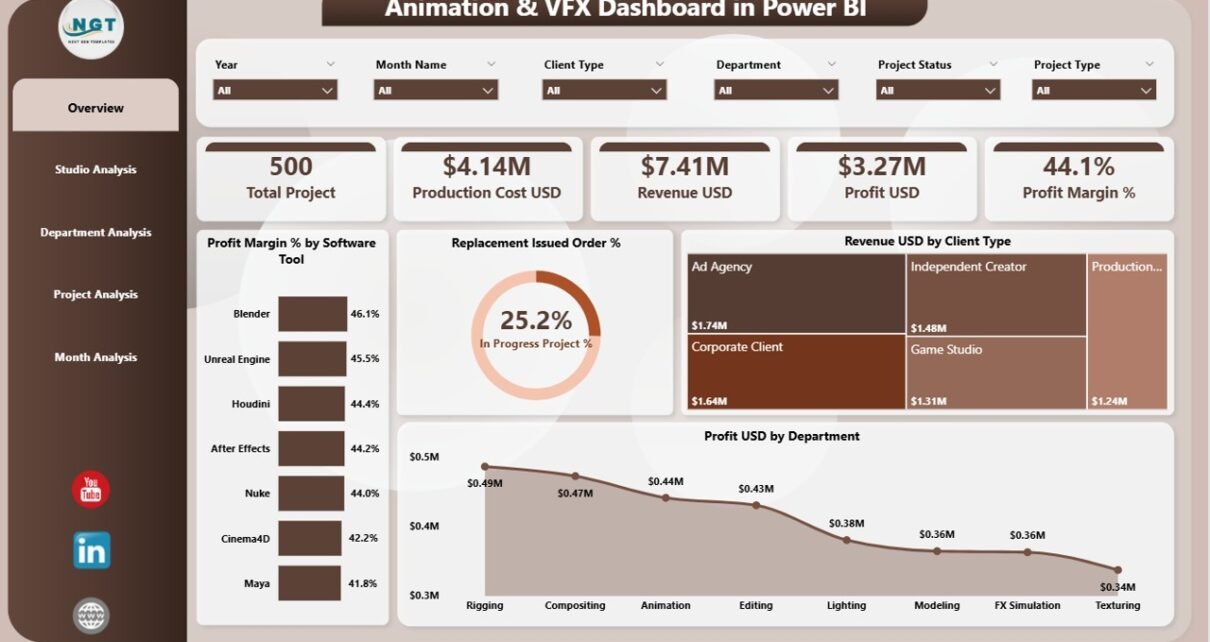
Page 1: Overview Page – The Complete Picture in One Page
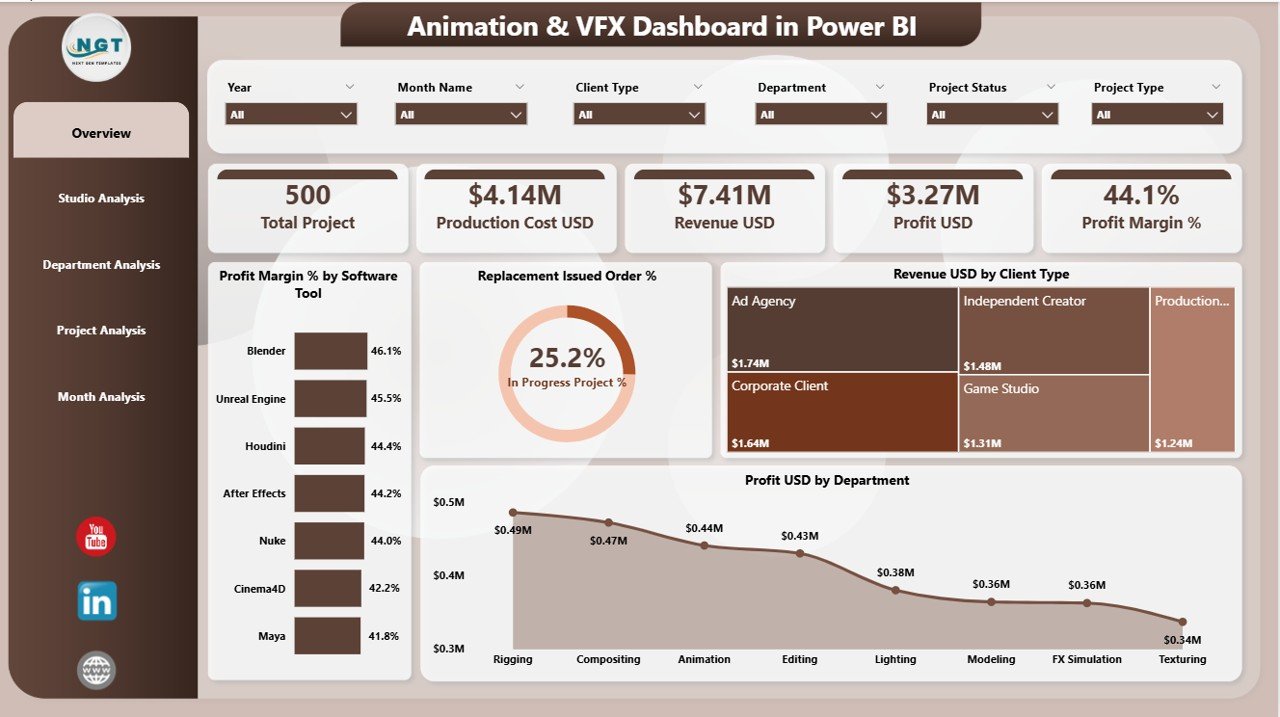
The Overview Page is the main page of the dashboard. It gives a high-level snapshot of the studio’s performance.
This page includes slicers for filtering data, 4 important KPI cards, and 4 key charts.
Slicers on the Overview Page
-
Month
-
Studio Name
-
Department
-
Project Type
-
Software Tool
KPI Cards
These cards help leadership teams see the current performance at a glance.
-
Total Revenue (USD)
-
Total Production Cost (USD)
-
Total Profit (USD)
-
Profit Margin (%)
Charts on the Overview Page
This page includes four important charts:
-
Profit Margin % by Software Tool – Helps identify which tools generate better outcomes.
-
Replacement Issue Order % – Shows how many tasks need rework or replacement.
-
Revenue USD by Client Type – Helps understand which client segment brings the highest earnings.
-
Profit USD by Department – Shows which departments contribute the most to the overall profit.
This page is ideal for studio owners and managers who want a quick overview without switching between screens.
Page 2: Studio Analysis – Compare Studios with Clear Visuals
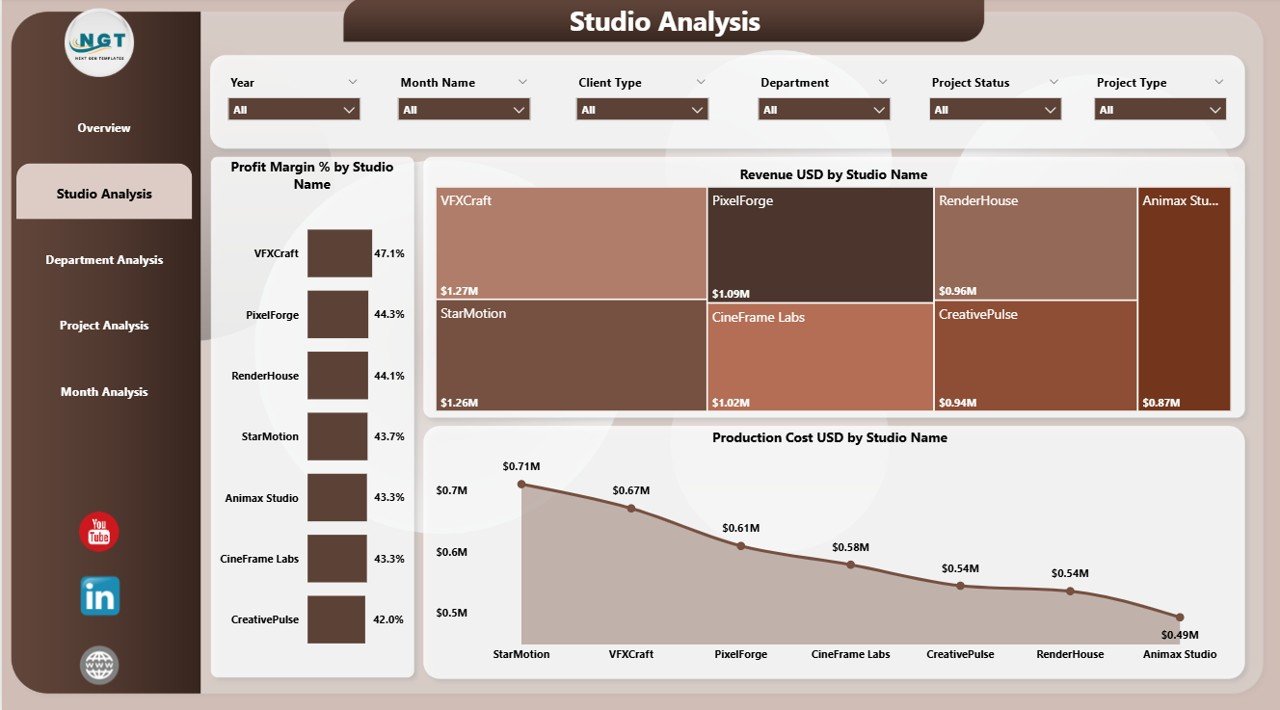
The Studio Analysis Page focuses on understanding how each studio or branch performs. It also includes slicers for filtering studio-specific data.
Charts on the Studio Analysis Page
-
Profit Margin % by Studio Name – Compares profitability across different studios.
-
Revenue USD by Studio Name – Shows which studio brings the highest revenue.
-
Production Cost USD by Studio Name – Helps analyze cost patterns for each studio.
This page helps leaders identify the strongest studios and areas where improvement is required.
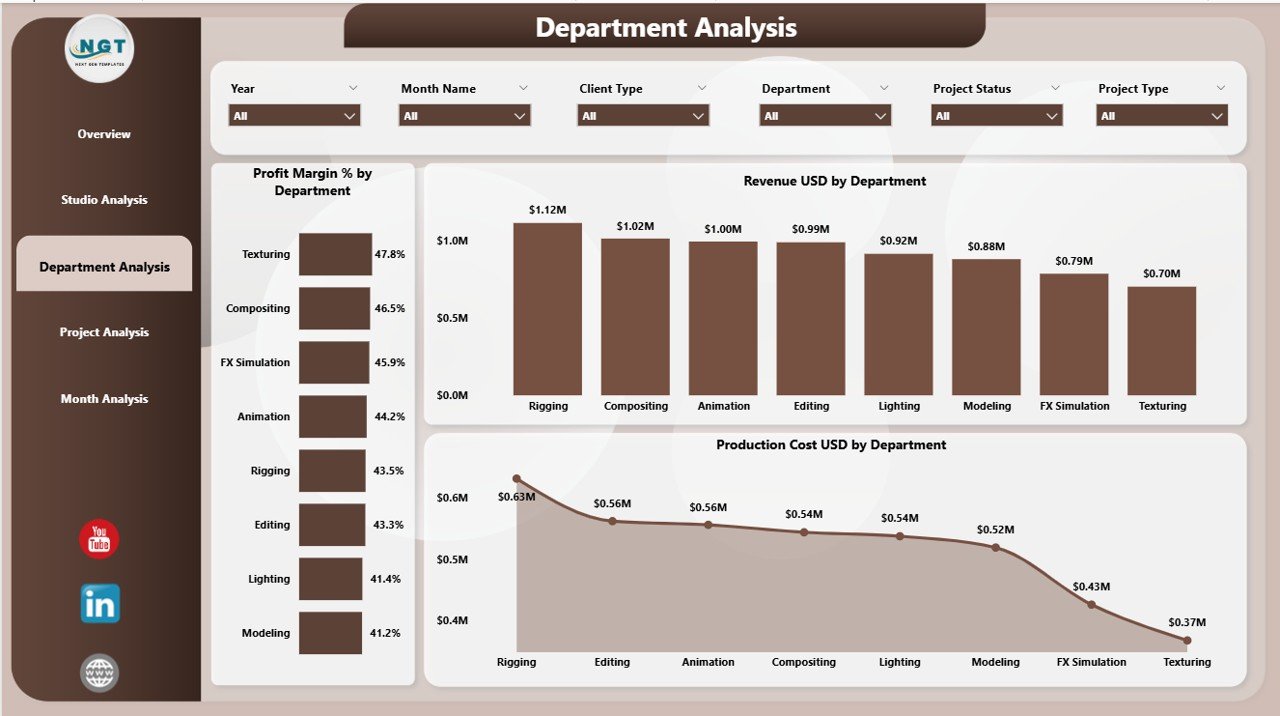
Page 3: Department Analysis – Deep Dive into Department Performance
Animation and VFX projects run across multiple departments. Some of them include:
-
Storyboarding
-
Layout
-
Modeling
-
Texturing
-
Rigging
-
Animation
-
Lighting
-
FX
-
Rendering
-
Compositing
The Department Analysis Page helps compare the performance of all these units.
Charts on the Department Analysis Page
-
Profit Margin % by Department
-
Revenue USD by Department
-
Production Cost USD by Department
This insight helps studios understand which departments work most efficiently and which departments need better planning.
Click to Purchases Animation & VFX Dashboard in Power BI
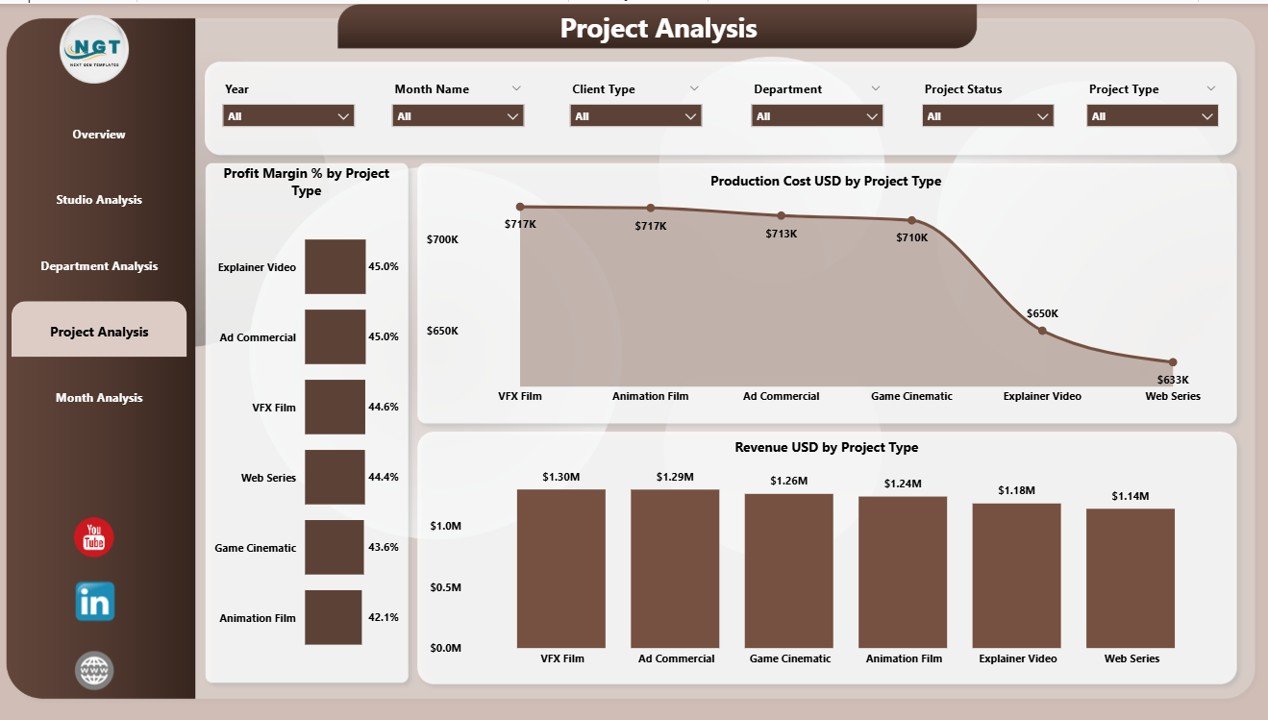
Page 4: Project Analysis – Evaluate Project Types and Their Results
Every studio handles multiple project types such as:
-
2D Animation
-
3D Animation
-
VFX
-
Motion Graphics
-
Gaming Animation
-
Commercial Ads
-
Feature Films
-
OTT Projects
The Project Analysis Page helps studios understand which project type generates better revenue, lower cost, and higher profit.
Charts on the Project Analysis Page
-
Profit Margin % by Project Type
-
Revenue USD by Project Type
-
Production Cost USD by Project Type
With these visuals, project managers identify high-value projects and avoid low-profit assignments.
Page 5: Monthly Trends – Track Month-Wise Growth and Decline

The final page of the dashboard displays Monthly Trends, which help studios understand seasonal patterns.
Charts on the Monthly Trends Page
-
Profit Margin % by Month
-
Revenue USD by Month
-
Production Cost USD by Month
Monthly comparison supports accurate forecasting, budget planning, and resource allocation.
Advantages of Animation & VFX Dashboard in Power BI
Using Power BI for animation and VFX reporting offers many advantages. Below are the major benefits explained in simple words.
1. Complete Visibility
The dashboard gives full visibility into revenue, cost, project progress, studio performance, and department strength.
2. Faster Decision-Making
Leaders get every metric in one place, so they take decisions faster without waiting for manual reports.
3. Accurate Cost Analysis
The dashboard tracks production cost, rendering cost, and department cost in one click.
4. Improved Productivity
Teams spend less time preparing reports and more time creating amazing animations and visual effects.
5. Strong Client Management
Client-wise revenue insights help teams understand high-value clients and improve negotiation strategy.
6. Better Resource Planning
You can track the performance of teams, software tools, and project types to plan resources more effectively.
7. Higher Profitability
Since studios can see profit margins by studio, department, and project type, they improve efficiency and reduce waste.
Best Practices for Using an Animation & VFX Dashboard in Power BI
To get the best results from this dashboard, follow these simple and practical best practices.
1. Keep Your Data Clean
Always update your Excel data properly with correct values. Clean data gives accurate reporting.
2. Use Slicers for Better Insights
Explore different insights by using Month, Department, Studio Name, and Project Type slicers.
3. Review Monthly Trends Regularly
Monthly analysis helps you find seasonal patterns and adjust your resource usage.
4. Track Profit Margins Constantly
A small change in profit margin affects overall results, so monitor it regularly.
5. Compare Departments Frequently
Some departments perform better than others. Use the Department Analysis page to identify gaps.
6. Update Targets and KPIs Every Month
Refreshing KPIs keeps your dashboard useful and updated.
7. Share Dashboard with Teams
Power BI dashboards are shareable, so allow departments to access their specific pages.
How Does This Dashboard Help Animation Studios Grow?
A Power BI dashboard helps studios grow in many ways:
-
It highlights the most profitable services
-
It reduces waste and unnecessary cost
-
It improves studio-wide efficiency
-
It strengthens client relationships
-
It supports long-term financial growth
-
It helps teams meet deadlines with proper planning
When a studio uses data to make decisions, it always grows faster and performs better.
Click to Purchases Animation & VFX Dashboard in Power BI
Conclusion
The Animation & VFX Dashboard in Power BI is a smart and modern tool for every animation and visual effects studio. It organizes your data, improves decision-making, increases visibility, and boosts studio performance. With five powerful pages—Overview, Studio Analysis, Department Analysis, Project Analysis, and Monthly Trends—this dashboard gives full control over your operations.
Studios that use this dashboard stay ahead of the competition because they understand their strengths, spot improvement areas, and plan better. If you want to manage your projects, reduce cost, and increase profit, then an Animation & VFX Dashboard in Power BI is the best solution.
Frequently Asked Questions (FAQ)
1. What is an Animation & VFX Dashboard in Power BI?
It is a ready-to-use reporting tool that helps studios monitor revenue, cost, profit margin, and project performance using interactive visuals.
2. Who should use this dashboard?
Studio owners, project managers, department heads, production leaders, and VFX supervisors.
3. Does this dashboard require coding knowledge?
No. Power BI uses drag-and-drop visuals, so anyone can use the dashboard.
4. Can I add more KPIs to this dashboard?
Yes, you can add custom KPIs such as rendering hours, manpower cost, or asset delivery count.
5. How often should I update the data?
You should update the Excel data every week or every month based on your production cycle.
6. Can I filter the insights?
Yes. You can filter by Month, Studio Name, Department, Project Type, and Software Tool.
7. What makes this dashboard helpful for studios?
It reduces manual reporting, increases productivity, and helps teams take better decisions.
8. Can I share this dashboard with my team?
Yes. Power BI allows dashboard sharing with team members and management.
Visit our YouTube channel to learn step-by-step video tutorials
Click to Purchases Animation & VFX Dashboard in Power BI