Managing refinery contracts involves high-value transactions, multiple vendors, long-term agreements, and strict compliance requirements. Therefore, teams must track contracts carefully and make fast decisions using accurate data. However, when teams rely on scattered Excel files or manual tracking, they lose control, miss deadlines, and face financial risks.
That is exactly why the Refinery Contract Management Dashboard in Excel plays a vital role.
This powerful dashboard helps refinery teams track contracts, analyze values, monitor vendor performance, and manage renewals from one centralized platform. Moreover, it helps decision-makers visualize trends and act quickly.
In this detailed guide, you will learn everything about the Refinery Contract Management Dashboard in Excel, including its structure, features, advantages, best practices, and frequently asked questions.
Click to Purchases Refinery Contract Management Dashboard in Excel
What Is a Refinery Contract Management Dashboard in Excel?
A Refinery Contract Management Dashboard in Excel works as a centralized analytical tool that tracks, monitors, and evaluates all refinery-related contracts in one place.
Instead of managing contract data across emails, spreadsheets, and systems, this dashboard brings everything together. As a result, refinery teams can easily analyze contract values, renewal status, vendor performance, and department-wise contract distribution.
Moreover, Excel allows teams to customize the dashboard, update data quickly, and generate insights without any expensive software.
Why Do Refineries Need a Contract Management Dashboard?
Refineries manage contracts related to:
-
Maintenance services
-
Equipment procurement
-
Fuel transportation
-
Logistics services
-
Vendor agreements
-
Long-term operational contracts
Because these contracts involve large values and long durations, even a small mistake can cause financial loss.
Therefore, a contract management dashboard helps refineries:
-
Track contract performance
-
Monitor renewal timelines
-
Identify high-value contracts
-
Compare vendor performance
-
Reduce operational risks
Most importantly, it helps decision-makers take action based on real-time insights.
Overview of Refinery Contract Management Dashboard in Excel
This dashboard works as a ready-to-use Excel solution that includes interactive visuals, filters, and performance metrics.
The dashboard includes five main analytical pages, along with a structured data sheet and a support sheet.
Let us explore each section in detail.
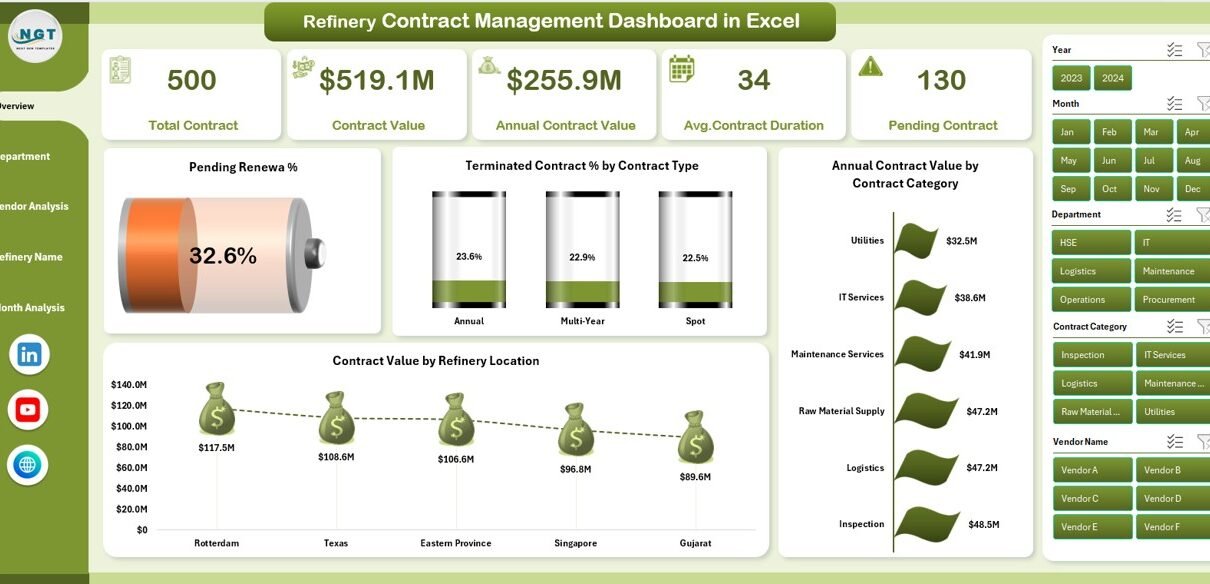
1. Overview Page – Complete Contract Snapshot
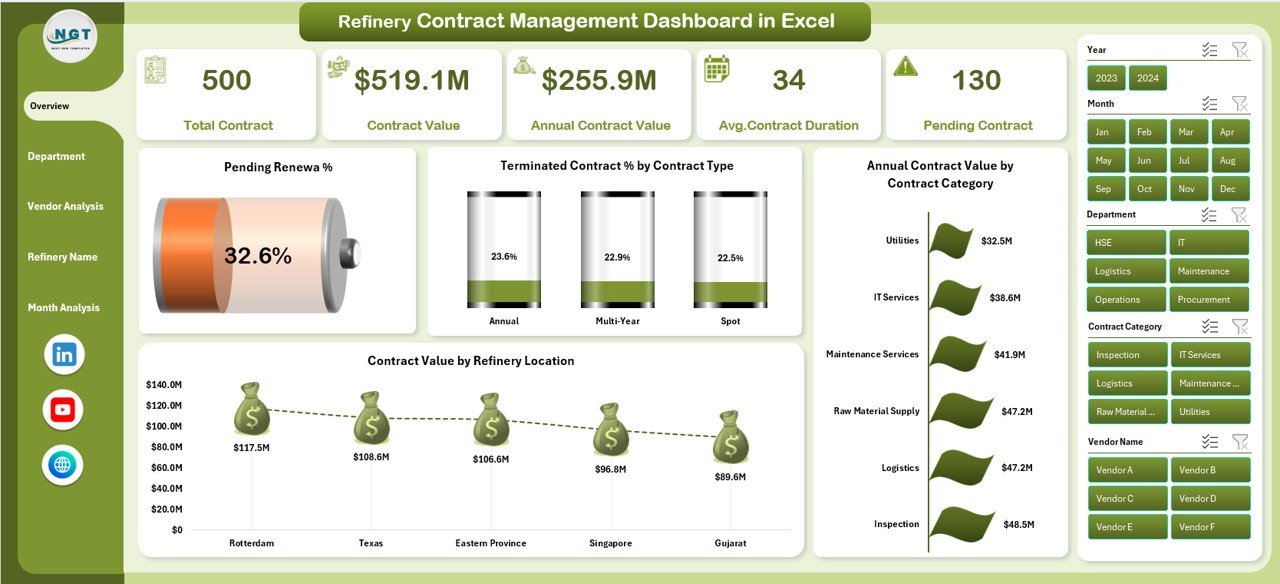
The Overview Page acts as the main control panel of the dashboard.
🔹 Key Features of the Overview Page
-
Right-side slicer for dynamic filtering
-
Four interactive KPI cards
-
Visual comparison charts
-
High-level contract insights
🔹 Charts Available on the Overview Page
✅ Pending Revenue %
This chart shows the percentage of contract revenue that remains pending. It helps finance teams identify delayed or incomplete contracts.
✅ Terminated Contract % by Contract Type
This chart highlights termination trends based on contract type. As a result, teams can identify risky contract categories.
✅ Annual Contract Value by Contract Category
This visualization displays the total contract value across categories such as maintenance, logistics, procurement, and services.
✅ Contract Value by Refinery Location
This chart helps management compare contract values across different refinery locations.
👉 Because of these visuals, managers can understand the complete contract status within seconds.
2. Department Analysis Page – Department-Level Insights
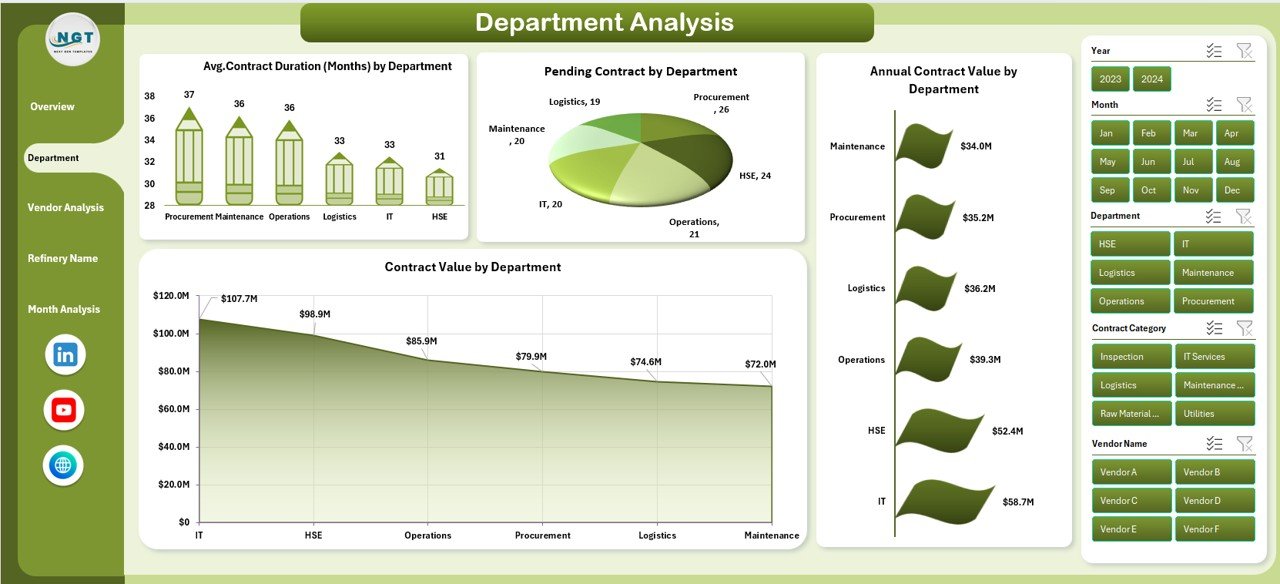
The Department Analysis page focuses on how each department performs in contract management.
🔹 Key Highlights of Department Analysis
-
Right-side slicer for easy filtering
-
Department-wise performance tracking
-
Clear comparison between departments
🔹 Charts Available
📊 Average Contract Duration by Department
This chart shows how long contracts usually run in each department.
📊 Pending Contracts by Department
This chart highlights which departments have the highest number of pending contracts.
📊 Annual Contract Value by Department
This visualization helps identify which department controls the highest contract value.
📊 Contract Value by Department
This chart helps compare contract size and value distribution across departments.
👉 With this page, leadership can quickly spot inefficiencies and improve department performance.
Click to Purchases Refinery Contract Management Dashboard in Excel
3. Vendor Analysis Page – Vendor Performance Tracking
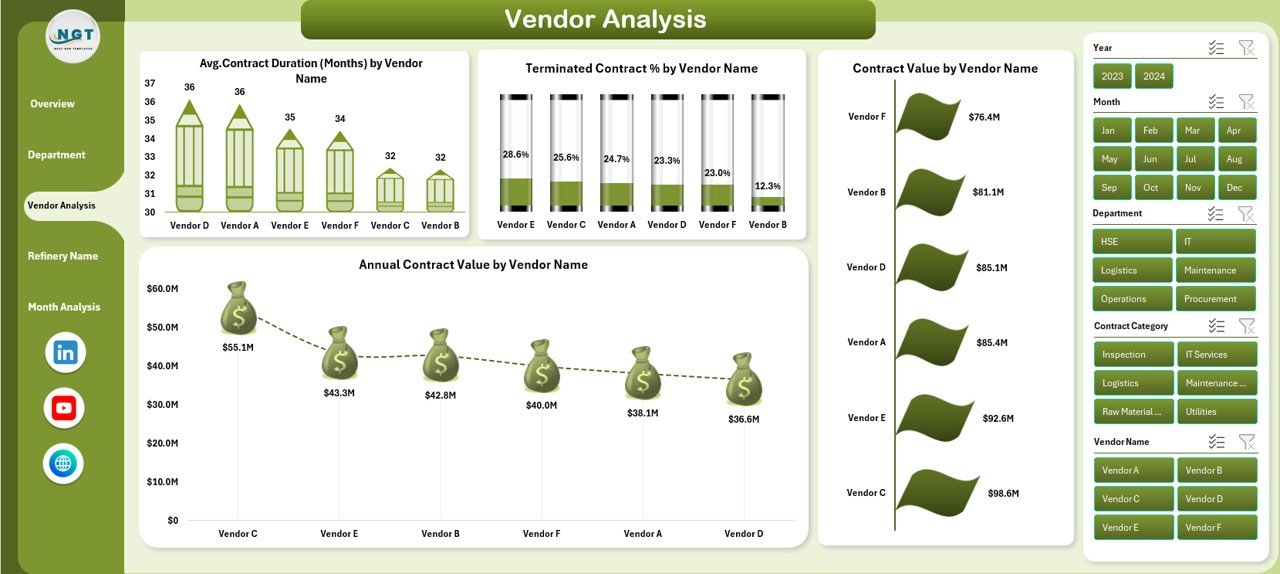
Vendor management plays a critical role in refinery operations. Therefore, this dashboard includes a detailed Vendor Analysis page.
🔹 Key Features of Vendor Analysis
-
Vendor-wise performance metrics
-
Contract value comparison
-
Termination rate analysis
🔹 Charts Included
📈 Average Contract Duration by Vendor Name
This chart shows how long vendors usually stay engaged.
📉 Terminated Contract % by Vendor Name
This chart helps identify vendors with higher termination rates.
📊 Contract Value by Vendor Name
This visualization displays total contract value handled by each vendor.
📊 Annual Contract Value by Vendor Name
This chart shows yearly contract spending for each vendor.
👉 These insights help procurement teams select reliable vendors and avoid high-risk partners.
4. Refinery Name Analysis – Location-Based Insights
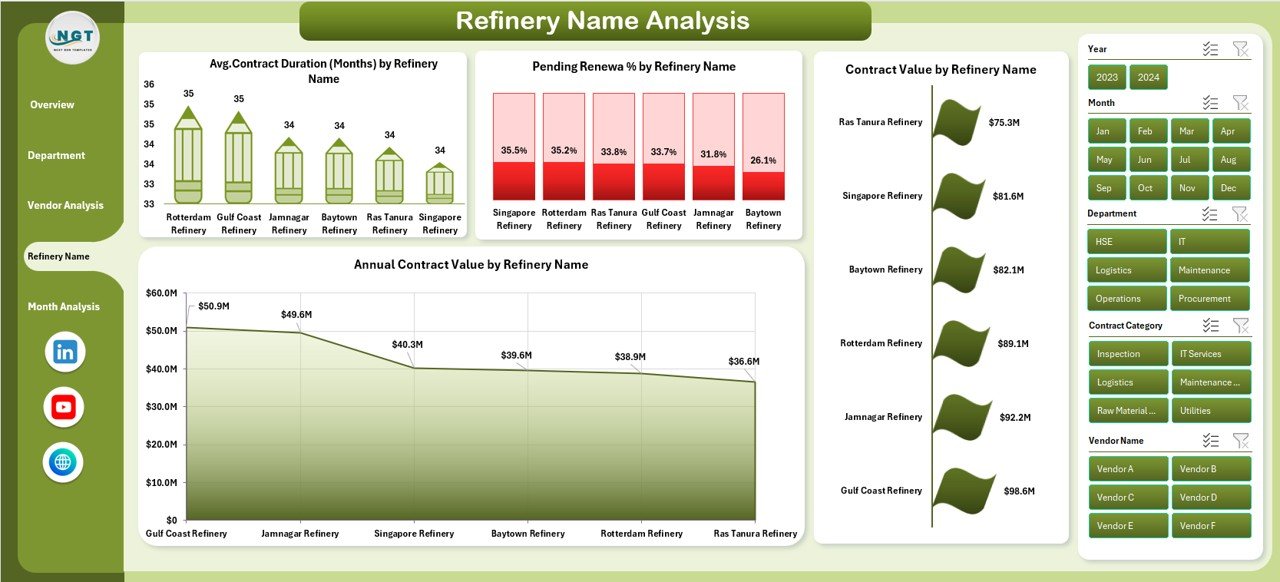
Refineries often operate at multiple locations. Therefore, tracking contract data by location becomes critical.
🔹 Key Highlights
-
Location-based contract insights
-
Refinery-wise performance comparison
-
Easy identification of high-value sites
🔹 Charts Included
📌 Average Contract Duration by Refinery Name
This chart helps compare contract lengths across refinery locations.
📌 Pending Renewal % by Refinery Name
This chart shows renewal risks by location.
📌 Contract Value by Refinery Name
This visualization displays contract distribution across refineries.
📌 Annual Contract Value by Refinery Name
This chart tracks yearly contract value for each refinery.
👉 As a result, management can prioritize critical locations easily.
5. Month Analysis – Time-Based Contract Trends
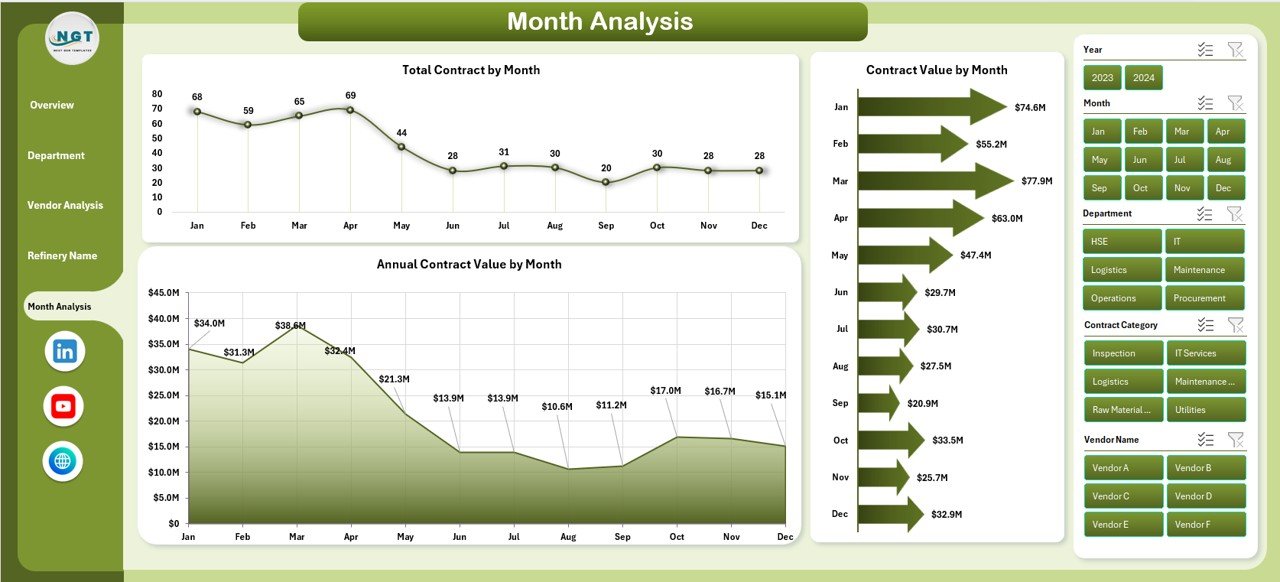
The Month Analysis page focuses on time-based performance.
🔹 Key Insights
-
Monthly contract trends
-
Seasonal contract behavior
-
Yearly growth patterns
🔹 Charts Included
📅 Total Contracts by Month
This chart shows monthly contract volume.
📅 Contract Value by Month
This visualization displays monthly contract spending.
📅 Annual Contract Value by Month
This chart helps track yearly contract performance month-wise.
👉 This page helps finance and planning teams forecast future contract needs.
Support Sheet and Data Sheet
Click to Purchases Refinery Contract Management Dashboard in Excel
🔹 Data Sheet
The Data Sheet stores all raw contract data such as:
-
Contract ID
-
Vendor name
-
Department
-
Contract value
-
Start and end dates
-
Contract status
-
Location
-
Renewal status
🔹 Support Sheet
The Support Sheet helps:
-
Manage dropdown lists
-
Maintain slicer data
-
Support calculations
-
Improve dashboard performance
Advantages of Refinery Contract Management Dashboard in Excel
✅ 1. Centralized Contract Control
You can manage all contracts from one dashboard without searching multiple files.
✅ 2. Better Decision-Making
Clear charts and KPIs help leaders take quick and accurate decisions.
✅ 3. Improved Contract Visibility
Teams can track active, expired, and pending contracts easily.
✅ 4. Enhanced Vendor Management
Vendor-wise insights help reduce risks and improve negotiations.
✅ 5. Time-Saving Reporting
The dashboard automatically updates insights once data changes.
✅ 6. Cost Optimization
You can identify high-cost contracts and reduce unnecessary expenses.
✅ 7. Easy Customization
Excel allows full customization without technical skills.
Best Practices for Refinery Contract Management Dashboard in Excel
✔ Keep Data Updated Regularly
Always update contract data on time to maintain accuracy.
✔ Use Standard Naming Conventions
Maintain uniform contract and vendor names to avoid errors.
✔ Review Dashboard Weekly
Regular reviews help identify issues before they grow.
✔ Track Expiry Dates Carefully
Always monitor contracts nearing expiry.
✔ Analyze Vendor Performance Monthly
Remove low-performing vendors quickly.
✔ Protect the File with Access Control
Limit editing rights to avoid data loss.
✔ Maintain Backup Files
Always keep backup copies for safety.
How Does This Dashboard Help Refinery Management?
This dashboard helps refinery management to:
-
Reduce contract risks
-
Improve vendor accountability
-
Control spending
-
Track renewals
-
Improve compliance
-
Support strategic planning
As a result, leadership gains full visibility and control over refinery contracts.
Who Can Use This Dashboard?
This dashboard works perfectly for:
-
Refinery Managers
-
Contract Managers
-
Procurement Teams
-
Finance Teams
-
Operations Managers
-
Compliance Officers
-
Project Managers
Conclusion
The Refinery Contract Management Dashboard in Excel provides a complete, practical, and user-friendly solution for managing complex refinery contracts. It helps organizations track performance, monitor vendors, analyze trends, and make informed decisions.
Because the dashboard uses Excel, teams can deploy it instantly without extra software. Moreover, its interactive design and detailed analytics make contract management simple and effective.
If your refinery wants better control, improved efficiency, and smarter decisions, this dashboard offers the perfect solution.
Frequently Asked Questions (FAQs)
❓ What is a Refinery Contract Management Dashboard in Excel?
It is an Excel-based tool that helps manage, analyze, and track refinery contracts using visual dashboards and KPIs.
❓ Who can use this dashboard?
Procurement teams, contract managers, refinery managers, finance teams, and compliance teams can use it.
❓ Can I customize this dashboard?
Yes. You can easily modify charts, filters, and data fields as per your requirements.
❓ Does this dashboard support multiple refineries?
Yes. It includes refinery-wise analysis for better location-based tracking.
❓ Does it track vendor performance?
Yes. It provides vendor-wise contract value, duration, and termination insights.
❓ Can I track contract renewals?
Yes. The dashboard clearly shows pending and upcoming renewals.
❓ Is Excel enough for large datasets?
Yes. Excel handles large datasets efficiently when structured properly.
Visit our YouTube channel to learn step-by-step video tutorials