Managing refinery projects without clear visibility often creates cost overruns, safety risks, and missed deadlines. However, when organizations use a Refinery Project Management Dashboard in Power BI, they gain real-time insights, structured reporting, and confident decision-making. Therefore, many refinery operators, EPC contractors, and project managers now rely on Power BI dashboards to control complex project environments.
In this detailed guide, you will learn everything about the Refinery Project Management Dashboard in Power BI. Moreover, you will understand its structure, pages, features, advantages, best practices, and real-world use cases. Additionally, this article explains how Power BI simplifies complex refinery project data into clear and actionable insights.
Click to Purchases Refinery Project Management Dashboard in Power BI
What Is a Refinery Project Management Dashboard in Power BI?
A Refinery Project Management Dashboard in Power BI is an interactive analytics solution that helps organizations track, analyze, and manage refinery projects from a single centralized platform.
Instead of managing multiple spreadsheets, emails, and reports, this dashboard consolidates all project-related KPIs into one visual system. As a result, project teams monitor budgets, costs, safety impact, progress status, and trends with ease.
Because Power BI supports interactive visuals, slicers, and drill-downs, users explore data dynamically. Therefore, stakeholders quickly identify risks, delays, and cost deviations without technical complexity.
Why Do Refinery Projects Need a Power BI Dashboard?
Refinery projects involve high budgets, strict safety standards, and multiple stakeholders. Consequently, manual tracking methods often fail to deliver timely insights.
Here is why refinery projects need a Power BI dashboard:
-
Projects span multiple departments and locations
-
Budgets and costs change frequently
-
Safety impact monitoring remains critical
-
Managers need real-time visibility
-
Leadership expects data-driven decisions
Therefore, a Power BI dashboard transforms scattered project data into structured insights that drive performance and accountability.
What Are the Key Features of a Refinery Project Management Dashboard in Power BI?
This dashboard includes five powerful pages, each designed to answer specific project management questions. Moreover, slicers on every page allow users to filter data by refinery, department, project manager, project type, or time period.
Let us explore each page in detail.
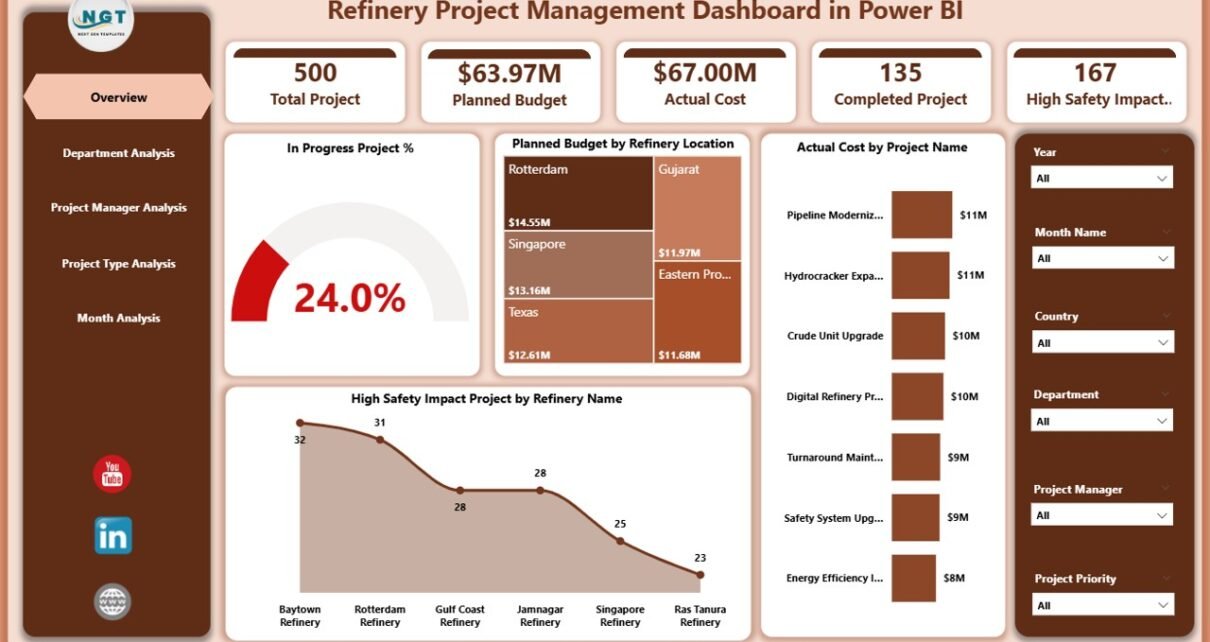
Overview Page: How Can You Get a Quick Snapshot of All Projects?
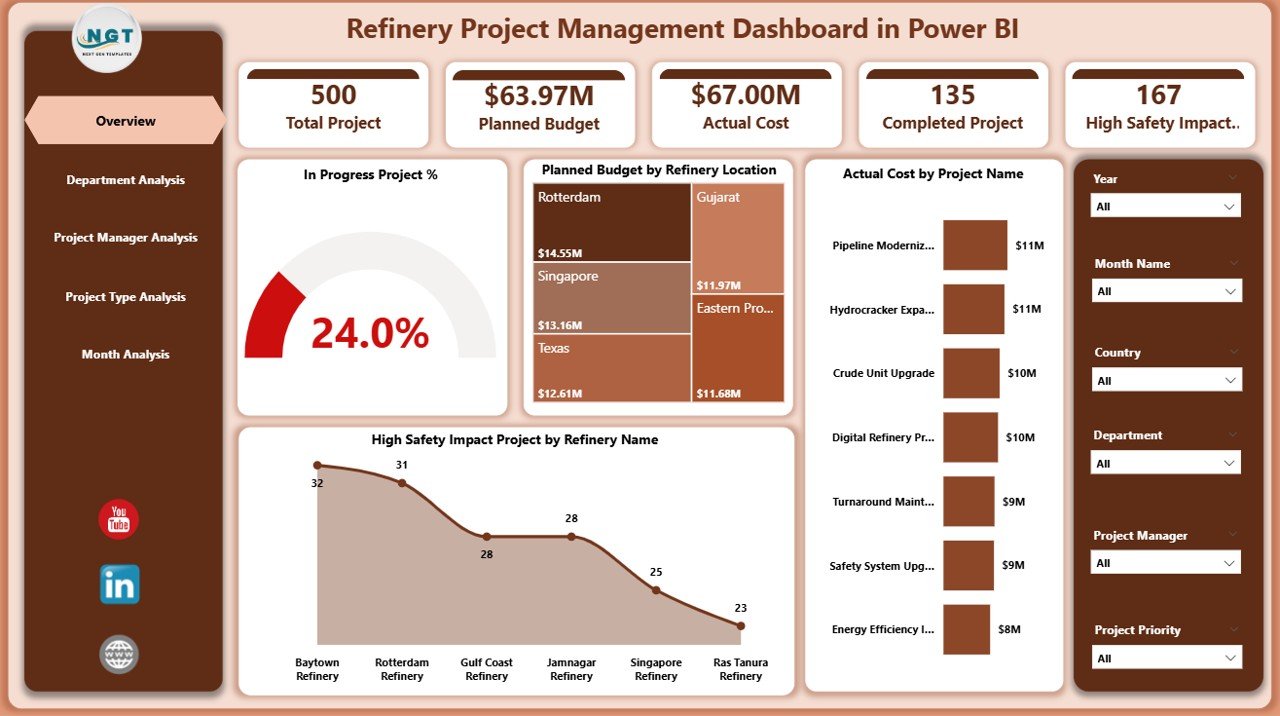
The Overview Page acts as the control center of the dashboard. First, it provides high-level visibility across all refinery projects. Then, it highlights critical KPIs using cards and charts.
Key Elements of the Overview Page
KPI Cards
-
In Progress Project %
-
High Safety Impact Projects
-
Total Planned Budget
-
Total Actual Cost
Charts Included
-
📊 In Progress Project % – Shows the percentage of ongoing projects
-
📍 Planned Budget by Refinery Location – Compares budgets across locations
-
💰 Actual Cost by Project Name – Identifies high-cost projects
-
⚠️ High Safety Impact Projects by Refinery Name – Highlights safety-sensitive projects
Because this page summarizes performance instantly, executives and senior managers use it for quick reviews and strategic decisions.
Click to Purchases Refinery Project Management Dashboard in Power BI
Department Analysis Page: How Do Departments Perform Against Budgets?
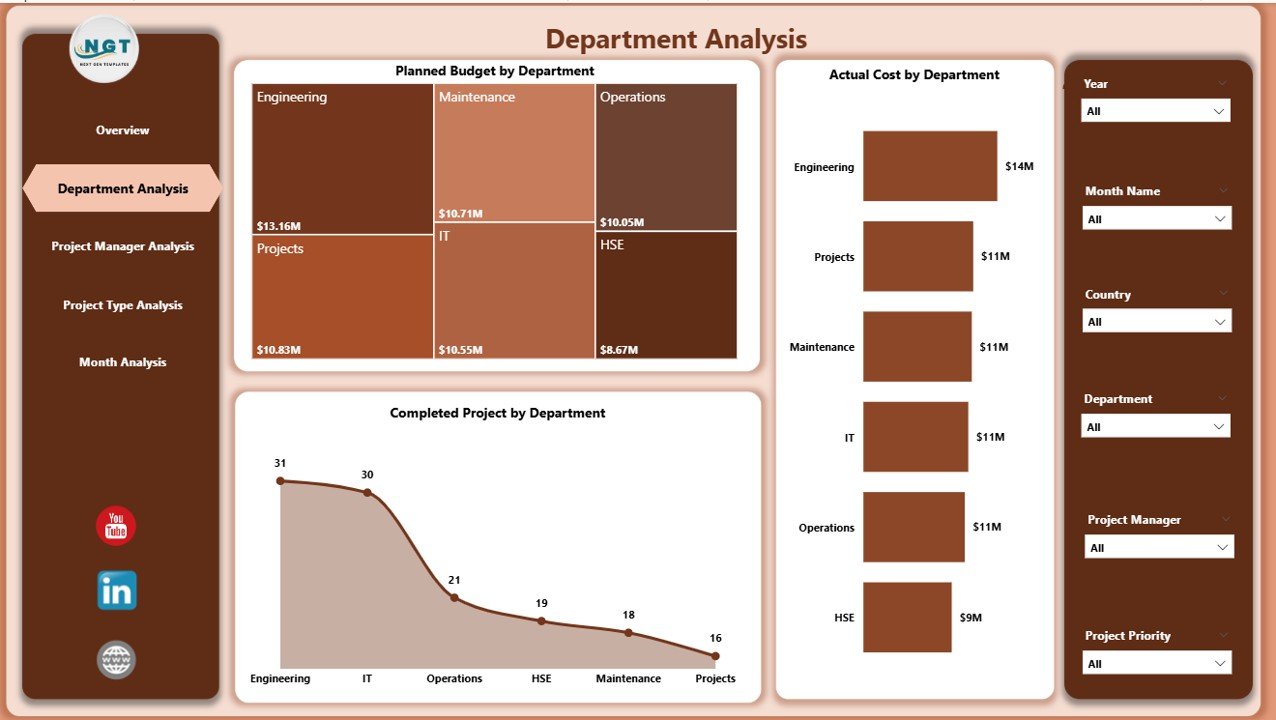
The Department Analysis Page focuses on performance at the departmental level. Therefore, it helps identify departments that manage budgets efficiently and those that require attention.
Charts on the Department Analysis Page
-
📊 Planned Budget by Department
-
💸 Actual Cost by Department
-
✅ Completed Projects by Department
As a result, project leaders compare spending patterns across departments. Moreover, they identify cost overruns early and take corrective actions faster.
Project Manager Analysis Page: How Do Project Managers Deliver Results?
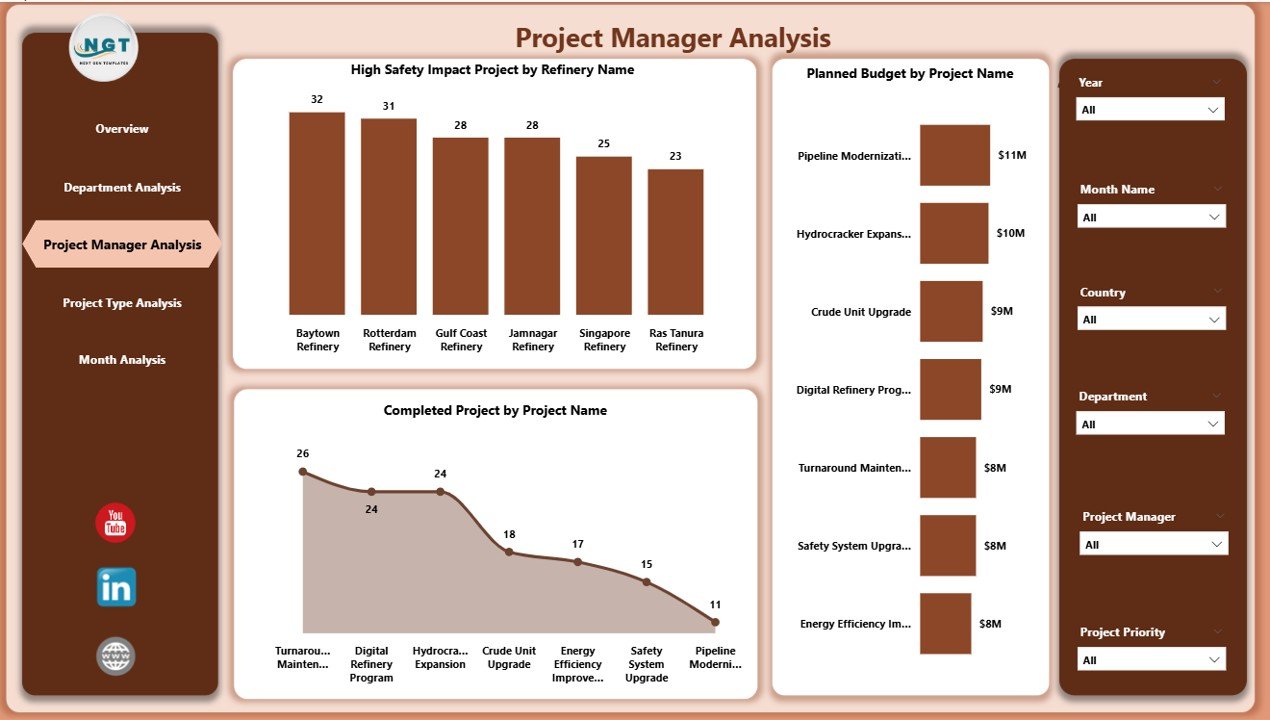
The Project Manager Analysis Page evaluates individual project managers. Consequently, it supports accountability and performance benchmarking.
Key Visuals on This Page
-
⚠️ High Safety Impact Projects by Refinery Name
-
💰 Planned Budget by Project Name
-
✔️ Completed Projects by Project Name
Because this page highlights project ownership, leadership teams quickly recognize top performers. Additionally, they identify managers who need support or training.
Click to Purchases Refinery Project Management Dashboard in Power BI
Project Type Analysis Page: Which Project Types Consume More Resources?
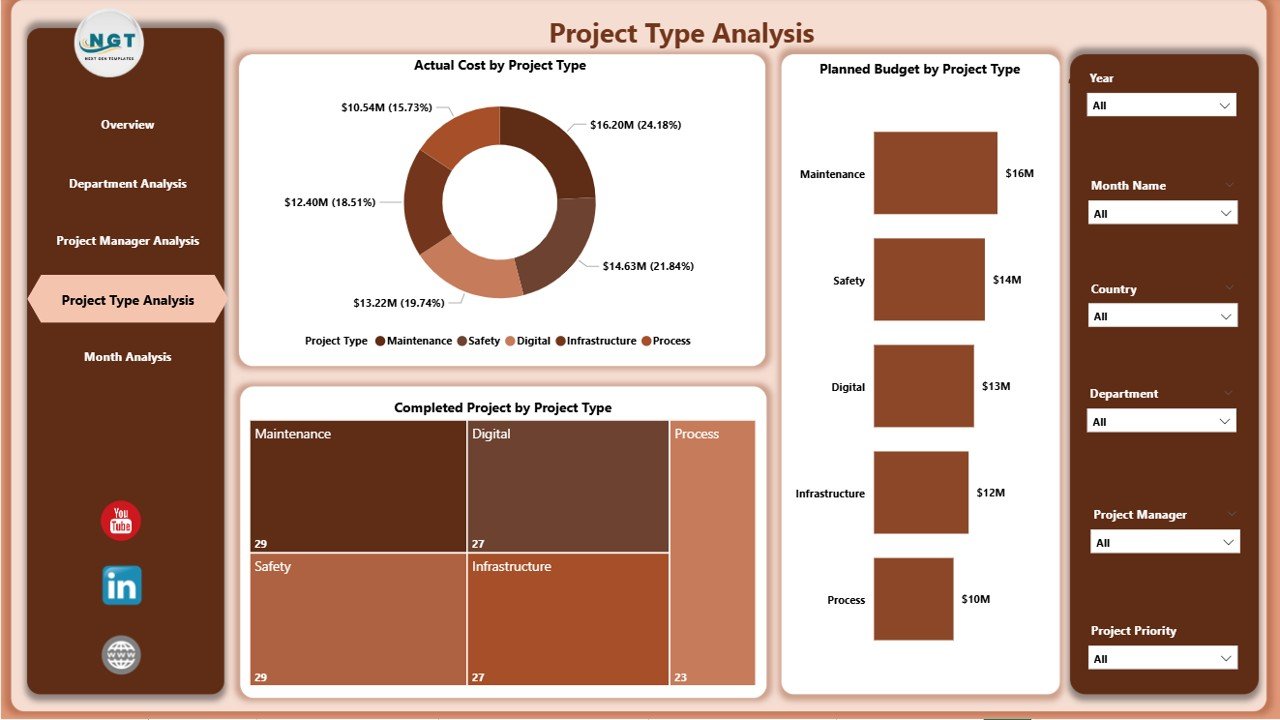
The Project Type Analysis Page groups projects by type. Therefore, it helps organizations understand cost and completion trends across different project categories.
Charts Included
-
💸 Actual Cost by Project Type
-
📊 Planned Budget by Project Type
-
✔️ Completed Projects by Project Type
As a result, decision-makers evaluate which project types deliver better value. Moreover, they refine investment strategies based on historical performance.
Monthly Trends Page: How Do Projects Perform Over Time?
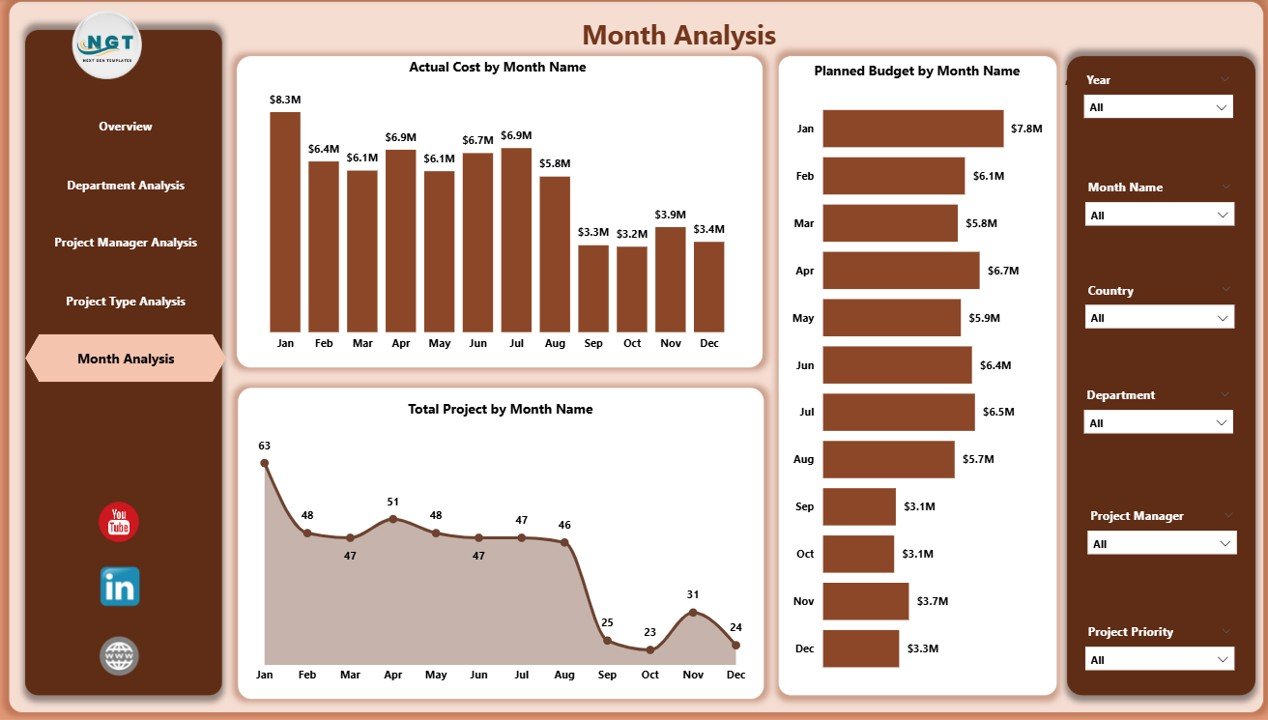
The Monthly Trends Page tracks performance across time. Therefore, it supports forecasting, trend analysis, and seasonal planning.
Monthly Trend Charts
-
📈 Actual Cost by Month
-
📊 Planned Budget by Month
-
📅 Total Projects by Month
Because trends reveal spending patterns, organizations anticipate future budget needs more accurately.
How Does Power BI Improve Refinery Project Visibility?
Power BI transforms raw project data into interactive visuals. Moreover, it enables users to drill down from summary to detail instantly.
Key Benefits of Power BI for Refinery Projects
-
Real-time data refresh
-
Interactive slicers and filters
-
Visual storytelling with charts
-
Secure role-based access
-
Seamless integration with Excel and databases
Therefore, teams focus more on decisions and less on manual reporting.
Advantages of Refinery Project Management Dashboard in Power BI
Using a Refinery Project Management Dashboard in Power BI delivers several advantages.
Strategic Advantages
-
✅ Centralized project monitoring
-
✅ Improved cost control
-
✅ Enhanced safety oversight
-
✅ Faster decision-making
-
✅ Better stakeholder communication
Operational Advantages
-
📊 Real-time KPI tracking
-
📈 Trend-based forecasting
-
📉 Early risk identification
-
⚙️ Reduced manual reporting effort
As a result, organizations achieve higher efficiency and project success rates.
Who Can Benefit from a Refinery Project Management Dashboard?
This dashboard supports multiple stakeholders across the refinery ecosystem.
Key Beneficiaries
-
Project Managers
-
Department Heads
-
Safety Officers
-
Finance Teams
-
Operations Managers
-
Executive Leadership
Because each user accesses relevant insights, collaboration improves significantly.
Best Practices for the Refinery Project Management Dashboard in Power BI
Following best practices ensures accuracy, adoption, and long-term value.
1. Standardize Project Data
Always maintain consistent project names, departments, and types. Therefore, visuals remain accurate and reliable.
2. Define Clear KPIs
Select KPIs that align with refinery goals. For example:
-
Budget variance
-
Completion rate
-
Safety impact
3. Use Simple and Clear Visuals
Avoid cluttered visuals. Instead, use clean charts that highlight insights quickly.
4. Refresh Data Regularly
Schedule automatic refreshes. As a result, users always view updated information.
5. Train End Users
Provide basic Power BI training. Therefore, users explore data confidently.
How Does This Dashboard Support Safety and Compliance?
Safety plays a critical role in refinery projects. Therefore, tracking High Safety Impact Projects helps organizations prioritize resources and controls.
Safety Benefits
-
Identifies high-risk projects
-
Improves safety planning
-
Enhances compliance reporting
-
Supports proactive risk mitigation
As a result, organizations reduce incidents and improve regulatory compliance.
Can This Dashboard Scale with Growing Project Portfolios?
Yes, this dashboard scales easily. Power BI handles large datasets efficiently. Moreover, organizations add new projects, departments, or refineries without redesigning the dashboard.
Therefore, the solution grows with your business.
How Does This Dashboard Improve Decision-Making?
This dashboard replaces guesswork with data. Because insights remain visual and interactive, leaders make faster and smarter decisions.
Decision-Making Improvements
-
Faster identification of cost overruns
-
Better allocation of budgets
-
Improved project prioritization
-
Enhanced performance reviews
Consequently, projects stay on track and within budget.
How Can Organizations Customize This Dashboard?
Customization ensures relevance. Organizations tailor visuals, KPIs, and slicers to meet specific needs.
Customization Options
-
Add new KPIs
-
Modify charts and layouts
-
Apply branding themes
-
Create role-based views
Therefore, the dashboard aligns perfectly with business objectives.
What Challenges Does This Dashboard Solve?
Refinery projects face several challenges. This dashboard addresses them effectively.
Challenges Solved
-
Data silos
-
Budget overruns
-
Limited visibility
-
Delayed reporting
-
Safety oversight gaps
As a result, project governance improves significantly.
Conclusion: Why Should You Use a Refinery Project Management Dashboard in Power BI?
A Refinery Project Management Dashboard in Power BI delivers clarity, control, and confidence. It transforms complex project data into meaningful insights. Moreover, it improves budget tracking, safety monitoring, and performance management.
When refinery organizations adopt this dashboard, they reduce risks, improve efficiency, and enhance decision-making. Therefore, this solution becomes essential for modern refinery project management.
Frequently Asked Questions (FAQs)
What is a Refinery Project Management Dashboard in Power BI?
Click to Purchases Refinery Project Management Dashboard in Power BI
It is an interactive Power BI dashboard that tracks refinery project KPIs such as budgets, costs, safety impact, and progress.
Who should use this dashboard?
Project managers, department heads, safety teams, finance teams, and executives benefit the most.
Can this dashboard track safety-related projects?
Yes, it highlights high safety impact projects clearly.
Does this dashboard support monthly trend analysis?
Yes, it includes a dedicated Monthly Trends page.
Can organizations customize this dashboard?
Yes, users customize KPIs, visuals, and filters easily.
Is Power BI suitable for large refinery datasets?
Yes, Power BI handles large datasets efficiently.
Does this dashboard reduce manual reporting?
Absolutely. It automates reporting and visualization.
How often should data refresh?
Organizations should refresh data daily or weekly based on needs.
Visit our YouTube channel to learn step-by-step video tutorials