Electricity procurement plays a critical role in controlling operational costs for utilities, manufacturing plants, commercial buildings, and public sector organizations. Every unit of electricity purchased directly impacts budgets, compliance, sustainability goals, and long-term profitability. Therefore, organizations must monitor electricity procurement performance clearly, continuously, and accurately.
However, when electricity procurement data remains scattered across Excel sheets, invoices, contracts, and utility statements, decision-makers struggle to gain real-time insights. As a result, cost overruns increase, tax impacts remain unclear, and supplier performance becomes difficult to evaluate.
That is exactly why an Electricity Procurement Dashboard in Power BI becomes an essential analytics solution. This dashboard converts raw electricity procurement data into interactive visuals, KPIs, comparisons, and trends. Consequently, procurement teams gain clarity, control, and confidence in every energy purchasing decision.
In this detailed, SEO-friendly guide, you will learn what an Electricity Procurement Dashboard in Power BI is, how it works, its page-by-page structure, key metrics, advantages, best practices, and frequently asked questions. By the end of this article, you will clearly understand how this dashboard transforms electricity procurement management.
Click to Purchases Electricity Procurement Dashboard in Power BI
What Is an Electricity Procurement Dashboard in Power BI?
An Electricity Procurement Dashboard in Power BI is an interactive business intelligence solution designed to analyze electricity purchasing data across suppliers, contract types, energy sources, regions, and time periods.
Instead of reviewing static reports or manual spreadsheets, this dashboard consolidates all procurement data into a centralized Power BI model. As a result, users can track costs, taxes, transmission charges, and consumption trends in real time.
Moreover, Power BI enables slicers, filters, and drill-downs. Therefore, procurement teams can instantly analyze electricity costs by utility supplier, contract type, energy source, or month.
In simple terms, this dashboard turns complex electricity procurement data into clear, actionable insights.
Why Do Organizations Need an Electricity Procurement Dashboard?
Electricity procurement involves multiple cost components, such as energy charges, transmission fees, taxes, and contractual obligations. Without proper visibility, organizations often face hidden costs and inefficiencies.
Here is why this dashboard matters:
-
Electricity costs fluctuate based on contracts, suppliers, and market conditions
-
Tax impacts vary by region and payment status
-
Transmission charges significantly affect total procurement cost
-
Multiple energy sources require comparative analysis
-
Monthly trends influence budgeting and forecasting
Therefore, an Electricity Procurement Dashboard in Power BI helps organizations monitor all these factors from a single platform.
Click to Purchases Electricity Procurement Dashboard in Power BI
How Does an Electricity Procurement Dashboard in Power BI Work?
The dashboard uses structured electricity procurement data stored in Excel, databases, or ERP systems. Power BI connects to these sources and transforms the data using Power Query.
After data modeling, the dashboard calculates KPIs such as gross cost, net procurement cost, tax amount, and tax impact percentage. Then, Power BI visuals present this information through cards, charts, and trends.
Additionally, slicers allow users to filter data dynamically. Consequently, every chart and KPI updates instantly based on user selection.
Page Structure of Electricity Procurement Dashboard in Power BI
This Electricity Procurement Dashboard in Power BI consists of five well-structured pages, each designed to answer specific procurement questions.
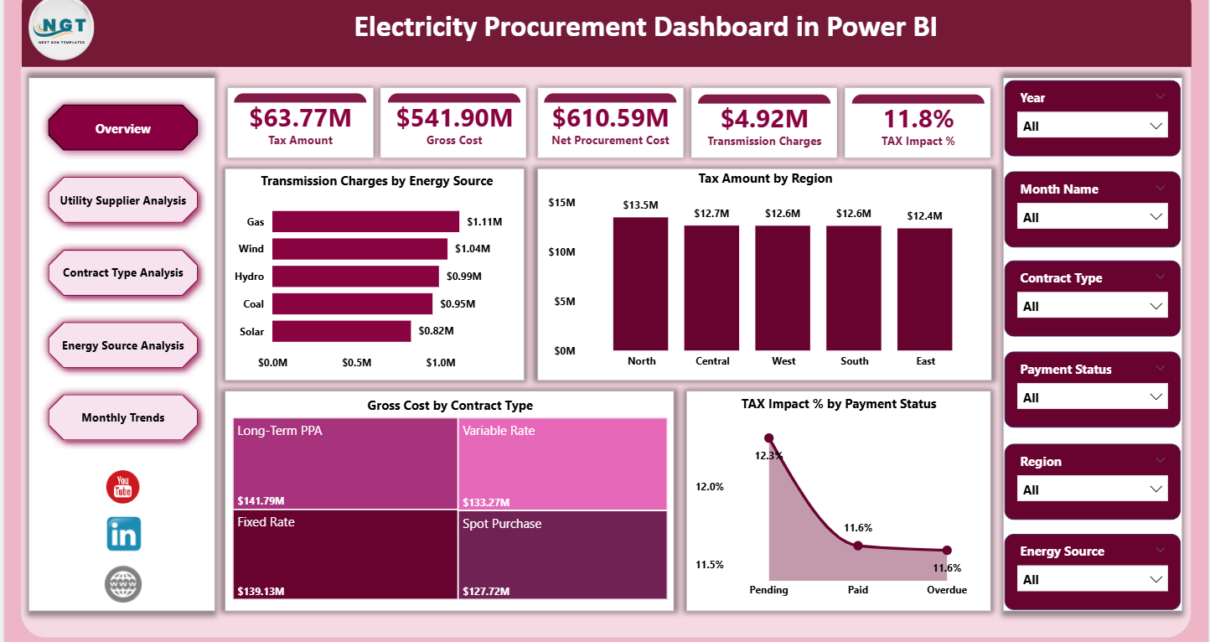
1. Overview Page: What Is the Overall Electricity Procurement Performance?
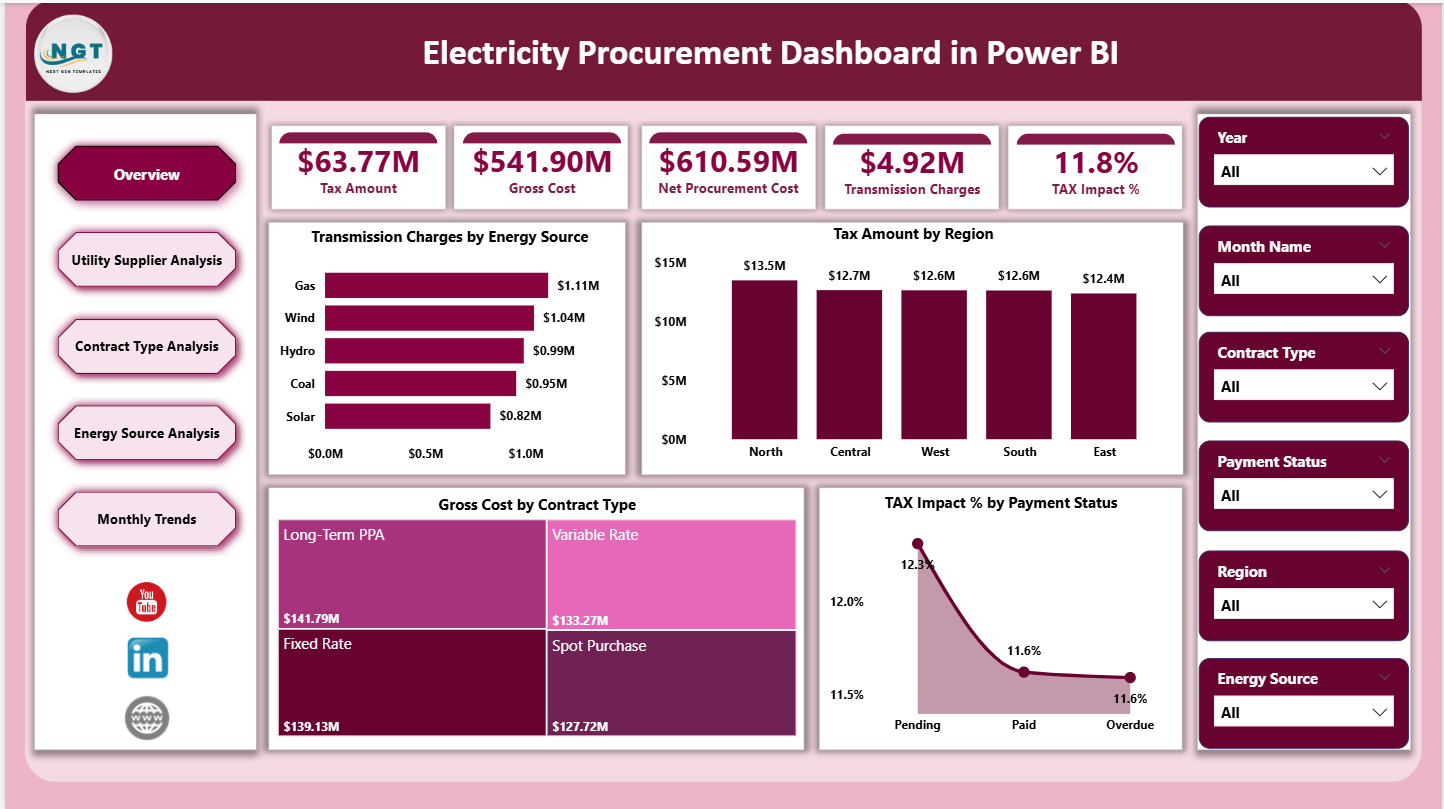
The Overview Page acts as the executive summary of the dashboard. It provides a high-level snapshot of electricity procurement performance.
Key KPIs Displayed as Cards
This page includes five KPI cards that instantly communicate critical cost information:
-
Tax Amount – Total tax paid on electricity procurement
-
Gross Cost – Total electricity procurement cost before deductions
-
Net Procurement Cost – Final cost after adjustments
-
Transmission Charge – Charges related to electricity transmission
-
Tax Impact % – Percentage impact of tax on total procurement cost
These cards allow decision-makers to assess procurement health at a glance.
Charts on the Overview Page
To support the KPI cards, the page includes four analytical charts:
-
Transmission Charges by Energy – Shows how transmission costs vary across energy sources
-
Tax Amount by Region – Highlights regional tax differences
-
Gross Cost by Contract Type – Compares procurement costs across contract models
-
Tax Impact % by Payment Status – Analyzes how payment methods affect tax impact
Why the Overview Page Is Important
-
It provides instant visibility into total electricity procurement costs
-
It highlights high-tax regions and expensive contract types
-
It supports executive-level decision-making
2. Utility Supplier Analysis: Which Utility Suppliers Perform Best?
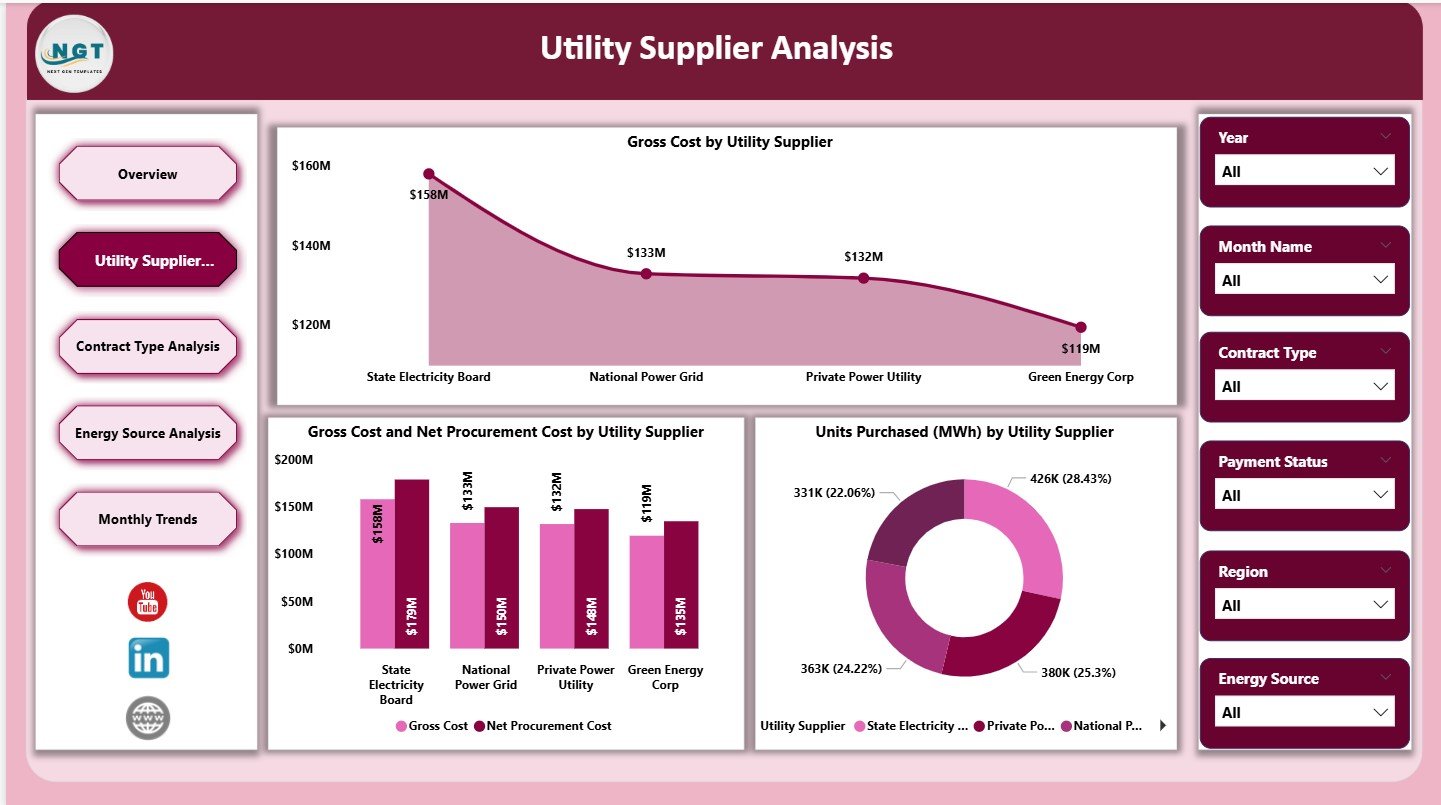
The Utility Supplier Analysis page focuses on supplier-level procurement performance.
Charts on Utility Supplier Analysis Page
This page includes three key charts:
-
Gross Cost by Utility Supplier – Compares total procurement cost across suppliers
-
Gross Cost vs Net Procurement Cost by Utility Supplier – Identifies cost adjustments and deductions
-
Units Purchased (MWh) by Utility Supplier – Shows energy volume purchased from each supplier
Why Utility Supplier Analysis Matters
-
It helps identify high-cost suppliers
-
It supports supplier negotiations
-
It improves supplier performance evaluation
Therefore, procurement teams can decide whether to continue, renegotiate, or replace specific utility suppliers.
Click to Purchases Electricity Procurement Dashboard in Power BI
3. Contract Type Analysis: Which Contract Types Are Most Cost-Effective?
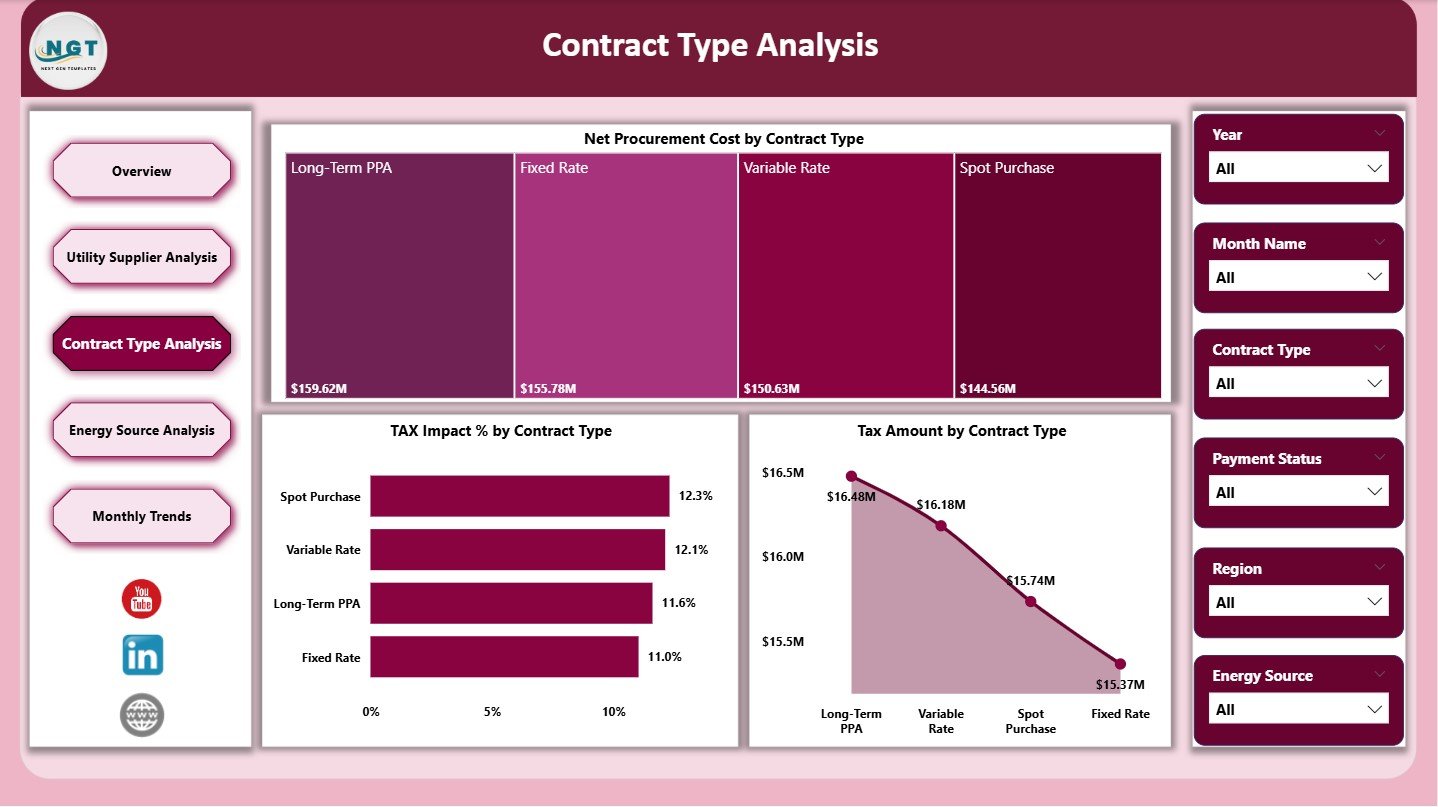
Electricity procurement often involves different contract structures. The Contract Type Analysis page evaluates cost and tax impact across contract models.
Charts on Contract Type Analysis Page
This page includes three focused charts:
-
Net Procurement Cost by Contract Type – Compares final costs across contracts
-
Tax Impact % by Contract Type – Identifies contracts with higher tax burden
-
Tax Amount by Contract Type – Shows total tax paid per contract type
Business Value of Contract Type Analysis
-
It supports smarter contract selection
-
It reduces tax exposure
-
It improves long-term procurement planning
As a result, organizations can choose contracts that align with cost and compliance goals.
4. Energy Source Analysis: How Do Different Energy Sources Affect Cost?
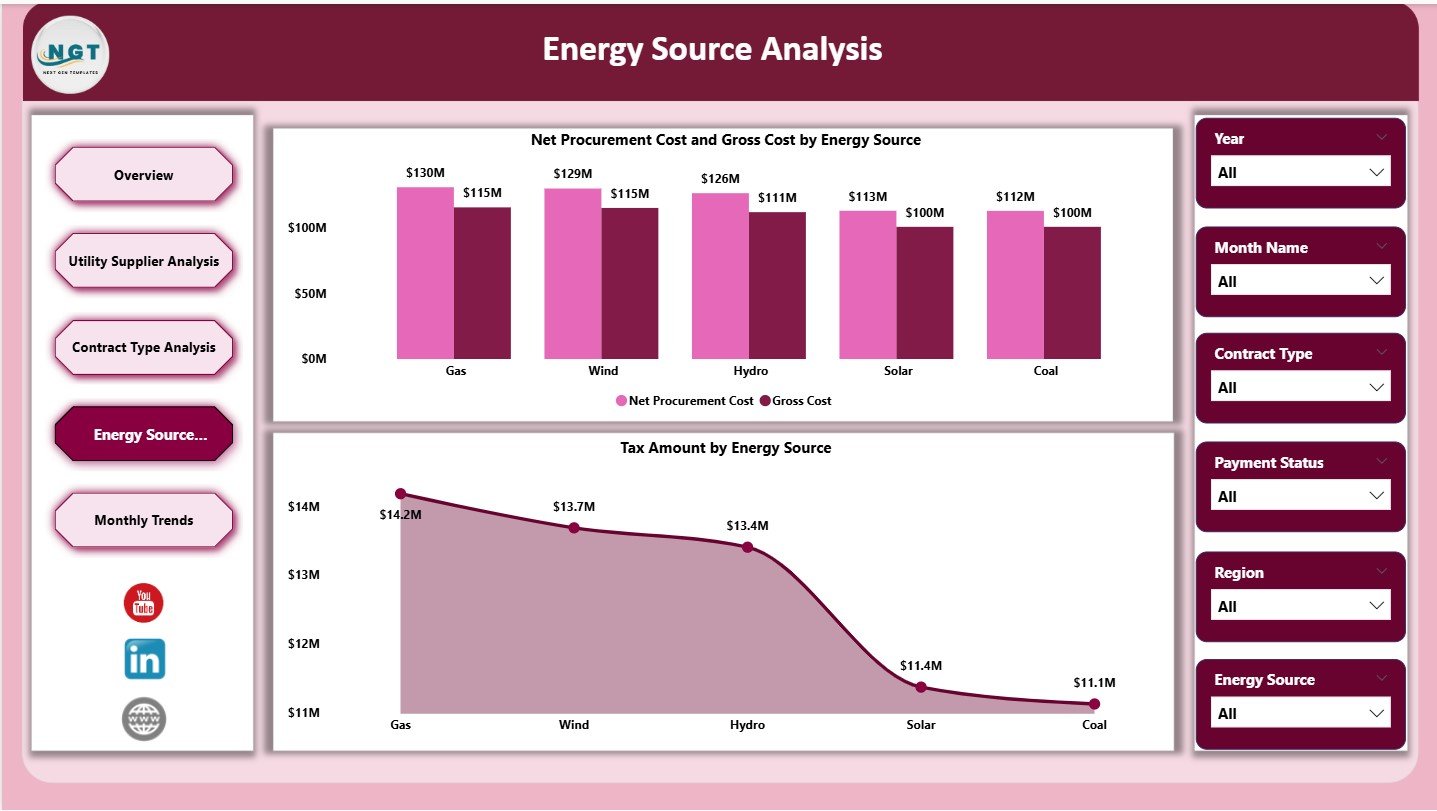
Energy procurement increasingly involves multiple sources such as coal, solar, wind, and hydro. The Energy Source Analysis page evaluates cost performance by energy type.
Charts on Energy Source Analysis Page
This page includes two comparative charts:
-
Net Procurement Cost vs Gross Cost by Energy Source – Highlights cost differences and deductions
-
Tax Amount by Energy Source – Shows how tax varies across energy types
Why Energy Source Analysis Is Critical
-
It supports sustainability-driven procurement decisions
-
It helps balance cost and renewable energy goals
-
It highlights tax-efficient energy sources
Consequently, organizations can align procurement strategies with environmental and financial objectives.
5. Monthly Trends: How Do Electricity Procurement Costs Change Over Time?
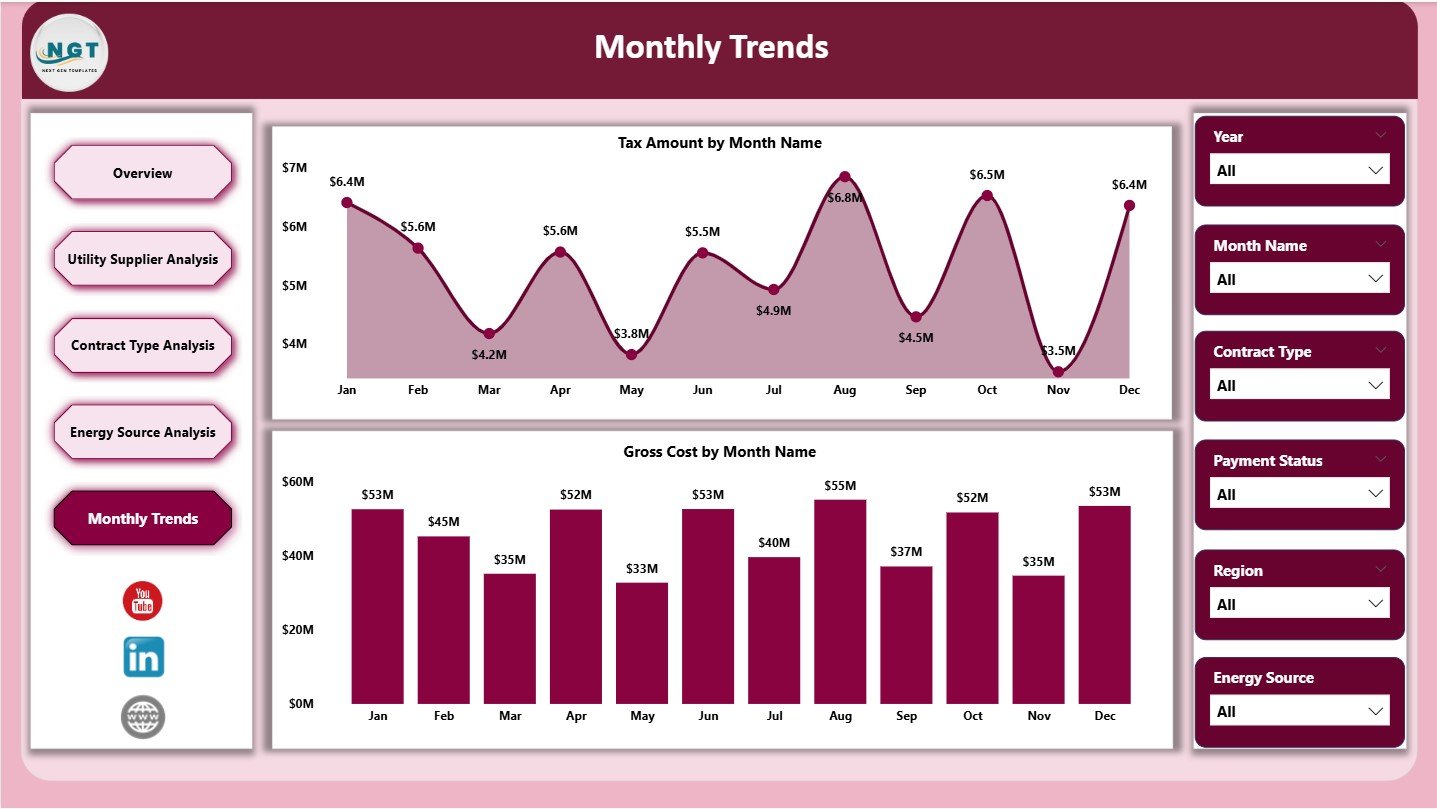
The Monthly Trends page focuses on time-based analysis. It helps identify seasonal patterns and cost fluctuations.
Charts on Monthly Trends Page
This page includes two trend charts:
-
Tax Amount by Month – Tracks monthly tax variations
-
Gross Cost by Month – Monitors overall electricity procurement cost trends
Benefits of Monthly Trend Analysis
-
It supports budgeting and forecasting
-
It identifies abnormal cost spikes
-
It improves financial planning accuracy
Therefore, procurement and finance teams can plan future electricity purchases more effectively.
Key Metrics Tracked in Electricity Procurement Dashboard
This dashboard tracks several critical electricity procurement metrics, including:
-
Gross Cost
-
Net Procurement Cost
-
Tax Amount
-
Tax Impact Percentage
-
Transmission Charges
-
Units Purchased (MWh)
-
Cost by Supplier
-
Cost by Contract Type
-
Cost by Energy Source
-
Monthly Cost Trends
Each metric contributes to a comprehensive view of electricity procurement performance.
Click to Purchases Electricity Procurement Dashboard in Power BI
Advantages of Electricity Procurement Dashboard in Power BI
Why Should You Use This Dashboard?
Using an Electricity Procurement Dashboard in Power BI delivers several business advantages:
-
✅ Centralized electricity procurement analytics
-
✅ Real-time cost and tax visibility
-
✅ Interactive supplier and contract analysis
-
✅ Improved budgeting and forecasting
-
✅ Faster, data-driven decision-making
Moreover, Power BI eliminates manual reporting effort and reduces errors.
Best Practices for Using an Electricity Procurement Dashboard in Power BI
To maximize value, follow these best practices:
-
🔹 Maintain clean and consistent source data
-
🔹 Update procurement data regularly
-
🔹 Use standardized contract and supplier naming
-
🔹 Monitor tax impact monthly
-
🔹 Combine dashboard insights with procurement policies
By following these practices, organizations ensure long-term dashboard accuracy and relevance.
Who Can Benefit from an Electricity Procurement Dashboard?
This dashboard benefits multiple stakeholders, such as:
-
Electricity procurement teams
-
Utility management professionals
-
Finance and accounting teams
-
Sustainability and energy managers
-
Government and public sector agencies
Each group gains actionable insights tailored to their decision-making needs.
Conclusion: Why Electricity Procurement Dashboards Matter More Than Ever
Electricity procurement complexity continues to increase due to rising energy costs, regulatory changes, and sustainability demands. Therefore, organizations must move beyond static reports and spreadsheets.
An Electricity Procurement Dashboard in Power BI provides clarity, transparency, and control. It empowers teams to analyze costs, taxes, suppliers, contracts, energy sources, and trends from a single interactive platform.
Ultimately, this dashboard transforms electricity procurement from a reactive process into a strategic advantage.
Frequently Asked Questions (FAQs)
What data is required for an Electricity Procurement Dashboard in Power BI?
You need electricity invoices, supplier details, contract types, energy sources, tax data, transmission charges, and monthly consumption data.
Can this dashboard handle multiple regions?
Yes, the dashboard supports regional analysis, including tax amount by region.
Is Power BI suitable for large electricity procurement datasets?
Yes, Power BI efficiently handles large datasets and complex calculations.
Can slicers filter data dynamically?
Absolutely. Slicers allow instant filtering by supplier, contract type, energy source, and time period.
Does this dashboard support monthly trend analysis?
Yes, the Monthly Trends page provides clear time-based insights for tax and cost tracking.
Click to Purchases Electricity Procurement Dashboard in Power BI
Visit our YouTube channel to learn step-by-step video tutorials